HAL Id: halshs-01484117
https://halshs.archives-ouvertes.fr/halshs-01484117
Submitted on 6 Mar 2017
HAL is a multi-disciplinary open access
archive for the deposit and dissemination of
sci-entific research documents, whether they are
pub-lished or not. The documents may come from
L’archive ouverte pluridisciplinaire HAL, est
destinée au dépôt et à la diffusion de documents
scientifiques de niveau recherche, publiés ou non,
émanant des établissements d’enseignement et de
Price and Network Dynamics in the European Carbon
Market
Andreas Karpf, Antoine Mandel, Stefano Battiston
To cite this version:
Andreas Karpf, Antoine Mandel, Stefano Battiston. Price and Network Dynamics in the European
Carbon Market. 2017. �halshs-01484117�
Documents de Travail du
Centre d’Economie de la Sorbonne
Price and Network Dynamics in the European
Carbon Market
Andreas K
ARPF,Antoine M
ANDEL,Stefano B
ATTISTONPrice and Network Dynamics in the European
Carbon Market
Andreas Karpf
§, Antoine Mandel
¶, Stefano Battiston
kAbstract
This paper presents an analysis of the European Emission Trading System as a transaction network. It is shown that, given the lack of a centralized market place, industrial actors had to resort to local con-nections and financial intermediaries to participate in the market. This gave rise to a hierarchical structure in the transaction network. To em-pirically relate networks statistics to market outcomes a PLS-PM mod-eling technique is introduced. It is shown that the asymmetries in the network induced market inefficiencies (e.g increased bid-ask spread). Albeit the efficiency of the market has improved from the beginning of Phase II, the asymmetry persists, imposing unnecessary additional costs on agents and reducing the effectiveness of the market as a miti-gation instrument.
1
Introduction
The European Union Emission Trading Scheme (EU-ETS) is the cor-nerstone of European climate policy. On the one hand, it should allow Europe to reduce its carbon emissions at the least possible cost (see e.g Stavins, 1995). On the other hand, it should induce economic actors to account for the cost of carbon in their investment decisions (see e.g Laing et al., 2013; Koch et al., 2014). To fulfill these objectives, the price of carbon has to be a strong and stable signal, the carbon market has to aggregate information efficiently and rapidly.
The history of the ten first years of the market, summarized in figure 1, shows it has failed dramatically in both respects. Prices have been extremely volatile, participation has been restricted, information has been aggregated slowly and inefficiently. A characteristic failure is the fact that the massive overallocation of allowances at the beginning of phase I was diagnosed only after the first reporting period and not endogenously by the market.
§
corresponding author,Centre d’economie de la Sorbonne, University Paris 1 Pantheon-Sorbonne
¶
Centre d’economie de la Sorbonne,Paris School of Economics, University Paris 1 Pantheon-Sorbonne
k
These symptoms of inefficiency have been clearly established in the literature. We also argue that the root cause of this inefficiency can easily be grasped by intuition : a poor market design that hadn’t fore-seen the need to create a centralized exchange platform. Yet, we also argue that there are still lessons to be learnt by looking at the mechan-ics of failure. A unique feature of the European carbon market is the availability of a data set which contains all the transactions performed on the market. Therefrom, the complete transaction network can be reconstructed. One can then relate the evolution of the structure of the network to the emergence of market inefficiencies.
We hence follow the growing strand of literature that investigates market dynamics with a network-based approach, to gain a detailed understanding of the structure of the EU-ETS market and the rela-tionships between network structure, informational asymmetries and market dynamics. Therefore a set of empirical relationships between the structure of the trade network and the outcome/efficiency of the market is established. More specifically with regard to the latter, we track the evolution of prices, bid-ask spreads and profits. These empiri-cal relationships can be used to track future developments in European carbon trading but also to assess the efficiency of other markets.
Our analysis shows that in the absence of a central market place, agents had to resort to local networks and financial intermediaries to exchange emission certificates. This led to the emergence of hierarchi-cal and assortative networks with fat tailed degree distributions, which turned out to be rather inefficient in terms of the price discovery mech-anism and the incorporation of new information. It is demonstrated how the hierarchy in the market as implied by the observed fat tailed degree distributions as well as the hierarchical structure of the net-work can be associated to informational asymmetries in the market. We further show how informed traders can be characterized in terms of centrality measures, and how the evolution of connectivity patterns can serve as an indicator for volatility or liquidity on the market. We find that market efficiency improved during Phase II as the share of spot market trading increases. It is however also shown that the major flaws of the EU ETS in principle persist.
The paper also provides a methodological contribution by intro-ducing a Partial Least Squares Path Modeling (PLS–PM) approach to define endogenously the temporal evolution of the network rather than resorting to an exogenously fixed time-window. Using this approach allows to investigate the structural evolution of the trading network in a dynamic manner.
The remainder of the paper is organized as follows. Section 2 re-views the related literature. Section 3 provides a description of the or-ganization, the history and the data of the European Emission Trading System. Section 4 and 5 provide respectively a static and a dynamic analysis of the network. Section 6 concludes.
start of Pilot Phase I
first release of verified emission data start of Phase II, integration of CDM/JI approx. begin of VAT fraud
Lehman Brothers collpase
decision to include airline industry news about VAT fraud emerge
trading halt after cyber attack
0 10 20 30 2005 2006 2007 2008 2009 2010 2011 Date EU A pr ice (EUR)
Figure 1: The price of the EUAs over time, annotated with important market
events
2
Related literature
The EU-ETS being the first large-scale carbon market in existence, its performance has been extensively analyzed in the literature. A comprehensive overview of the design, the history and of the early literature on the EU-ETS is given in (Ellerman, 2010). The existence of a very detailed dataset about the market has also given rise to a number of firm-level analysis, in particular with regard to determinants of market participation (see in particular Jaraite et al., 2012; Zaklan, 2013; Koch et al., 2014). However, to our knowledge, this paper is the first to focus on transaction-level data.
More specifically related to this paper, a first strand of literature has focused on the determinants of the price formation process on the market. With respect to the determinant of prices, most empirical studies (see e.g Hintermann, 2010; Creti et al., 2012; Koch et al., 2014) find that fundamentals such as economic activity and energy prices, have significant explanatory power for EUA prices. Energy prices are insofar of great importance, as the energy sector is the dominant sector in the EU ETS, and fuel-switching represents a relatively cheap and effective method for power plants to reduce the greenhouse gas emis-sions. However, Hintermann (2010) also emphasizes, that, especially in the beginning of Phase I, EUA prices were not driven by abatement
costs and that new information, with regard to fundamentals, like elec-tricity prices or weather, were only incorporated with a substantial lag, thus indicating inefficiencies in the price formation process. Creti et al. (2012) emphasize a similar discrepancy between phase I and phase II by putting forward the presence of different cointegration relationships between the phases. They also put forward that the influence of “fun-damentals” materialize more clearly in the second phase and identify a number of complementary price drivers such as policy events. Koch et al. (2014) provide similar quantitative results and additionally find that the usage of renewables has a significant explanatory power on the price.
With respect to the efficiency of the market, existing results are rather negative. Palao and Pardo (2012) show the presence of price clustering in the European Carbon Futures Markets, which they in-terpret as a sign of inefficiency and as a weakness of the price signal provided by the market. Charles et al. (2013) investigate the spot and future carbon markets with regard to cost-of-carry hypothesis. The cost-of-carry model is rejected in all cases implying arbitrage possibili-ties and thus an inefficient functioning of the market. High transaction costs have also been identified as an important source of inefficiency (see e.g Jaraite et al., 2012; Zaklan, 2013). They have led to restricted participation and hence reduced the scope and the efficiency of the market . Martin et al. (2014) even points out participants have of-ten perceived the EU–ETS as a compliance mechanism rather than a market-based policy. There exist relatively few theoretical analysis of the micro-economic sources of inefficiency on the carbon market. Med-ina et al. (2014) put forward the role of informational asymmetries as an important source of trading frictions and show that these friction decreased from phase I to phase II.
This paper provides a complementary, more structural, perspec-tive on the issue through a network-based analysis. In this respect, our contribution relates to the burgeoning stream of literature, which emphasizes the analysis of the topological properties of transaction networks as a way to capture in a condensed manner the structural properties of markets. These approaches where applied in a variety of fields ranging from micro-finance/economics (Banerjee et al., 2013; Vignes and Etienne, 2011) through international trade (Duenas and Fagiolo, 2014) to financial markets (Battiston et al., 2012a,b; Chinazzi et al., 2013; Iori et al., 2008).
3
The European Emission Trading System
The European Emission Trading System (ETS) is used to implement European decisions on emission reductions in a range of industrial sec-tors, the so-called ETS secsec-tors, which correspond to close to 50% of the greenhouse gas (GHG) emissions in Europe. More precisely, the ETS covers, above certain capacity thresholds, power stations and other combustion plants, oil refineries, coke ovens, iron and steel plants and factories making cement, glass, lime, bricks, ceramics, pulp, paper and
board as well as, since 2012, aviation.
Emission reductions in non-ETS sectors (mainly transport, agri-culture and waste) are enforced by a range of regulatory measures. Emission reductions in the ETS sector are enforced by a unique and fully market-based mechanism based on the “cap-and-trade” principle. Namely, a certain amount of allowances (EUAs or European Allowance Units in the context of the ETS) are allocated or auctioned to emit-ters of greenhouse gases, e.g on the basis of historical emissions. These emitters also have to surrender each year an amount of allowance corre-sponding to their actual emissions, which are permanently recorded at their installations. Allowances therefore become a scarce resource. As they are moreover legally tradable, there de facto exists a market for allowances, usually referred to as the carbon market. On this market, emitters which have reduced their emissions below their quota can sell their remaining allowances, while emitters which have exceeded their quota can buy available allowances (and hence avoid the payment of a fine). The system is supposed to exploit differing marginal abate-ment costs (MAC), i.e. the marginal cost of reducing green house gas emissions by one unit, between countries, firms, industries or even be-tween different branches within a company (see Ellerman and Decaux, 1998). Emitters from high technology sectors with relatively low levels of emission could thereby profit from the comparatively low abate-ments costs of other companies, e.g from emission intensive industries. In theory, agents should then arbitrate between emission trading and investments in emission reduction technology until marginal abatement costs are equalized. In theory the aggregate emissions should thereby be reduced at the least possible cost.
The actual setting of the ETS is slightly more complex than this theoretical template. On the supply side, on top of the EUAs issued by member states, allowances can be generated through the clean develop-ment (CDM) and joint impledevelop-mentation (JI) mechanisms, which certify emission reductions performed respectively in developing and transi-tion economies. On the demand side, some organizatransi-tions purchase al-lowances in order to discard them or to compensate other emissions and hence reduce the aggregate emission ceiling. Additionally, financial in-stitutions can enter the market as brokers or for other “non-industrial” motivations. In practice, the ETS distinguishes between operator hold-ing accounts (OHA), which correspond to installations/companies with a legal obligation to participate in the ETS, and other actors referred to as private holding accounts (PHA).
From the institutional perspective, the market has been organized in phases: pilot phase I (2005 - 2007), phase II (2008-2012), and phase III (2013 - 2020). Since phase II operators are allowed to bank emission certificates, this means to use a potential surplus of allowances in the next trading period. Borrowing is insofar possible as the allocation of allowances takes place in February each year but operators have to surrender the EUAs only by the end of April (European Commission, 2016). There is no centralized trading platform and allowances have been traded bilaterally over the counter, via a broker or on one the
competing climate exchange markets such as the European Climate Exchange to the European Energy Exchange. The most common form of transactions over the period analyzed in this paper was over the counter.
In practice, the equalization of marginal costs and the reduction of emission at the least possible costs shall materialize only if there is full participation in the market and the market settles rapidly at equilibrium. The long-term instability of the price illustrated in Figure 1 suggests otherwise. While the price of EAUs in the first year of the EU ETS was nearly constantly above twenty euros per ton of carbon dioxide (tCO2), the publication of first verified emission data in April 2006 indicated a large overallocation of certificates and resulted into a market crash which brought EUA prices down to a level close to zero from mid-2007 on. With the beginning of Phase II prices bounced back to pre-“compliance-break” (Alberola and Chevallier, 2009) levels in mid-2008. In subsequent years the price of EUAs fluctuated between ten and fifteen Euros and latter fell close to five euros. Part of this volatility can be explained by exogenous drivers such as the financial crisis or the dynamics of European and Global climate policy (Koch et al., 2014). It is also the case that the history of the European Emission trading system was accompanied by glitches such as a massive VAT carousel fraud (Creti et al., 2012) or the fishing attack of January 2011, which possibly distorted expectations and the price formation process.
Yet, the micro-economic channels through which these exogenous shocks have impacted the market remain unclear. It is also an open question whether part of this volatility/inefficiency has emerged en-dogenously from the micro-economic workings of the market. The ETS however presents a unique opportunity to investigate these issues thanks to the availability of comprehensive transaction data. By law1,
every transaction in the ETS has to be recorded in a public registry maintained by the European commission, the Community Indepen-dent Transaction Log (CITL). The complete dataset is made publicly accessible with an embargo of three years2. In order to grasp the
re-lationships between these micro-level transactions and the macro-level dynamics of the market, a natural approach is to analyze the structural properties of the trade network and its evolution using the transaction data. More generally, the creation of the EU ETS is a unique opportu-nity to observe the formation of a market in vivo and thereby increase understanding of market processes in general (H¨ardle and Kirman, 1995).
1
directives 2003/87/EC and 2009/29/EC 2See http://ec.europa.eu/environment/ets/
Figure 2: The ETS network plotted with respect to the geographical position
(left) and the centrality (fight) of nodes (yellow and blue indicate financial
and industrial agents respectively, the edge color is the same as that of the
source node)
In order to perform this analysis, we extracted the entire transac-tion and compliance data set from 2005 to 2011 using the Python li-brary “scrapy”. This data set comprises 520,000 transactions as well as detailed information about, installations, accounts and the compliance process (allocation, surrendering, verified emissions). For our analysis, transactions connected to the administration of the ETS by govern-ments were discarded3. This brings down the number of transactions to approximately 364,000. The dataset was augmented by ownership data from the “Ownership Links and Enhanced EUTL Dataset ” (Jaraite et al., 2013) and spot prices of the European Allowance Units from Bloomberg. Using the address information contained in the account information we added geocoding to the data set (longitude, latitude) and location specific temperature information. This synthetic dataset delivers a comprehensive picture of the European emission market.
4
The static trading network
In the remainder of the paper we adopt a network perspective on the European emission market, in which transactions are regarded as di-rected edges between a seller (source vertex) and a buyer (target ver-tex). We first adopt a static perspective where the network is formed by the set of all transactions independently of their time stamp. Fig-ure 2 provides a graphical representation of this aggregate network and underlines the presence of different groups of agents in the network. In-dustrial actors are the largest group (6384 actors). They correspond to “operator holding accounts”, that is companies which form the primary demand and supply of allowances as they have a legal obligation to sur-render allowances. The second largest group (2688 agents) consists in
3
CDM finance finance foundation government industry foundation government industry AT AT BE BG CZ DE DK EE ES FI FR GB HU IE IT LI LV NL PL RO SE SI SK other BE GR LU PT BG CZ DE LT DK EE ES FI FR GB GR HU IE IT LI LT LU LV MT MT NL PL PT RO SE SI SK other
Figure 3: Transaction flows between different groups
financial actors, which enter the market as brokers or for financial engi-neering considerations. The third biggest group (106 agents) are agents which participate in the European emission market in the context of the Clean Development Mechanism (CDM). Two smaller groups are governmental organizations (40) as well as foundations/activists (24)4.
The core purpose of the latter group is the reduction of greenhouse gas emissions. Some, not all, try to increase the price of EUAs by buying and discarding certificates.
4.1
The determinants of network formation
The complex structure of the ETS network is the outcome of a large number of micro-level interactions. Accordingly, in view of explaining the aggregate properties of the market, we first investigate the deter-minants of individual transactions.
4.1.1
Exogenous drivers
We first focus on the exogenous drivers of link formation. In this respect, Figure 3 displays the flows of transactions between type and country groups. It indicates there is a tendency for agents to trade with peers from the same country and from different types. In other words, the network seems to display strong assortativity with regards to the location of agents and dissortativity with regards to their type.
4
As mentioned above, in our analysis only transactions deemed to be relevant for the price formation were considered. Transactions connected to the administration (attribu-tion of emission certificates, surrendering etc.) of the market were discarded. Govern-mental organizations thus appear here as normal market participants, who buy and sell certificates. There role is thus not as dominant as one could expect otherwise. Their presence in the analysis is not altering the results.
In order to confirm these insights quantitatively, we ran an Expo-nential Random Graph model5 on the EU ETS trading network, seen
as an unweighted directed network. Table 1 displays the results of our analysis6. It confirms that agents have a propensity to trade with peers
from the same country (strictly positive and significant coefficient of the term nodematch.country). With respect to the mixing behavior among groups, the results clarify the importance of financial agents. They attract transactions from their industrial peers (the coefficients of the terms mix.type.industry.finance and mix.type.finance.industry are both positive and significant) and also strongly interact among them-selves (homophily measured by coefficient mix.type.finance.finance). Oppositely, industrial agents exhibit a strong propensity to trade with partners of different type (heterophily).
Table 1: Results of the ERG model estimated on the EU ETS network
EU ETS trading network
edges
−8.784
∗∗∗(0.033)
transitive
0.376
∗∗∗(0.002)
nodematch.country
2.813
∗∗∗(0.012)
mix.type.finance.finance
0.944
∗∗∗(0.034)
mix.type.industry.finance
0.226
∗∗∗(0.034)
mix.type.finance.industry
0.287
∗∗∗(0.034)
mix.type.industry.industry
−0.998
∗∗∗(0.034)
Akaike Inf. Crit.
457,197.300
Bayesian Inf. Crit.
457,311.100
Notes:
∗∗∗Significant at the 1 percent level.
∗∗
Significant at the 5 percent level.
∗Significant at the 10 percent level.
These results confirm that, lacking a central market place, indus-trial agents resort to local networks and brokerage services from the
5We used the ergm package of the R statnet library (Handcock et al., 2003) 6
The edges term can be regarded as a intercept or offset which controls for the degree of connectedness (density ) in the network. The transitive term can be seen as an auxiliary term to guarantee robustness of the mixing parameters which are in the center of our interest. For the estimation a Maximum Pseudo Likelihood algorithm was used.
financial industry in order to trade allowances. The slightly stronger effect observed for transaction from type finance to industry also sug-gests that brokerage services are more intensively used by buyers than by sellers.
4.1.2
Endogenous drivers
The choice of trading partners does not only depend on exogenous factors. The importance of the position of an agent in the market might also be fundamental in attracting transactions. A network-based perspective allows to quantify these aspects by relating the formation of links to the existing structure of the network.
The degree is the most basic measure of importance of a node in a network. From a structural perspective, assortativity then measures the propensity of nodes to connect to similar nodes in terms of degree. In order to analyze the assortativity of the ETS, we use the Maslov-Sneppen algorithm (see Maslov and Maslov-Sneppen, 2002), which compares the empirical network to a null-model generated by a rewiring pro-cedure7. In the context of the ETS, this null model can be seen as
representing the structure that would have expectedly emerge if all transactions had been performed through the veil of a centralized ex-change platform. The results of the analysis are presented in Figure 4 through degree-degree correlation profiles. They show on the one hand a slightly increased connectedness within the group of highly connected nodes (the lighter green area in the upper right corner of the left hand-side plot) and on the other hand significantly increased degree of asymmetric connectedness i.e. between low- and high degree nodes (the yellow to red area along the axes). These results suggest that large, and hence visible, actors attracted more transactions than they would have through a centralized market.
4.2
Degree distribution and Structure of the
Trad-ing Network
The network structure that emerges from micro-level interactions can be analyzed via its degree distribution. In Figure 5 the in-, out- and total-degree distributions are displayed on a log-log-scale. The graph clearly shows that the distribution exhibit fat tails. Translated into our market context this means, that there are agents whose degree strongly exceeds the average. These agents, which are much better connected than the average, are likely to play a central role in the functioning of the market and hence acquire private information on its operation.
To further investigate the hierarchical structure of the trading net-work, we follow Li and Sch¨urhoff (2014) in analyzing the degree distri-butions in connection with the clustering behavior of agents. Figure 5 displays the the in- and out-degrees8 versus the the cliquishness 9 of
7see B 8
The in- and out-degree, refers to the active and passive connectedness of agents. 9Be the k-core of graph a maximal subgraph in which each vertex has at least degree
Figure 4:
Degree-degree correlation profiles generated by the
Maslov-Sneppen algorithm for the ETS as an undirected (left) and directed (right)
graph.
agents. In doing so one can check for the presence of clustering and if it is related to the connectedness of agents. For the EU ETS trad-ing network we find a negative relationship between the connectedness of agents (in- and out-degree) and their clustering behavior. In other words, the downward sloping cloud implies a hierarchy in the market with a strong core of highly connected nodes (to the right on the plot) surrounded by clusters of weaker connected nodes on the outskirts (to the left of the plot). More precisely, as also illustrated in Figure 2, the trade network is characterized by a core of strongly connected agents from the finance industry (yellow nodes), surrounded by looser con-nected agents from the industry in the periphery of the graph.
The above described structure is also illustrated by the wave-like forms of the density of a network statistics (see Figure 7). Financial
k. The cliquishness or coreness of a vertex is then k if it belongs to the k-core but not to the (k + 1)-core (Seidman, 1983).
Figure 5: Degree Distributions
agents are concentrated at crucial location of the network serving as hubs (as measured by their closeness) or intermediaries (as measured by their betweenness). This structural asymmetry might be a reflection of the informational asymmetry on the ETS market which authors as Medina et al. (2014) have emphasized.
4.3
Network Structure and Market Efficiency
Our analysis suggests that, in absence of a central market-place, the formation of the EU-ETS trading network was driven by the need for traders to identify a potential counterpart through geographical proximity or prominence in the network. These constraints led to the formation of a complex trade network characterized by disassortative mixing behavior (Maslov-Sneppen, see Section 4.1.2), a fat tailed de-gree distributions and a hierarchical structure, with highly connected financial agents in the core and lesser connected industrial agents clus-tering around this core (see Section 4.2).
These asymmetries in the network echo existing evidence in the literature about market inefficiencies (Hintermann, 2010; Creti et al., 2012; Palao and Pardo, 2012; Charles et al., 2013) and informational asymmetries (Medina et al., 2014). On the one hand, geographical ho-mophily suggests that differentials in marginal abatement costs were underexploited by the market. Indeed, one should otherwise have ob-served large trade flows between eastern and western European
coun-Figure 6: Degree vs. Clustering
tries as abatement costs were presumably much lower in the former than in the latter. On the other hand, large central agents are likely to capture information about the functioning of the market and use it to extract informational rents while distorting the price formation process. To test this hypothesis, we perform in the following section an analysis of the joint evolution of the network structure and market outcomes (prices, profits and bid-ask spread).
5
The dynamic trading network
5.1
Overview
An outline of the dynamics of the ETS transaction network is provided in Figure 8, which gives the evolution of key network statistics10 over
the six first years of operation of the market. The picture that emerges is this of a market whose activity and efficiency slowly increases over time.
The evolution of the network’s degree and density underlines the fact that the intensity of trading in the EU ETS grew over time, with a peak in trade period 5. The sustained high level of betweenness centrality from period two on indicates that the network has better transmission properties, i.e trading in the market is less subject to frictions. The closeness centrality score, reflecting the average distance of one node to any node, which reached a peak in trade period four in order to fall again in successive periods tells a similar story. Degree assortativity and disassortativity describe the preferential attachment of nodes to nodes with similar connectivity and vice versa11. While
10
see appendix for their definition
11At a value of 1 the network exhibits perfect assortative mixing, while a value of −1 implies perfect disassortative mixing. Zero indicates that network is non-assortative.
0 3 6 9 0.00 0.25 0.50 0.75 1.00 Clustering Density type CDM finance foundation government industry 0 1 2 3 4 0.00 0.25 0.50 0.75 1.00 Closeness Density type CDM finance foundation government industry 0 1 2 0.00 0.25 0.50 0.75 1.00 Degree Density type CDM finance foundation government industry 0 25 50 75 0.00 0.25 0.50 0.75 1.00 Betweenness Density type CDM finance foundation government industry
Figure 7: Densities plots for various trade network statistics and company
types in the ETS
the assortativity was steadily decreasing up to trade period three, the first period of compliance Phase II, it tends towards zero in subsequent periods. This implies that agents in the later periods (Phase II) were less biased in choosing their trading partner and relied to a higher degree on market signals. This might be due to a higher degree of spot market trading in the later trading periods. While trading on spot markets only accounted to 40% in 2005, this share rose to 70% in 2007 (Convery et al., 2008).
degree closeness transitivity assortativity betweenness density 0.0 0.2 0.4 0.6 0.8 0e+00 1e−04 2e−04 0.00 0.02 0.04 0.06 −0.15 −0.10 −0.05 0.00 0.00 0.03 0.06 0.09 0.0000 0.0005 0.0010 0.0015 0.0020 2 4 6 2 4 6 trade period
Figure 8: Evolution of different network metrics by trade period
5.2
The PLS-PM approach
In the following, we aim to further refine our analysis by linking the dynamics of the network to this of key market indicators such as price, bid-ask spreads and profits. Therefore, a natural approach is to use time-series of market variables and network-statistics to regress the former on the latter. However, although market variables have a well-defined time-stamps, the structure of the network at a given date de-pends on the modeler’s assumption about the length of time during which a trading link shall be considered active. A standard approach in the literature (see e.g Panzarasa et al., 2009; Kossinets and Watts, 2006; Li and Sch¨urhoff, 2014; Puliga et al., 2014) is to use a sliding window on the basis of an assumption about the lifespan of a connec-tion.
Degree Pagerank Closeness Clustering Katz Assortativity Betweenness Density 0.00 0.01 0.02 0.000 0.005 0.010 0.00 0.05 0.10 0.15 0.20 0.00 0.02 0.04 0.06 0.08 −0.05 0.00 0.05 0.10 0.000 0.005 0.000 0.005 0.010 0.015 0.001 0.002 0.003 0.004 0.005 2006 2007 2008 2009 2010 2011 2006 2007 2008 2009 2010 2011 Date v alue 30 90 365 730 1095 1460
Figure 9: Different Network Metrics computed over different window sizes
In the context of the EU-ETS, we lack a natural assumption about the lifespan of connections and, as illustrated in Figure 9, network characteristics exhibit a sizable variability as the window-size increases. In order to overcome this problem and to capture as much as possi-ble of the information provided by the network-structure at different time-scales, we use a nested approach via Partial Least Square Path modeling (PLS-PM).
The method consists in combining (i) an inner model in which one seeks to explain dependent variables by latent variables constructed upon network statistics at a multitude of different window-sizes (see Figure 10)) and (ii) an outer model in which latent network statis-tics are constructed by taking a convex combination of the network statistics using different window-sizes in such a way that the explained variance of the dependent variables be maximized.
−0.8428 −0.0531 −0.608 −0.2943 0.0087 0.2946 0.0219 −0.0305 2e−04 −0.0163 −0.1438 0.0351 −0.0126 0.1794 0.0077 7e−04 0.242 −0.02 −0.0044 0.0484 0.0063 0.0316 0.0446 −0.0481 −0.0296 0.3836 0.0202 0.0245 −0.6037 −0.0045 Spread Profits Price other abatement Asymmetry Density Betweenness Assortativity Katz Closeness Pagerank Degree
Figure 10: Inner Model - Latent Network Statistics vs. spread, profits, price
profits as the respective dependent variables are estimated simultane-ously. This delivers unique time series of score values for each network statistic which delivers a precise picture of the structural evolution of EU ETS trading network. The model consists of:
• Eight reflective latent variable equations of the form Xjk = λ0jk+
λjkLVj+ errorjk with the following parameters: 12: – Degree – PageRank – Closeness – Katz 12
For a technical description of the different network statistics the reader is referred to Appendix C
– Assortativity – Betweenness – Asymmetry – Density
• Two formative latent variable equations of the form LVj= λ0j+
λjkXjk+ errorj (measurement models) with the following
pa-rameters:
– abatement costs
∗ electricity prices (the average of electricity prices from France, Germany, Great Britain and Scandinavia) ∗ oil price (Brent)
∗ temperatures
∗ CO2 commodity price
∗ emissions as recorded in the EU ETS compliance database ∗ country dummy variable
– other
∗ volume traded
∗ the EUROSTOXX stock market indicator as a proxy for overall economic activity
which, via scores of the form LVˆ j = PkwjkXjk represent the
embedded manifest variables.
• Three inner model equations (structural equations), explaining respectively the:
– market price – bid-ask spread – profits
A graphical representation of the inner model as well as the es-timated coefficients is displayed in Figure 10. The two formative la-tent variables can be understood as some sort of instrumental vari-able regressions which represent abatement costs (oil price, tempera-tures, CO2 commodity price, emissions, country dummy variable) and other factors (volume traded, the European stock market indicator EU-ROSTOXX as a proxy for economic activity) deemed to be relevant for the price formation, the bid-ask spread or the ability to generate prof-its out of a trade. The eight reflective latent variable equations each reflect a different network metric. With the exception of the Asymme-try and the Density variables, the networks are all measured on a node level. The variable Asymmetry corresponds to the Gini coefficient of the degree distribution and is a graph level variable like density. It measures the inequality of connectedness among agents and can be interpreted as a proxy for the Asymmetry in the network. The respec-tive manifest variables in these equations are the respecrespec-tive network metrics measured for different window sizes. As mentioned above, The PLS-PM algorithm now seeks to choose the weights for the manifest variables in a way, that thereby (via linear combinations) formed la-tent variables, in consideration of the relationships in the inner and
outer model, maximize the explained variance of both the latent and observed dependent variables.
Degree Pagerank Closeness Katz AssortativityBetweenness Density Asymmetry
0.0 0.1 0.2 0.00 0.25 0.50 0.75 1.00 w eight loading 30180 146030180 1460 30180 1460180 146030 180 1460 30180 1460 30180 146030 180 1460
Window Size (in days)
Figure 11: Block component weights with respect to different window sizes
Figure 11 displays the weights and the loadings obtained for the dif-ferent network metrics and the difdif-ferent window sizes for which they were measured (between 1 day and four years). Please note that not all window sizes are preserved in the final model. For the manifest variables in the respective reflective latent variable equations (all con-tained manifest variables are assumed to reflect different measurements of the same variable) a positive correlation is prescribed. Individual measurements which violated this assumption were removed from the estimation. It is noteworthy that the weighting of window sizes for different network metrics doesn’t behave the same in all cases. For degree, PageRank, closeness, clustering and assortativity longer term positions within the evolving network seem to play a bigger role. As far as density (this variable is the only graph-level metric in the
estima-tion) and betweenness both long and short term positions seem to be more relevant than medium term positions. As far as Katz centrality is concerned measurements of window sizes between half a year and a year seem to be of relatively higher importance.
For the interpretation of the coefficients of the inner model(s) (see Figure 10), it has to be kept in mind, that, while most network met-rics as well as profits can be computed on a daily and individual basis, density, asymmetry, price and bid-ask spread are only available at the aggregate level. The coefficients for the latter two equations thus de-scribe the influence of the distribution of network metrics, reflecting the network positions of agents encountering each other on the market on a certain day, on the respective market price and bid-ask spread. The inner model regressions exhibit a relatively good goodness of fit, with R2 values of 0.6291, 0.5630 and 0.0946 for the price, spread and
profits respectively. This corresponds to a goodness of fit of 0.5723 overall.
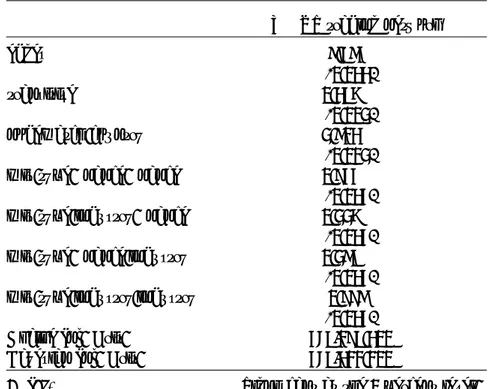
Table 2: Dependent Variable: Price
Estimate Std. Error t value Pr(>|t|) Intercept -0 0.002 -0 1 Degree -0.005 0.004 -1.276 0.202 Pagerank 0.020 0.003 6.733 0 Closeness -0.048 0.002 -27.797 0 Katz 0.006 0.002 3.848 0.000 Assortativity -0.020 0.002 -9.207 0 Betweenness 0.008 0.002 3.218 0.001 Density 0.035 0.002 14.243 0 Asymmetry 0.000 0.002 0.101 0.920 abatement 0.295 0.002 166.990 0 other -0.608 0.002 -337.170 0
Price
As far as the inner model regression for prices is concerned, we observe that all network metric with the exception of degree, close-ness and assortativity exhibit a positive sign. Keeping in mind that the EU ETS is considered a directed network, in which a transaction establishes a link between the seller (source node) and the buyer (tar-get node) we can interpret these results as follows: Elevated average centrality measures, represented by PageRank, Katz and betweenness centrality on a certain trading day imply the presence of dominant agents as far as their network position is concerned exercising elevated pricing power over the more peripheral agents. A similar interpreta-tion is given by Firgo et al. (2015) in the context of the Austrian retail gasoline market network. Asymmetry as far as the connectedness of agents is concerned seems to have no significant effect on the prices.Density can be interpreted as a proxy for overall trading intensity. The positive coefficient of this variable hence implies that in our con-text higher trading intensity drives up prices. The negative coefficients for degree (the sum of in- and out-degree) and closeness centrality (to-tal closeness) on the other hand imply decreasing prices as the options
of agents to close transactions increase. One has to note however, that degree is next the only variable with unsatisfying significance. The positive coefficient for the abatement block just implies a positive re-lationship between marginal abatement costs and prices for emission certificates. This is in line with theoretical considerations.
Table 3: Dependent Variable: Spread
Estimate Std. Error t value Pr(>|t|)
Intercept 0 0.002 0 1 Degree 0.025 0.004 6.372 0 Pagerank -0.030 0.003 -9.096 0 Closeness 0.032 0.002 16.811 0 Katz -0.004 0.002 -2.481 0.013 Assortativity 0.001 0.002 0.280 0.780 Betweenness -0.013 0.003 -4.859 0.000 Density -0.016 0.003 -6.094 0 Asymmetry 0.022 0.002 12.253 0 abatement -0.294 0.002 -153.756 0 other -0.843 0.002 -430.812 0
Bid-Ask Spread
The bid-ask spread is, as mentioned before, often interpreted as a measure for informational asymmetry or trading fric-tions in the market: the difference between the buyer and seller price is assumed to reflect diverging degrees of informedness about the true market price (see Medina et al., 2014, in this respect). It is thus not surprising that the presence of central and thus well informed agents decreases the bid-ask spread, as it is implied by negative coefficients for PageRank, Katz and betweenness centrality. Density in the context can also be interpreted as a proxy for information: the denser (more complete) a network is, the more agents have traded in the market in the past (within the window size) and the better their information is, over which they dispose when concluding a transaction. The negative coefficient for this variable is in line with this interpretation. Not sur-prisingly we observe that asymmetry in the degree distribution is also reflected in the bid-ask spread, which as noted earlier is considered to be informative about the informational asymmetry in the network. The respective coefficient is positive and highly significant. For degree (sum of in- and out-degree), closeness (here total closeness) and as-sortativity the coefficients are positive and thus inverted compared to the price equation. As argued above, degree and closeness can be seen as proxy for the options based on past transactions agents have when trying to complete a transaction implying at the same time a higher potential for disagreement as far as the price is concerned. Assortativ-ity describes the tendency of agents to connect with other agents which are similar to them. This means that these agents are less informed as they only dispose of a limited view on the market, potentially leading to a greater gap between bid and ask prices. It has to be noted how-ever that assortativity is the sole variable in the regression which is not significant at a satisfying level. The interpretation of the negativeabatement coefficient is a bit more involved. Following the principle idea of emission trading OHAs with higher abatement costs are sup-posed or more likely to rather acquire their missing EUAs necessary to comply to the emission reduction targets on the market, than to make the costly investments necessary to bring down emissions by means of technologically upgrading their installations. This might lead to an in-creased pressure of accepting asked prices overall reducing the bid-ask spread.
Profits
The coefficients for the profit equation, as noted above, have to be interpreted in a different manner as they refer to a dependent variable which, in contrast to prices and the bid-ask spread, is available on an individual level. Not surprisingly several variables describing the centrality of agents exhibit positive slopes and are highly significant. This is in line with the findings in the static network of Section 4. The only exception again are degree and density. The interpretation for the latter is straight forward as higher trading intensity implies higher competition and thus lower profit margins. The explanation for the negative coefficient of the variable degree is however not so clear. Profits as pointed out previously are computed in a cumulative manner. A higher number of transactions in the past without implying concrete centrality within the network might incur a higher possibility for losses: Many transactions alone are not sufficient to take a central position in the network. It depends on whom an agent is trading with. The positive coefficient for abatement costs is puzzling however. It can in our opinion only be explained by the overall relatively low price of EUAs since the compliance break in 2006 resulting from a massive overallocation of emission certificates which, as discussed in Section ??, is still today considered a problem. Of a lesser surprise is the negative and significant coefficient of the variable asymmetry. Asymmetries in the network are the result of market inefficiencies that impose higher costs on market participants and thus decreases their profits.Table 4: Dependent Variable: Profits
Estimate Std. Error t value Pr(>|t|) Intercept -0 0.002 -0 1 Degree -0.604 0.006 -109.055 0 Pagerank 0.384 0.005 82.033 0 Closeness 0.045 0.003 16.483 0 Katz 0.048 0.003 18.900 0 Assortativity 0.242 0.003 71.425 0 Betweenness 0.179 0.004 48.247 0 Density -0.144 0.004 -37.341 0 Asymmetry -0.030 0.003 -11.835 0 abatement 0.009 0.003 3.171 0.002 other -0.053 0.003 -18.857 0
5.3
Evolution of the Emission Trading network over
time
The PLS-PM estimation gives rise to two important results: First, by the inner model estimations we obtain easily interpretable results indicating the influence of the network metrics and exogenous variables have on the dependent variables. Second, using the weights estimated in the outer model of the PLS-PM estimation allows us to construct so called latent scores. In the PLS-PM they enter the structural equation. Here they are used as some kind of surrogate variables for the network metrics measured with the unknown “correct ” window size. This allow us to gain insights on how the topology of the emission trading network evolves and how the position of different subgroups within this network changes over time.
0 500 1000 1500 2000 0.00 0.25 0.50 0.75 0.00 0.25 0.50 0.75 1.00 0.0 0.2 0.4 0.6 0.00 0.25 0.50 0.75 1.00 0 1 2 0.0 0.2 0.4 0.6 0.00 0.25 0.50 0.75 V olume Degree P ager ank Closeness Katz Assor tativity Betw eenness Asymmetr y 2005 2006 2007 2008 2009 2010 2011 Date Type finance industry ets PLS−PM Scores 0.0 0.2 0.4 0.6 0.0 0.2 0.4 0.0 0.1 0.2 0.3 0.4 0.5 0.0 0.1 0.2 0.3 0.0 0.1 0.2 0.3 0.4 0.0 0.2 0.4 0.6 0.1 0.2 0.3 V olume Degree P ager ank Closeness Katz Assor tativity Betw eenness Type finance industry ets
The conclusions drawn from the different network metrics displayed in Figure 12 are ambiguous. In general one can state that market ef-ficiency has improved over time. As the share of spot market trading rose, it became easier for agents to aggregate information and to par-ticipate in the European emission market. This interpretation is indi-cated by decreasing average centrality scores (Degree, PageRank and Katz) together with decreasing Gini coefficients for the same variables. In short, a higher market participation rate brought down the average connectivity of agents. This effect is the most articulated in trade pe-riod four. There the trading intensity in terms of volume traded was the highest, while the average connectivity in the trading network was at the lowest level.
Looking at the closeness and betweenness centrality scores under-lines this interpretation. The average level of closeness centrality of agents participating in the EU ETS is sharply increasing over time beginning in trade period four. This can be viewed as an indicator for an increasing flexibility of agents in choosing their trading partner and thus for an in overall better efficiency of the emission market. This is despite the Gini index for this metric stays relatively stable over time. The betweenness centrality scores point in a similar direction. This metric measures the importance of nodes as intermediaries. It thus is not surprising that this role can mainly be attributed to agents of type “finance”. Across all six trading periods nodes of this type ex-hibited an in average larger value of betweenness centrality than their counterparts from the “industry”. The overall increase of betweenness centrality over time as well as the higher degree of inequality for this metric for agents of type “industry” in the last three periods can how-ever be attributed to the fact, that this intermediator role was partly taken over by some of the most central agents of this type. An in-creasing share of spot-market trading replacing OTC, which used to be the dominant transaction form in the beginning of the EU ETS, can evidently be seen as an explanation for that. This interpretation is supported by the evolution of agents’ mixing behavior over time. While (dis)assortative mixing appears to have played an important role in the network formation process in the first three periods, this value is close to zero for both types of agents in the remaining three trade periods. As for the the evolution of closeness centrality this can be interpreted as an indicator for a more efficient functioning of the market. While industrial actors in the first years of the ETS had to rely to a higher degree on higher connected intermediaries from the financial industry in order to trade, this necessity gradually fell away with the emergence of spot market trading. The reason why agents of type “finance” exhibit a higher degree of disassortativity in the first three trading periods can be attributed to their role as intermediaries: According to our prior observation that the trading network exhibits a hierarchical structure (see Section 4.2), EUAs are traded from indus-trial actors in the periphery to financial actors in the center and vice versa.
ef-ficiency, a closer look at the differences in scores between the different types of agents reveals that some problematic aspects of the organi-zation of the EU ETS persist. In fact, with the exception of Katz centrality, we observe an increasing gap towards the latter periods in the centrality measures (Degree, PageRank, Closeness, Betweenness) between agents of type “finance” and agents of type “industry”. This implies a persistent asymmetry between industrial and financial actors as far as their network position is concerned. In contrast, the overall inequality in terms of market access between these two types of agents, was thus in fact not decreasing but got more pronounced over time. The asymmetry score itself indicates similar. While the asymmetry in the market had constantly decreased since mid 2007 this metric is on the rise again since the beginning of 2010.
6
Conclusion
This paper has analyzed the European Emission trading system from a network perspective. Empirically, the transaction network is charac-terized by clustering behavior of agents, a fat tailed degree distribution and a pronounced hierarchical structure. A quantitative analysis of the drivers of link formation shows that the emergence of this structure is explained by the fact that, in absence of a centralized market place, agents had to resort to local networks and financial intermediaries to exchange emission certificates: transactions were driven by the need to identify a potential counterpart through geographical proximity or prominence in the network rather than by complementarity in marginal abatement costs.
The hierarchical structure of the network also suggests that central agents might have captured informational rents and hence influence on the price formation process as well as “abnormal” profits. In order to confirm this intuition we have performed an in-depth analysis of the joint evolution of network statistics and of key market characteris-tics (prices, bid-ask spread, profits) using a Partial Least Square-Path Modeling technique. The results of this analysis definitively confirms the impact of central agents on market dynamics. Over time, the over-all efficiency of the market shows some signs of improvement though a strong asymmetry between industrial and financial actors as well as in overall remains.
In our opinion, these results reflect a major flaw in the organization of the European carbon market, namely the lack of a central market place. Through the period under consideration, trading was largely performed through bilateral OTC transactions and industrial actors had to resort to local networks or financial intermediaries. Hence, the lack of an institutional structure of the market imposed unnecessary costs on industrial actors, which often do not possess the resources to collect market-related information. This undermines the key objective of the European Emission Trading System to reduce greenhouse gas emissions at the least possible cost.
spot market trading. However, the major flaws outlined above in prin-ciple still exist. These could be partly solved by the establishment of a central market place on which emission certificates can be traded. This could improve the quality and effectiveness of emission trading in Europe tremendously.
Acknowledgments
The authors acknowledge the support of the EU FP7 FET project SIMPOL.
References
Alberola, E., Chevallier, J., 2009. European carbon prices and bank-ing restrictions: Evidence from phase i (2005-2007). The Energy Journal, 51–79.
Banerjee, A., Chandrasekhar, A. G., Duflo, E., Jackson, M. O., 2013. The diffusion of microfinance. Science 341 (6144), 1236498.
Barrat, A., Barthelemy, M., Pastor-Satorras, R., Vespignani, A., 2004. The architecture of complex weighted networks. In: Proceedings of the National Academy of Sciences of the United States of America. Vol. 101. National Academy of Sciences, pp. pp. 3747–3752. Battiston, S., Gatti, D. D., Gallegati, M., Greenwald, B., Stiglitz,
J. E., 2012a. Liaisons dangereuses: Increasing connectivity, risk sharing, and systemic risk. Journal of Economic Dynamics and Con-trol 36 (8), 1121–1141.
Battiston, S., Puliga, M., Kaushik, R., Tasca, P., Caldarelli, G., 2012b. Debtrank: Too central to fail? financial networks, the fed and sys-temic risk. Scientific reports 2.
Bonacich, P., 1987. Power and centrality: A family of measures. Amer-ican Journal of Sociology, pp. 1170–1182.
Centre, U. R., 2014. JI & CDM projects. [online; 2015-09-29]. URL http://www.cdmpipeline.org/
Charles, A., Darn´e, O., Fouilloux, J., 2013. Market efficiency in the european carbon markets. Energy Policy 60, pp. 785–792.
Chinazzi, M., Fagiolo, G., Reyes, J. A., Schiavo, S., 2013. Post-mortem examination of the international financial network. Journal of Eco-nomic Dynamics and Control 37 (8), 1692–1713.
Convery, F., Ellerman, D., De Perthuis, C., 2008. The european carbon market in action: Lessons from the first trading period. Journal for European Environmental & Planning Law 5 (2), 215–233. Creti, A., Jouvet, P.-A., Mignon, V., 2012. Carbon price drivers: Phase
i versus phase ii equilibrium? Energy Economics 34 (1), 327–334. Duenas, M., Fagiolo, G., 2014. Global trade imbalances: A network
approach. Advances in Complex Systems 17 (03n04), 1450014. Ellerman, A. D., 2010. Pricing carbon: the European Union emissions
trading scheme. Cambridge University Press.
Ellerman, A. D., Decaux, A., 1998. Analysis of post-kyoto co2 emis-sions trading using marginal abatement curves. (working paper).
Ellerman, A. D., Joskow, P. L., 2008. The European Union’s emis-sions trading system in perspective. Pew Center on Global Climate Change Arlington, VA.
European Commission, 2016. EU ETS Handbook. Brussels.
URL http://ec.europa.eu/clima/publications/docs/ets_ handbook_en.pdf
European Council, 1993. 94/69/EC: Council Decision of 15 December 1993 concerning the conclusion of the United Nations Framework Convention on Climate Change .
URL http://eur-lex.europa.eu/legal-content/EN/TXT/?uri= CELEX:31994D0069
European Council, 1998. 2106th Council meeting ENVIRONMENT Luxembourg, 16-17 June 1998.
URL http://europa.eu/rapid/press-release_PRES-98-205_ en.pdf
European Parliament, 2003. Directive 2003/87/EC of the European Parliament and the Council of 13 October 2003 establishing a scheme for greenhouse gas emission allowance trading within the Commu-nity and amending Council Directive 96/61/EC.
URL http://eur-lex.europa.eu/legal-content/EN/TXT/PDF/ ?uri=CELEX:02003L0087-20090625&from=EN
Firgo, M., Pennerstorfer, D., Weiss, C. R., 2015. Centrality and pric-ing in spatially differentiated markets: The case of gasoline. Inter-national Journal of Industrial Organization 40, 81–90.
Freeman, L. C., 1979. Centrality in social networks conceptual clarifi-cation. Social Networks 1 (3), pp. 215–239.
Handcock, M. S., Hunter, D. R., Butts, C. T., Goodreau, S. M., Morris, M., 2003. statnet: Software tools for the Statistical Modeling of Network Data. Seattle, WA.
URL http://statnetproject.org
H¨ardle, W., Kirman, A., 1995. Nonclassical demand: A model-free examination of price-quantity relations in the marseille fish market. Journal of Econometrics 67 (1), 227–257.
Hintermann, B., 2010. Allowance price drivers in the first phase of the EU ETS. Journal of Environmental Economics and Management 59 (1), pp. 43–56.
Iori, G., De Masi, G., Precup, O. V., Gabbi, G., Caldarelli, G., 2008. A network analysis of the italian overnight money market. Journal of Economic Dynamics and Control 32 (1), 259–278.
Jaraite, J., Jong, T., Kaˇzukauskas, A., Zaklan, A., Zeitlberger, A., 2013. Ownership links and enhanced eutl dataset.
Jaraite, J., Kaˇzukauskas, A., et al., 2012. Firm trading behaviour and transaction costs in the european union’s emission trading system: An empirical assessment. Tech. rep., CERE-the Center for Environ-mental and Resource Economics.
Katz, L., 1953. A new status index derived from sociometric analysis. Psychometrika 18 (1), pp. 39–43.
Koch, N., Fuss, S., Grosjean, G., Edenhofer, O., 2014. Causes of the eu ets price drop: Recession, cdm, renewable policies or a bit of everything?—new evidence. Energy Policy 73, 676–685.
Kossinets, G., Watts, D. J., 2006. Empirical analysis of an evolving social network. Science 311 (5757), pp. 88–90.
Laing, T., Sato, M., Grubb, M., Comberti, C., et al., 2013. Assessing the effectiveness of the eu emissions trading system. Grantham Re-search Institute on Climate Change and the Environment Working Paper (106).
Li, D., Sch¨urhoff, N., 2014. Dealer networks.
Martin, R., Muˆuls, M., Wagner, U. J., 2014. Trading behavior in the eu emissions trading scheme. Available at SSRN 2362810.
Maslov, S., Sneppen, K., 2002. Specificity and stability in topology of protein networks. Science 296 (5569), pp. 910–913.
Medina, V., Pardo, ´A., Pascual, R., 2014. The timeline of trading frictions in the european carbon market. Energy Economics 42, 378– 394.
Page, L., Brin, S., Motwani, R., Winograd, T., 1999. The pagerank citation ranking: bringing order to the web.
Palao, F., Pardo, A., 2012. Assessing price clustering in european car-bon markets. Applied Energy 92, pp. 51–56.
Panzarasa, P., Opsahl, T., Carley, K. M., 2009. Patterns and dynamics of users’ behavior and interaction: Network analysis of an online community. Journal of the American Society for Information Science and Technology 60 (5), 911–932.
Puliga, M., Caldarelli, G., Battiston, S., 2014. Credit default swaps networks and systemic risk. Scientific reports 4.
Seidman, S. B., 1983. Network structure and minimum degree. Social networks 5 (3), pp. 269–287.
Stavins, R. N., 1995. Transaction costs and tradeable permits. Journal of environmental economics and management 29 (2), 133–148.
United Nations, 1992. United Nations Framework on Climate Change. [online; 2015-09-29].
URL https://unfccc.int/files/essential_background/ background_publications_htmlpdf/application/pdf/conveng. pdf
United Nations, 1998. Kyoto protocol to the united nations framework convention on climate change.
URL http://unfccc.int/resource/docs/convkp/kpeng.pdf Vignes, A., Etienne, J.-M., 2011. Price formation on the marseille fish
market: evidence from a network analysis. Journal of Economic Be-havior & Organization 80 (1), 50–67.
Wasserman, S., Faust, K., 1994. Social network analysis: Methods and applications. Vol. 8. Cambridge University Press.
Zaklan, A., 2013. Why do emitters trade carbon permits?: Firm-level evidence from the european emission trading scheme. Tech. rep., DIW Berlin, German Institute for Economic Research.
A
EU ETS - the detailed legal and
orga-nizational background
A.1
Historical Backkground and Legal Foundations
The Kyoto Protocol (KP) United Nations (1998) from 1998 extended the United Nations Framework Convention on Climate Change (UNF-FCCC) United Nations (1992) negotiated in 1992 during the UN Con-ference on Environment and Development by defining targets for the reduction of green house gas (GHG) emissions into the atmosphere. These targets follow the principle of “common but differentiated respon-sibilities” as outlined in Article 3 of the KP United Nations (1998). Accommodating the responsibility of industrialized countries for the contemporary levels of GHG emissions, these targets were determined to be binding for the group of developed signatory states referred to as the Annex 1 parties. The protocol was signed and ratified by 191 parties of which one was the European Union13.14
The Annex 1 parties comprise 37 industrialized countries of which 29 are now members of the European Union. The legally binding com-mitment of the signatory countries concerns the most relevant green-house gases and gas groups.15 The targets themselves are however
quantified in CO2 equivalents with regard to global warming
poten-tial and as percentages of the emissions in a base year, which, for the majority of the Annex 1 parties, is 1990. The European Union as a whole committed itself to collectively reduce CO2emissions by 8%
un-til 2012 and 20% unun-til 2020 with respect to base year emissions. Under the premise of “common but shared responsibilities” member state spe-cific reduction goals were defined, which take into account the different levels of economic development within the union, the respective struc-tures of the national economies as well as early measures to reduce GHG emissions.
To keep the costs of limiting CO2 emissions as small as possible
for the signatory countries the KP allows for so called “flexible mecha-nisms” which serve as an alternative to traditional approaches like car-bon taxes or compensating measures as reforestation (Art. 3.3) United Nations (1998). These mechanisms comprise International Emission Trading (IET), Clean Development Mechanisms (CDM) (United Na-tions, 1998, Art. 12) and Joint Implementation (JI) (United NaNa-tions, 1998, Art. 6) and shall be described in detail in the following subsec-tion.
Since Japan rejected all attempts to give the UN the legal instru-ments to enforce the emission reduction commitinstru-ments in the KP and the United States withdrew from the protocol in 2001 it became soon clear that the EU had to find an internal solution if it wanted to stick
13Council Decision of 15 December 1993 European Council (1993) 14
Noteworthy exceptions are the United States which signed but never ratified the KP and finally withdrew in 2001 and Canada which quit the treaty in 2011.
15
Carbon dioxide, methane, nitrous oxide, sulphur hexafluoride, hydrofluorocarbons and perfluorocarbons
to the GHG reduction targets to which it committed itself in the KP Ellerman (2010). After an understanding was found between mem-ber states to differentiate the GHG reduction targets with regard to the level of economic development in the form of the “burden shar-ing agreement ” (BSA) European Council (1998), the initial resistance with regard to the implementation of a European emission trading scheme (ETS) began to crumble. The European Union emission trad-ing scheme was finally legally implemented by directive 2003/87/EC European Parliament (2003)16and subsequently adopted into national laws.
A.2
The Functioning of the European Emission
trad-ing System
Emission Trading
The concept of IET plays the central role of flexible emission reduction instruments and is the cornerstone of Euro-pean climate policy. The system bases on a “cap-and-trade” principle in which permitted emission units, so called allowance units are allo-cated to emitters of green house gases. One emission allowance unit typically corresponds to one metric ton of CO2-equivalent. Theseas-signed allowance units (AAU or EAU European Allowance Unit in the context of the EU ETS) normally depend on historical yearly green house gas emission data and are capped with regard to committed national or supranational emission reduction targets. The allocated allowance units then correspond to the amount of emissions an op-erator is allowed to produce within the upcoming year. Allowance units thereby become a scarce good, which participants can exchange in a market context. Periodically market participants which are legally committed to reduce their emissions have to surrender the amount of allowance units in their possession. These are subsequently compared with the realized emissions which are permanently recorded at the re-spective installations to check if the emission reduction targets were met. If the available allowance units fall short of the realized emis-sions, the obliged market participants have to pay a fine proportional to the allowance units by which the emission reduction obligations were missed. Emitters therefore face a choice between reducing their emissions by targeted investments or by acquiring additional emission certificates on the market to meet legal obligations. The system ideally is supposed to exploit differing marginal abatement costs (MAC), i.e. the marginal cost of reducing green house gas emissions by one unit, between countries, firms, industries or even between different branches within a company Ellerman and Decaux (1998). Emitters from high technology sectors with relatively low levels of emission could thereby profit from the comparatively low abatements costs of other companies from emission intensive industries and vice versa. Installations can be factories, power plants or even aircrafts.
16The directive was later amended by Directive 2004/101/EC, Directive 2008/101/EC, Regulation (EC) No 219/2009 and Directive 2009/29/EC
Clean Development Mechanism & Joint Implementation
The system of emission trading is complimented by the CDM and the JI mechanism. In contrast to emission trading these mechanisms are project based. Predicated on the assumption that actions which lead to the reduction of GHG eventually have positive effects in slowing down global warming no matter where on the planet they are conducted, An-nex 1 countries can engage in GHG emission reducing projects abroad in order to earn emission reduction units (ERU) which in turn can be traded on the emission market or used when surrendering one’s al-lowances at the end of a compliance period. While the JI mechanism is supposed to foster cooperation between Annex 1 countries17to meet their GHG reduction targets, the CDM aims to stimulate GHG reduc-ing investments and projects in non-Annex 1 countries (mainly devel-oping countries) to promote sustainable development (United Nations, 1998, Art. 12) and to help Annex 1 countries to meet their emission reduction commitments with the lowest possible costs.
The implementation of IET in the European context
The ETS covers factories, power stations, and other installations with a net heat excess of 20 MW in emission intensive industries responsi-ble for roughly 50% of the GHG emissions in the concerned 31 coun-tries (EU plus Switzerland, Norway and Liechtenstein). With directive 2008/101/EC the aviation industry was also included into the ETS. The emission allowance units (EUA) are allocated to each of the ap-proximately 11,000 installations in February each year on a national level in line with the respective BSA and KP reduction targets and have to be surrendered by the operator holding accounts (OHA) at latest end of April in the subsequent year. The fine for each EUA after surrendering that falls short of the verified emissions amounts to EUR 100. Operators are allowed to bank and respectively borrow allowances within a trading period. It was however not permitted to carry allowances from Pilot Phase I (2005 - 2007) to Phase II (2008-20012), and from there to Phase III (2013 - 2020) Ellerman and Joskow (2008). The ETS is not only open to OHAs, but also private entities which don’t fall under the ETS regulation are allowed against a fee to trade on the emission market. These entities are referred to as pri-vate holding accounts (PHA). EUAs can be traded bilaterally, over the counter (OTC) via a broker or on one of Europe’s climate exchange markets like the European Climate Exchange (ECX), the European Energy Exchange AG (EEX) etc. For the time for which the transac-tion data set is available the most common form of transactransac-tions was OTC.
17
The majority of currently ongoing Joint Implementation projects are situated in tran-sition economies with Annex 1 obligations like the Russian Federation and Ukraine Centre (2014)