The MIT Faculty has made this article openly available.
Please share
how this access benefits you. Your story matters.
Citation
Azoulay, Pierre et al. "Does Science Advance One Funeral at a
Time?" American Economic Review 109, 8 (August 2019): 2889-2920
As Published
http://dx.doi.org/10.1257/aer.20161574
Publisher
American Economic Association
Version
Final published version
Citable link
https://hdl.handle.net/1721.1/129943
Terms of Use
Article is made available in accordance with the publisher's
policy and may be subject to US copyright law. Please refer to the
publisher's site for terms of use.
2889
Does Science Advance One Funeral at a Time?
†By Pierre Azoulay, Christian Fons-Rosen, and Joshua S. Graff Zivin* We examine how the premature death of eminent life scientists alters the vitality of their fields. While the flow of articles by collaborators into affected fields decreases after the death of a star scientist, the flow of articles by non-collaborators increases markedly. This surge in contributions from outsiders draws upon a different scientific cor-pus and is disproportionately likely to be highly cited. While outsid-ers appear reluctant to challenge leadoutsid-ership within a field when the star is alive, the loss of a luminary provides an opportunity for fields to evolve in new directions that advance the frontier of knowledge. (JEL I23, O31, O33)
A new scientific truth does not triumph by convincing its opponents and making them see the light, but rather because its opponents eventually die,
and a new generation grows up that is familiar with it.
—Max Planck
Whether manna from heaven or the result of the purposeful application of research and development, technological advances play a foundational role in all modern theories of economic growth (Solow 1957, Romer 1990, Aghion and Howitt 1992). Only in the latter part of the nineteenth century, however, did tech-nological progress start to systematically build upon scientific foundations (Mokyr 1992, 2002). Economists, in contrast to philosophers, historians, and sociologists (Kuhn 1962, Shapin 1996, Merton 1973), have devoted surprisingly little effort to understanding the processes and institutions that shape the evolution of science.1
1 A notable exception is the theoretical model of scientific revolutions developed by Bramoullé and Saint-Paul (2010).
* Azoulay: MIT Sloan School of Management, 100 Main Street, E62-487, Cambridge, MA 02142, and NBER (email: [email protected]); Fons-Rosen: Department of Economics, UC Merced, 5200 N. Lake Road, Merced, CA 95343, and CEPR (email: [email protected]); Graff Zivin: School of Global Policy and Strategy, UCSD, D9500 Gilman Drive, La Jolla, CA 92093, and NBER (email: [email protected]). Marianne Bertrand was the coeditor for this article. Azoulay and Graff Zivin acknowledge the financial support of the National Science Foundation through its SciSIP Program (Award SBE-1460344) and the National Institute of Aging (grant P01AG039347). Fons-Rosen acknowledges financial support from the Spanish Ministry of Economy and Competitiveness through a grant (ECO-2014-55555-P) and through the Severo Ochoa Programme for Centres of Excellence in R&D (SEV-2015-0563). The project would not have been possible without Andrew Stellman’s extraordinary programming skills (www.stellman-greene.com). Mikka Rokkanen provided additional research assistance. We thank Heidi Williams, Xavier Jaravel, Danielle Li, Sameer Srivastava, Scott Stern, Bruce Weinberg, and seminar audiences at the NBER, UC Berkeley, National University of Singapore, and Stanford University for useful discussions. The authors declare that they have no relevant or material financial interests that relate to the research described in this paper. The usual disclaimer applies.
† Go to https://doi.org/10.1257/aer.20161574 to visit the article page for additional materials and author disclosure statements.
How do researchers identify problems worthy of study and choose among potential approaches to investigate them?
Presumably these choices are driven by a quest for recognition and scientific glory, but the view that scientific advances are the result of a pure competition of ideas, one where the highest quality insights inevitably emerge as victorious, has long been considered a Panglossian but useful foil (Kuhn 1962, Akerlof and Michaillat 2017). Indeed, the provocative quote from Max Planck in the epigraph of this paper underscores that even the most celebrated scientist of his era understood that the pragmatic success of a scientific theory does not entirely determine how quickly it gains adherents, or its longevity.
Can the idiosyncratic stances of individual scientists do much to alter, or at least delay, the course of scientific advance? Perhaps for the sort of scientific revolutions that Planck, the pioneer of quantum mechanics, likely had in mind, but the proposi-tion that established scientists are slower than novices in accepting paradigm-shifting ideas has received little empirical support whenever it has been put to the test (Hull, Tessner, and Diamond 1978; Gorham 1991; Levin, Stephan, and Walker 1995). Paradigm shifts are rare, however, and their very nature suggests that once they emerge, it is exceedingly costly to resist or ignore them. In contrast, “normal” scien-tific advance, the regular work of scientists theorizing, observing, and experiment-ing within a settled paradigm or explanatory framework, may be more susceptible to political jousting. The absence of new self-evident and far-reaching truths means that scientists must compete in a crowded intellectual landscape, sometimes sav-agely, for the supremacy of their ideas (Bourdieu 1975).
In this paper, we use a difference-in-differences setup to test “Planck’s Principle” in the context of academic biomedical research, an enormous domain which has been the province of normal scientific change ever since the “central dogma” of molecular biology (Crick 1970) emerged as a unifying description of the informa-tion flow in biological systems. Specifically, we examine how the premature death of 452 eminent scientists alter the vitality (measured by publication rates and fund-ing flows) of subfields in which they actively published in the years immediately preceding their passing, compared to matched control subfields. In contrast with prior work that focused on collaborators (Azoulay, Graff Zivin, and Wang 2010; Oettl 2012; Jaravel, Petkova, and Bell 2018; Mohnen 2018), our work leverages new tools to define scientific subfields which allows us to expand our focus to the response by scientists who may have similar intellectual interests with the deceased stars without ever collaborating with them.
To our surprise, it is not competitors from within a subfield who assume the mantle of leadership, but rather entrants from other fields who step in to fill the void created by a star’s absence. Importantly, this surge in contributions from outsiders draws upon a different scientific corpus and is disproportionately likely to be highly cited. Thus, consistent with the contention by Planck, the loss of a luminary pro-vides an opportunity for fields to evolve in novel directions that advance the scien-tific frontier. The rest of the manuscript is dedicated to elucidating the mechanisms responsible for this phenomenon.
It does not appear to be the case that stars use their influence over financial or editorial resources to block entry into their fields, but rather that the very prospect of challenging a luminary in the field serves as a deterrent for entry by outsiders.
Indeed, most of the entry we see occurs in those fields that lost a star who was espe-cially accomplished. Even in those fields that have lost a particularly bright star, entry can still be regulated by key collaborators left behind. We find suggestive evi-dence that this is true in fields that have coalesced around a narrow set of techniques or ideas or where collaboration networks are particularly tight-knit. We also find that entry is more anemic when key collaborators of the star are in positions that allow them to limit access to funding or publication outlets to those outside the club that once nucleated around the star.
To our knowledge, this manuscript is the first to examine the dynamics of scien-tific evolution using the standard empirical tools of applied microeconomics.2 We
conceptualize the death of eminent scientists as shocks to the structure of the intel-lectual neighborhoods in which they worked several years prior to their death, and implement a procedure to delineate the boundaries of these neighborhoods in a way that is scalable, transparent, and does not rely on ad hoc human judgment. The con-struction of our dataset relies heavily on the PubMed Related Citations Algorithm (PMRA), which groups scientific articles into subfields based on their intellectual content using abstract words, title words, and very detailed keywords drawn from a controlled vocabulary thesaurus curated by the National Library of Medicine. As such, we are able to delineate circumscribed areas of scientific inquiry whose bound-aries are not defined by shared training, collaboration, or citation relationships.
In addition to providing evidence regarding a central question for scholars study-ing the scientific process, our paper is among the very few economic studies that attend to the ways in which scientists position themselves in intellectual space (cf. Borjas and Doran 2015a, b and Myers 2018 for other notable examples). As such, our work can be understood as integrating the traditional concerns of economists, understanding how incentives and institutions influence the rate of knowledge pro-duction or diffusion, with those of cognate disciplines such as sociology and philos-ophy, who have traditionally taken the direction of scientific change as the central problem to be explained.
The rest of the paper proceeds as follows. In the next section, we examine the institutional context and lay out our broad empirical strategy. In Section II, we then turn to data, methods, and descriptive statistics. We report the results in Section III. Section IV concludes by outlining the implications of our findings for future work.
I. Institutional Context and Empirical Design
Our empirical analyses are centered on the academic life sciences. The merits of this focus are several-fold. First, the field has been an important source of scientific discovery over the past half-century. Many modern medical therapies can trace their origins to research conducted in academic laboratories (Sampat and Lichtenberg
2 Considerable work outside of economics has examined the evolution of scientific fields through network and community detection techniques (e.g., Rosvall and Bergstrom 2008; Börner, Chen, and Boyack 2003; cf. Fortunato and Hric 2016 for a review of this fast-evolving research area). These approaches rely on collaboration or citation links to define the vertices of the knowledge network used to partition a scientific space into subfields. While social scientists have utilized these techniques to explain a wide range of phenomena (e.g., Foster, Rzhetsky, and Evans 2015), these approaches are less well suited to our setting where citation and collaboration are among the primary outcomes of interest.
2011; Li, Azoulay, and Sampat 2017). These discoveries, in turn, have generated enormous health and welfare gains for economies around the world.
Second, the life science research workforce is large and specialized. The Faculty Roster of the Association of American Medical Colleges lists more than 200,000 faculty members employed in US medical schools and academic medical centers in 2015.3 Moreover, scientific discoveries over the past half-century have greatly
expanded the knowledge frontier, necessitating increasing specialization by research-ers and a greater role for collaboration (Jones 2009). If knowledge and techniques remain at least partially tacit long after their initial discovery, tightly-knit research teams may be able to effectively control entry into intellectual domains. The size and maturity of this sector, including its extensive variety of narrowly defined subfields, makes it an ideal candidate for an inquiry into the determinants of the direction of scientific effort in general, and how it is influenced by elite scientists in particular.
Third, the academic research setting also offers the practical benefits of an exten-sive paper trail of research inputs, outputs, and collaboration histories. On the input side, reliance of researchers on one agency for the majority of their funding raises the possibility that financial gatekeeping by elite scientists could be used to regulate entry into scientific fields. Data on NIH funding at the individual level, as well as membership in “study sections” (the peer-review panels that evaluate the scientific merits of grant applications) will allow us to examine such concerns directly. Most importantly for our study, the principal output of researchers (publications) are all tagged by a controlled vocabulary of keywords managed by the National Library of Medicine. This provides the raw material that helps delineate scientific subfields without appealing to citation linkages or collaborative relationships (the specifics of this process are described in detail in Section IIB and online Appendix C).
These many virtues, however, may come at the expense of generalizability. While the life sciences span a wide range of research styles, from small-team data-driven epidemiology, to medium-size laboratories under the helm of a single principal investigator, to large-scale multi-institution clinical trials, most biomedical research-ers cluster topically and socially in small, quasi-independent subfields. This broad domain seldom features exceedingly small research teams (as in pure mathematics) or “big science” efforts where capital needs are so extensive and specialized as to fully consolidate the field into a single or a handful of large authorship teams (as in high-energy particle physics, e.g., Aad et al. 2015). As such, one should refrain from applying our findings to other fields of science where the structure of collaborative efforts and the degree of intellectual clustering are likely to generate different pat-terns of succession, compared to those observed in the life sciences.
Accounts by practicing scientists indicate that collaboration plays a large role in both the creation and diffusion of new ideas (Reese 2004), and historians of science have long debated the role of controversies and competition in shaping the direc-tion of scientific progress and the process through which new subfields within the same broad scientific paradigm are born and grow over time (Hull 1988, Morange 1998, Shwed and Bearman 2010). Our study presents a unique opportunity to test
3 This figure excludes life science academics employed in graduate schools of arts and science or other non-medical school settings such as MIT, Rockefeller University, The Salk Institute, UC Berkeley, the intramural campuses of NIH, etc.
some of their insights in a way that is more systematic and can yield generalizable insights on the dynamics of field evolution.
II. Empirical Design, Data, and Descriptive Statistics
Below, we provide a detailed description of the process through which the matched scientist/subfield dataset used in the econometric analysis was assembled. We begin by describing the criteria used to select our sample of superstar academics, with a particular focus on “extinction events,” the set of subfields in which these sci-entists were active prior to their death and the procedure followed to delineate their boundaries. Finally, we discuss the matching procedure implemented to identify control subfields associated with eminent scientists who did not pass away but are otherwise similar to our treatment group.
A. Superstar Sample
Our basic approach is to rely on the death of “superstar” scientists as a lever to estimate the extent to which the production of knowledge in the fields in which they were active changes after their passing. The study’s focus on the scientific elite can be justified both on substantive and pragmatic grounds. The distribution of publica-tions, funding, and citations at the individual level is extremely skewed (Lotka 1926, de Solla Price 1963) and only a tiny minority of scientists contribute, through their published research, to the advancement of science (Cole and Cole 1972). Stars also leave behind a corpus of work and colleagues with a stake in the preservation of their legacy, making it possible to trace back their careers, from humble beginnings to wide recognition and acclaim.
The elite academic life scientist sample includes 12,935 individuals, which corre-sponds to roughly 5 percent of the entire relevant labor market. In our framework, a scientist is deemed elite if they satisfy at least one of the following criteria for cumu-lative scientific achievement: (i) highly funded scientists; (ii) highly cited scientists; (iii) top patenters; and (iv) members of the National Academy of Sciences or of (v) the National Academy of Medicine. Since these criteria are based on extraordinary achievement over an entire scientific career, we augment this sample using additional criteria to capture individuals who show great promise at the early and middle stages of their scientific careers ( so-called “shooting stars”). These include (vi) NIH MERIT awardees; (vii) Howard Hughes Medical Investigators; and (viii) early career prize winners. Online Appendix A provides additional details regarding these metrics of “superstardom” and explores the sensitivity of our core set of results to the type of scientists (“cumulative stars” versus “shooting stars”) included in the sample.
For each scientist, we reconstruct their career from the time they obtained their first position as independent investigators (typically after a postdoctoral fellowship) until 2006. Our dataset includes employment history, degree held, date of degree, gender, and department affiliations as well as complete list of publications, patents, and NIH funding obtained in each year by each scientist.4
4 Online Appendix B details the steps taken to ensure that the list of publications is complete and accurate, even in the case of stars with frequent last names. Though we apply the term of “star” or “superstar” to the entire group,
The 452 scientists who pass away prematurely, and who are the particular focus of this paper, constitute a subset of this larger pool of 12,935. To be included in our sample, their deaths must intervene between 1975 and 2003 (this allows us to observe at least three years’ worth of scientific output for every subfield after the death of a superstar scientist). Although we do not impose any age cutoff, the median and mean age at death is 61 with 85 percent of these scientists having passed away before the age of 70 (we explore the sensitivity of our results to the age at death in online Appendix E). We also require evidence, in the form of published articles and/or NIH grants, that these scholars were still in a scientifically active phase of their career in the period just preceding their death (this is the narrow sense in which we deem their deaths to have occurred prematurely).
Within this sample, 229 (51 percent) of these scientists pass away after a pro-tracted illness, whereas 185 (41 percent) die suddenly and unexpectedly. We were unable to ascertain the particular circumstances of 37 (8.20 percent) death events.5
Table 1 provides descriptive statistics for the deceased superstar sample. The median star received her degree in 1957 and died at the age of 61. Forty percent of the stars hold an MD degree (as opposed to a PhD or MD/PhD), and 90 percent of them are male. On the output side, the stars each received an average of roughly $16.6 mil-lion in NIH grants, and published 138 papers that garnered 8,341 citations over the course of their careers (as of 2015).
B. Delineating Research Fields
The source of the publication data is PubMed, an online resource from the National Library of Medicine that provides fast, free, and reliable access to the bio-medical research literature. PubMed indexes more than 40,000 journals within the life sciences.
To delineate the boundaries of the research fields in which each deceased star was active, we develop an approach based on topic similarity between each article where the star appeared as a last author in a window of five years prior to her death, and the rest of the scientific literature.6 Specifically, we use the PubMed Related Citations
Algorithm (Lin and Wilbur 2007) which relies heavily on Medical Subject Headings (MeSH), but not in any way on citation or collaboration linkages.
MeSH terms constitute a controlled vocabulary maintained by the National Library of Medicine that provides a very fine-grained partition of the intellectual space spanned by the biomedical research literature. Importantly for our purposes, MeSH keywords are assigned to each publication by professional indexers who focus solely on their scientific content. That said, the PubMed Related Citations Algorithm—hereafter, PMRA—also uses title and abstract words as inputs, which
there is substantial heterogeneity in intellectual stature within the sample (see Table 1).
5 Online Appendix Table A3 provides the full list of deceased superstars, together with their year of birth and death, cause of death, institutional affiliation at the time of their passing, and a short description of their research expertise.
6 A robust social norm in the life sciences systematically assigns last authorship to the principal investigator, first authorship to the junior author who was responsible for the conduct of the investigation, and apportions the remain-ing credit to authors in the middle of the authorship list, generally as a decreasremain-ing function of the distance from the extremities (Zuckerman 1968, Nagaoka and Owan 2014). Only in the case of last authorship can we unambiguously associate the star with a subfield.
are selected by the authors, and may reflect their aspirations. While this raises the possibility that our subfield definitions are not impervious to social influences, it does offer one advantage, namely that our subfield boundaries can quickly reflect the emergence of new terms whose inclusion in the official MeSH thesaurus will occur with some lag.7 Regardless, as will become clear in the next section, our
difference-in-differences design alleviates the concern that idiosyncratic features of PMRA might affect our conclusions, since these would influence treatment and con-trol subfields in a symmetric fashion.
We then use the “Related Articles” function in PubMed to harvest journal articles that are intellectually proximate to the star scientists’ own papers in the last five years of her life.8 Online Appendix C describes the algorithm in more detail and
per-forms extensive robustness checks. In particular, we verify that the cutoff rules used by PMRA to generate a set of intellectual neighbors for a given source article do not induce treated subfields to exhibit idiosyncratic truncation patterns, from above or from below, compared to control subfields. Using a tunable version of PMRA, we also assess the robustness of our core results to manipulations of these cutoff rules. Reassuringly, our results are qualitatively similar regardless of the rule employed.
To fix ideas, consider “The Transcriptional Program of Sporulation in Budding Yeast” (PubMed ID 9784122), an article published in the journal Science in 1998 originating from the laboratory of Ira Herskowitz, an eminent UCSF biologist who died in 2003 from pancreatic cancer. As can be seen in online Appendix Figure C4, PMRA returns 72 original related journal articles for this source publication. Some of these intellectual neighbors will have appeared before the source to which they are
7 Importantly, defining subfields as isomorphic to the set of articles related (in a PMRA-sense) to a source article does not imply a fixed number of articles per subfield. On the contrary, PMRA-generated subfields can be of arbi-trary large size. In online Appendix C, we document the variation in subfield size and explore the sensitivity of our results to alternate subfield definitions, including those that exclude potentially endogenous intellectual linkages.
8 To facilitate the harvesting of PubMed-related records on a large scale, we have developed an open-source software tool that queries PubMed and PMRA and stores the retrieved data in a MySQL database. The software is available for download at http://www. stellman-greene.com/FindRelated/. Prior research leveraging the intellectual linkages between articles generated by PMRA include Azoulay et al. (2015, 2019), and Myers (2018).
Table 1—Summary Statistics: Deceased Superstar Scientists
Mean Median SD Min. Max.
Year of birth 1930.157 1930 11.011 1899 1959 Degree year 1957.633 1957 11.426 1928 1986 Year of death 1991.128 1992 8.055 1975 2003 Age at death 60.971 61 9.778 34 91 Female 0.102 0 0.303 0 1 MD degree 0.403 0 0.491 0 1 PhD degree 0.489 0 0.500 0 1 MD/PhD degree 0.108 0 0.311 0 1 Sudden death 0.409 0 0.492 0 1 Number of subfields 6.805 4 7.308 1 57
Career number of pubs. 138.221 112 115.704 12 1,380
Career number of citations 8,341 5,907 8,562 120 72,122
Career NIH funding $16,637,919 $10,899,139 $25,441,933 0 $329,968,960
Sits on NIH study section 0.007 0 0.081 0 1
Career number of editorials 0.131 0 0.996 0 17
Notes: Sample consists of 452 superstar life scientists who died while still actively engaged in research. See online Appendix A for more details on sample construction.
related, whereas others will have only been published after the source. Some will rep-resent the work of collaborators, past or prep-resent, of Herskowitz’s, whereas others will represent the work of scientists he may never have come in contact with during his life, much less collaborated with. The salient point is that nothing in the process through which these related articles are identified biases us toward (or away from) articles by collaborators, frequent citers of Herskowitz’s work, or co-located researchers.
Consider now the second most-related article to Herskowitz’s Science paper listed in online Appendix Figure C4, “Phosphorylation and Maximal Activity of Saccharomyces cerevisiae Meiosis-Specific Transcription Factor Ndt80 Is Dependent on Ime2.” Online Appendix Figure C5 displays the MeSH terms that tag this article along with its source. As a byproduct, PMRA also provides a car-dinal dyadic measure of intellectual proximity between each related article and its associated source article. In this particular instance, the relatedness score of “Phosphorylation …” is 94 percent, whereas the relatedness score for the most dis-tant related article in Figure C4, “Catalytic roles of yeast …,” is only 62 percent.
In the five years prior to his death (1998–2002), Herskowitz was the last author on 12 publications, the publications most closely associated with his position as head of a laboratory. For each of these source publications, we treat the set of publications returned by PMRA as constituting a distinct subfield, and we create a subfield panel dataset by counting the number of related articles in each of these subfields in each year between 1975 and 2006. An important implication of this data construction procedure is that the subfields we delineate are quite limited in scope. One window into the degree of intellectual breadth for subfields is to gauge the overlap between the articles that constitute any pair of subfields associated with the same star. In the sample, the 452 deceased stars account for 3,076 subfields, and 21,661 pairwise combination of subfields (we are only considering pairs of subfields associated with the same individual star). Online Appendix Figure C6 displays the histogram for the distribution of overlap, which is extremely skewed. A full half of these pairs exhibit exactly zero overlap, whereas the mean of the distribution is 0.06 . To find pairs of subfields that display substantial amounts of overlap (for example, one-half of the articles in subfield 1 also belong in subfield 2), one must reach far into the right tail of the distribution, specifically, above the ninety-eighth percentile.
As such, the subfields we delineate are relatively self-contained. Performing the analysis at the level of the subfield, rather than lumping together all the subfields of an individual star, will provide us with an opportunity to exploit variation in the extent of participation of the star within each of her subfields. We will also check the validity of the main results when rolling the data up from the subfield level to the star level in online Appendix F. Finally, since even modest amounts of overlap entail that the observations corresponding to the subfields of individual stars will not be independent in a statistical sense, we will cluster standard errors at the level of the star scientist.9
9 The compactness of these subfields likely reflect the technology of research within the life sciences, a similar exercise performed in a different domain of science, particularly those characterized by large collaborative projects, might well result in subfields with substantially more overlap.
C. Identification Strategy
Given our interests in the effect of superstar death on entry into scientific sub-fields, our empirical strategy is focused on changes in published research output after the superstar passes away, relative to when she was still alive. To ensure that we are estimating the effect of interest and not some other influence that is cor-related with the passage of time, our specifications include age and period effects, as is the norm in studies of scientific productivity (Levin and Stephan 1991). These temporal controls are tantamount to using subfields that lost a superstar in earlier or later periods as an implicit control group when estimating entry into subfields that currently experienced the death of a superstar. If the death of a superstar only represented a one-time shift in the level of entry into the relevant subfields, this would not be problematic. But if these unfortunate events affect trends, and not simply levels, of scientific activity, this approach may not suffice to filter out the effect of time-varying omitted variables, even when flexible age and calendar time controls are included in the econometric specification. One tangible concern about time-varying effects relates to the life cycle of subfields, where productive potential may initially increase over time before peaking and then slowly declining.
To mitigate this threat to identification, our preferred empirical strategy relies on the selection of a matched scientist/subfield for each treated scientist/subfield. These control observations are culled from the universe of subfields in which super-stars who do not die are active (see Section IIA and online Appendix D). Combining the treated and control samples enables us to estimate the effect of superstar death in a difference-in-differences framework. Online Appendix Figure D1 illustrates the procedure used to identify control subfields in the particular case of the Herskowitz publication highlighted above.
We begin by looking at all the articles that appeared in the same journal and in the same year as the treated source articles. From this set of articles, we keep only those that have one of the still-living superstars in the last authorship position. Then, using a “coarsened exact matching” procedure detailed in online Appendix D, the control source articles are selected such that (i) the number of authors in the treated and control are approximately similar; (ii) the age of the treated and control superstars differ by no more than five years; and (iii) the number of citations received by the treated and source article are similar. For the Herskowitz/“sporulation in budding yeast” pair, we can select ten control articles in this way. All of these controls were also published in Science in 1998, and have between five and seven authors. One of these controls is “Hepatitis C Viral Dynamics in Vivo … ,” whose last author is Alan Perelson, a biophysicist at Los Alamos National Lab. Perelson and Herskowitz obtained their PhD only a year apart. The two papers had received 514 and 344 citations respectively by the end of 2003. Though this is a large difference, this places both well above the ninety-ninth percentile of the citation distribution for five-year-old articles published in 1998.
One potential concern with the addition of this “explicit” control group is that control subfields could be affected by the treatment of interest. What if, for instance, a control source article happens to be related (in a PMRA sense) with the treated source? Because the subfields identified by PMRA are narrow, this turns out to be very infrequent. Nonetheless, we remove all such instances from the data. We then
find all the intellectual neighbors for these control source articles using PMRA; a control subfield is defined by the set of related articles returned by PMRA, in a man-ner that is exactly symmetric to the procedure used to delineate treated subfields. When these related articles are parsed below to distinguish between those published by collaborators and non-collaborators of the star, or between those by intellectual outsiders and insiders, covariates for treated and control observations will always be defined with perfect symmetry.
D. Descriptive Statistics
The procedure described above yields a total of 34,218 distinct subfields; 3,076 subfields correspond to one of the 452 dead scientists, whereas 31,142 subfields cor-respond to one of 5,809 still-living scientists. Table 2 provides descriptive statistics for control and treated subfields in the baseline year, i.e., the year of death for the deceased scientist.10
Covariate Balance.—In the list of variables displayed in Table 2, a number of covariates are balanced between treated and control subfields solely by virtue of the coarsened exact matching procedure: for instance, (star) investigator year of degree, the source article number of authors, or the source article number of citations at baseline. However, there is nothing mechanical to explain the balance between treated and control subsamples with respect to the stock of our main outcome vari-able: the number of articles in the star’s field. Figure 1 compares the distributions of the cumulative number of articles published in our sample of subfields up to the year of death, broken down by treatment status. Overall, one can observe a great deal of overlap between the two histograms; the means and medians are virtually identical. Of course, balance in the levels of the outcome variable is not technically required for the validity of the empirical exercise.11 Yet, given the ad hoc nature of
the procedure used to identify control subfields, this degree of balance is reassuring. Another happy byproduct of our matching procedure is that treated and control scientists also appear quite similar in the extent of their eminence at the time of (counterfactual) death, whether such eminence is measured through NIH funding, the number of articles published, or the number of citations these articles received.
Collaborators versus Non-Collaborators.—One critical aspect of the empirical analysis is to distinguish between collaborators and non-collaborators of the star when measuring publishing activity in a subfield. It is therefore crucial to describe how this distinction can be made in our data. Information about the superstars’ colleagues stems from the Faculty Roster of the Association of American Medical Colleges (AAMC), to which we secured licensed access for the years 1975 through 2006, and which we augmented using NIH grantee information (cf. Azoulay, Graff Zivin, and Wang 2010 for more details).
10 We can assign a counterfactual year of death for each control subfield, since each control subfield is associ-ated with a particular treassoci-ated subfield through the matching procedure described above.
11 What is required is that the trends in publication activity be comparable between treated and control subfields up until the death of the treated scientist. We verify that this is the case below.
An important implication of our reliance on these sources of data is that we can only identify authors who are faculty members in US medical schools, or recipients of NIH funding. We cannot systematically identify scientists working for indus-trial firms, or scientists employed in foreign academic institutions.12 The great
benefit of using AAMC data, however, is that they ensure we have at our disposal both demographic and employment information for every individual in the rele-vant labor market: their (career) age, type of degree awarded, place of employ-ment, gender, and research output, whether measured by publications or NIH grants.
To identify authors, we match the authorship roster of each related article in one of our subfields with the AAMC roster.13 We tag as a collaborator any author
12 We can identify trainees who later go on to secure a faculty position, but not those who do not stay in academia.
13 We limit ourselves to authors with relatively infrequent names. Though this may create some measurement error, there is no reason to suspect that the wrongful attribution of articles to authors will impact treated and control subfields in a differential way.
Table 2—Summary Statistics: Control and Treated Subfields at Baseline
Mean Median SD Min. Max.
Control subfields (observations = 31,142)
Baseline stock of related articles in the field 76.995 59 64.714 0 384 Baseline stock of related articles in the field,
non-collaborators 68.390 51 60.222 0 381
Baseline stock of related articles in the field,
collaborators 8.604 5 10.358 0 125
Source article number of authors 3.970 4 1.901 1 15
Source article citations at baseline 16.331 8 30.305 0 770 Source article long-run citations 70.427 38 116.108 1 4,495
Investigator gender 0.067 0 0.249 0 1
Investigator year of degree 1960.546 1962 10.998 1926 1991
Death year 1991.125 1991 7.968 1975 2003
Age at death 58.100 58 8.795 34 91
Investigator cumulative number of publications 164 131 123 1 1,109 Investigator cumulative NIH funding
at baseline $18,784,517 $11,904,846 $25,160,518 0 $387,558,656 Investigator cumulative number of citations 12,141 8,010 12,938 9 157,581
Treated subfields(observations = 3,076)
Baseline stock of related articles in the field 76.284 58 64.046 0 368 Baseline stock of related articles in the field,
non-collaborators 67.752 51 59.725 0 357
Baseline stock of related articles in the field,
collaborators 8.532 5 9.841 0 86
Source article number of authors 3.987 4 1.907 1 14
Source article citations at baseline 16.694 8 36.334 0 920 Source article long-run citations 70.432 35 180.528 1 6,598
Investigator gender 0.099 0 0.299 0 1
Investigator year of degree 1960.141 1961 10.898 1928 1986
Death year 1991.125 1991 7.970 1975 2003
Age at death 58.100 58 8.796 34 91
Investigator cumulative number of publications
170 143 118 12 1,380
Investigator cumulative NIH funding at baseline
$17,637,726 $12,049,690 $24,873,018 0 $329,968,960 Investigator cumulative number of citations 11,580 8,726 10,212 120 72,122
Notes: The sample consists of subfields for 452 deceased superstar life scientists and their matched control sub-fields. See online Appendix D for details on the matching procedure. All time-varying covariates are measured in the year of superstar death.
who appeared as a coauthor of the star associated with the subfield on any pub-lication prior to the death. Each related article is therefore assigned to one of two mutually exclusive bins: the “collaborator” bin comprises the set of publi-cations with at least one identified author who coauthored with the star prior to the year of death (or counterfactual death); the “ non-collaborator” bin comprises the set of publications with no identified author who coauthored with the star prior to the year of death (or counterfactual death).14 As can be seen in Table 2,
roughly 11 percent of the publication activity at baseline can be accounted for by collaborators. Moreover, this proportion is very similar for control and treated subfields.15
A First Look at Subfield Activity.—Online Appendix Figure E1 confirms that the treated and control subfields are on similar trajectories in publication activ-ity up to the time of superstar death (though they diverge after the death event). This provides suggestive evidence for the validity of our research design, and is notable since the coarsened exact matching procedure that generated the sam-ple of control subfields did not make any use of these outcomes. Moreover, the absence of differential trends can be observed for overall activity, for activ-ity restricted to collaborators of the star, and for the publishing activactiv-ity of non-collaborators.
14 We identify the publications in the subfield for which the superstar is an author and eliminate them from these calculations. As a result, any decrease in activity within the subfield cannot be ascribed to the mechanical effect of its star passing away.
15 We define collaboration status by looking at the authorship roster for the entire corpus of work published by the star before or in the year of death, and not only with respect to the articles of the star that belong to the focal subfield. 0 0.05 0.10 0.15 Fraction of subfields 0 25 50 75 100 150 200 300 400 Control Treated
Figure 1. Cumulative Stock of Publications at Time of Death
Notes: We compute the cumulative number of publications, up to the year that immediately precedes the year of death (or counterfactual year of death) for the 3,076 treated subfields and 31,142 control subfields.
More boldly, we can use these averages in the raw data to examine changes in outcomes after the death. For both treated and control subfields, the curves exhibit a pronounced inverted U-shaped pattern, with activity first increasing until it reaches a peak roughly two years before the death of the star (or coun-terfactual death for the control subfields and their associated stars). Activity then decreases steadily, but the slope of the decrease appears more pronounced for control subfields, relative to treated subfields (panel A). This pattern is flipped when examining activity due to collaborators (panel B): the relative decline is much more pronounced for treated subfields, which is consistent with the results in Azoulay, Graff Zivin, and Wang (2010). Panel C, which focuses on subfield activity limited to non-collaborators, provides the first nonparametric evidence that the downward-sloping part of the activity curve is less steep for treated subfields.
Online Appendix Figure E1 provides a transparent illustration of subfield publi-cation activity over time, which proceeds directly from averaging the raw data, but the evidence it provides should be handled with an abundance of caution. First, it conflates calendar time and experimental time, when in actuality the death events in the data occur at varying frequencies between the years 1975 and 2003. Second, covariates like field age are not perfectly balanced across the treated and control groups, since the number of control subfields is not identical across treated sub-fields. Finally, it abstracts away from robust inference, and particularly from clus-tering: one would expect the subfield outcomes associated with an identical star to be correlated. Our econometric framework, described below, addresses these limitations and as a result provides a more solid foundation for the estimation of the causal effect of star death on the dynamics of subfield activity.
III. Results
The exposition of the econometric results proceeds in stages. After a review of methodological issues, we provide results that pertain to the main effect of superstar death on subfield growth, measured by publication rates and funding flows. Next, we attempt to elucidate the mechanism (or set of mechanisms) at work to explain our most robust finding, that of relative subfield growth in the wake of a star’s pass-ing, a growth entirely accounted for by contributions from non-collaborators. We do so by examining the characteristics of the articles published by non-collaborators, before turning to the characteristics of their authors. We also explore heterogeneity in the treatment effect through the interaction of the post-death indicator variable with various attributes of the stars and the subfields.
A. Econometric Considerations
Our estimating equation relates publication or funding activity in subfield i in year t to the treatment effect of losing a superstar:
(1) E
[
y it | X it]
= exp [ β 0 + β 1 AFTER_DEAT H itwhere y is a measure of subfield activity, AFTER_DEATH denotes an indicator variable that switches to 1 in the year after the superstar associated with i passes away, TREAT is an indicator variable for treated subfields, f
(
AG E it)
corresponds to a flexible function of the field’s age, the δ t s stand for a full set of calendar year indicator variables, and the γ i s correspond to subfield fixed effects, consistent with our approach to analyze changes in activity within subfield i following the passing of a superstar.16The subfield fixed effects control for many time-invariant characteristics that could influence research activity, such as the need for capital equipment or the extent of disease burden (e.g., for clinical fields). A pregnant metaphor for the growth of scientific knowledge has been that of biological evolution (Hull 1988, Chavalarias and Cointet 2013): a field is born when new concepts are introduced, resulting in an accelerating production of “offspring” (articles), until the underlying scientific community loses its thematic coherence, ushering in an era of decline (or alternatively, splitting or merging events). To flexibly account for such life-cycle effects, we include subfield age indicator variables (where subfield age is computed as the number of years since the year of publication for the source article). The calendar year effects filter out the effects of the general expansion of the scientific enterprise as measured by the number of journals and articles published each year.17
We follow Jaravel et al. (2018) in including in our specification an indicator for the timing of death that is common to treated and control subfields (whose effect will be identified by the coefficient β 1 ) in addition to the effect of interest, an
inter-action between AFTER_DEATH and TREAT (whose effect will be identified by the coefficient β 2 ). The effects of these two variables are separately identified because
(i) death events are staggered across our observation period and (ii) control subfields inherit a counterfactual date of death because they are uniquely associated with a treated subfield through the matching procedure described in Section IIC. The inclu-sion of the common term addresses the concern that age, calendar year, and subfield fixed effects may not fully account for shifts in subfield activity around the time of the star’s passing. If this is the case, AFTER_DEATH will capture the corresponding transitory dynamics, while AFTER_DEATH × TREAT will isolate the causal effect of interest. Empirically, we find that in some specifications, the common term has substantial explanatory power, though its inclusion does not radically alter the mag-nitude of the treatment effect.
Estimation.—The dependent variables of interest, including publication counts and NIH grants awarded, are skewed and non-negative. For example, 31.40 percent of the subfield/year observations in the data correspond to years of no publication activity; the figure climbs to 56.70 percent if one focuses on the count of NIH grants awarded. Following a long-standing tradition in the study of scientific and techni-cal change, we present quasi-maximum likelihood (QML) estimates based on the conditional fixed effects Poisson model developed by Hausman, Hall, and Griliches
16 To avoid confusion, we have suppressed any subscript for the superstars. This is without loss of generality, since each subfield is uniquely associated with a single star.
17 It is not possible to separately identify calendar year effects from age effects in the “within subfield” dimen-sion of a panel in a completely flexible fashion, because one cannot observe two subfields at the same point in time that have the same age but were born in different years (Hall, Mairesse, and Turner 2007).
(1984). Because the Poisson model is in the linear exponential family, the coeffi-cient estimates remain consistent as long as the mean of the dependent variable is correctly specified (Gouriéroux, Monfort, and Trognon 1984).
Inference.—QML (i.e., “robust”) standard errors are consistent even if the underly-ing data-generatunderly-ing process is not Poisson. In fact the Hausman et al. estimator can be used for any non-negative dependent variables, whether integer or continuous (Santos Silva and Tenreyro 2006), as long as the variance/covariance matrix is computed using the outer product of the gradient vector (and therefore does not rely on the Poisson variance assumption). Further, QML standard errors are robust to arbitrary patterns of serial correlation (Wooldridge 1997), and hence immune to the issues highlighted by Bertrand, Duflo, and Mullainathan (2004) concerning inference in DD estimation. We cluster the standard errors around superstar scientists in the results presented below.18
Dependent Variables.—Our primary outcome variable is publication activity in a subfield. However, we go beyond this raw measure by assigning the related arti-cles that together constitute the subfield into a variety of bins. For instance, we can decompose publication activity in the subfield into two mutually exclusive sub-fields: articles with a superstar on the authorship roster versus articles without a superstar; etc. Articles in each bin can then be counted and aggregated up to the subfield/year level.
Capturing funding flows at the field level is slightly more involved. PubMed sys-tematically records NIH grant acknowledgments using grant numbers. Unfortunately, these grant numbers are often truncated and omit the grant cycle information that could enable us to pin down unambiguously the particular year in which the grant was awarded. When it is missing, we impute the award year using the following rule: for each related publication that acknowledges NIH funding, we identify the latest year in the three-year window that precedes the publication during which funding was awarded through either a new award or a competitive renewal. To measure funding activity in a subfield, we create a count variable that sums all the awards received in a particular year, where these awards ultimately generate publications in the focal subfield.
B. Main Effect of Superstar Death
Table 3 and Figure 2 present our core results. Overall, we find that publica-tion activity increases slightly following the death of a star scientist who was an active contributor to it, but the magnitude of the effect is modest (about 5.2 per-cent) and imprecisely estimated (column 1). Yet, this result conceals a striking pat-tern that is uncovered when we distinguish between publications by collaborators and non-collaborators. The decline in publication activity accounted for by previ-ous collaborators of the star is large, on the order of 20.7 percent (column 2). This
18 Knowledge spillovers and scientific breakthroughs, including the adoption of research tools, could encourage innovation across related fields. This possibility is not entirely dealt with by clustering inference at the star level, since spatial dependence in knowledge space could occur between any pair of subfields, whereas clustering only allows for dependence among the subfields associated with the same star. As it turns out, the Poisson conditional fixed effects estimator also provides a consistent estimator of the variance in the presence of time-invariant patterns of spatial auto-correlation (Bertanha and Moser 2016).
evidence is consistent with previous findings, which showed that coauthors of super-star scientists who die suffer a drop in output, particularly if their non-collaborative work exhibited strong keyword overlap with the star, i.e., if they were intellectually connected in addition to being coauthors (Azoulay, Graff Zivin, and Wang 2010, Table VI, column 2).
A limitation of the previous work focusing on the fate of collaborators after the loss of an eminent scientist always lied in the failure to distinguish between social and intellectual channels of influence, since every treated scientist was by definition a collaborator, even if merely a casual one. In this study, we can relax this constraint, and when we do, we find that relative publication activity by non-collaborators in the subfield increases by a statistically significant 100 ×
(
e 0.082 − 1)
= 8.6%(column 3).19
We also explore the dynamics of the effects uncovered in Table 3. We do so by estimating a specification in which the treatment effect is interacted with a set of indicator variables corresponding to a particular year relative to the superstar’s death, and then graphing the effects and the 95 percent confidence interval around them (panels A, B, and C of Figure 2 correspond to columns 1, 2, and 3 in Table 3).20
Two features of the figure are worthy of note. First, the dynamics amplify the pre-vious results in the sense that we see the effects increasing (in absolute value) mono-tonically over time: there is no indication that the effects we estimated in Table 3 are merely transitory. Five years after a star’s death, the relative increase in publication
19 The number of observations varies ever so slightly across columns because the conditional fixed effects specification drops observations corresponding to subfields for which there is no variation in activity over the entire observation period. This is true as well for the results reported in Tables 4 through 7.
20 In these specifications, the AFTER_DEATH term which is common to treated and control subfields is also interacted with a complete series of lags and leads relative to the year of death or counterfactual death.
Table 3—Effect of Superstar Death on Subfield Entry Rates
Publication flows NIH funding flows (number of awards) All authors Collaborators
only
Non-collaborators
only All authors Collaborators only
Non-collaborators only (1) (2) (3) (4) (5) (6) After death 0.051 −0.232 0.082 0.046 −0.265 0.110 (0.029) (0.057) (0.029) (0.035) (0.076) (0.033) Number of investigators 6,260 6,124 6,260 6,215 5,678 6,202 Number of fields 34,218 33,096 34,218 33,912 29,163 33,806
Number of field-year obs. 1,259,176 1,217,905 1,259,176 1,049,942 902,873 1,046,678 log likelihood −2,891,110 −729,521 −2,768,252 −1,350,204 −472,329 −1,223,913
Notes: Estimates stem from conditional (subfield) fixed effects Poisson specifications. The dependent variable is the total number of publications in a subfield in a particular year (columns 1, 2, and 3), or the total number of NIH grants that acknowledge a publication in a subfield (columns 4, 5, and 6). All models incorporate a full suite of year effects and subfield age effects, as well as a term common to both treated and control subfields that switches from 0 to 1 after the death of the star, to address the concern that age, year, and individual fixed effects may not fully account for trends in subfield entry around the time of death. Exponentiating the coefficients and differencing from one yield numbers interpretable as elasticities. For example, the estimates in column 3 imply that treated subfields see an increase in the number of contributions by non-collaborators after the superstar passes away, a statistically significant 100 × (exp[0.082] − 1) = 8.55%. Robust standard errors in parentheses, clustered at the level of the star scientist.
activity by non-collaborators is large enough in magnitude to fully offset the decline in activity by collaborators. Second, there is no discernible evidence of an effect in the years leading up to the death, a finding that validates ex post our identification strategy.
Nevertheless, the case for the exogeneity of death events with respect to the course of knowledge growth and decline within a subfield is stronger for sudden causes of deaths than for anticipated causes of death. Online Appendix Figure E2 provides a version of panel C of Figure 2 (event study graphs for non-collaborators) broken down by causes of death (anticipated versus sudden). While there is more variability in the estimated path of outcomes in the years leading up to the death event in the anticipated case (panel A) than in the sudden case (panel B), it is imprecisely estimated and non-monotonic. In both panels, however, one can observe a slow but steady increase after the event in the rate of contributions by
−0.6 −0.5 −0.4 −0.3 −0.2 −0.10 0.1 0.2 0.3 0.4 0.5 −0.6 −0.5 −0.4 −0.3 −0.2 −0.10 0.1 0.2 0.3 0.4 0.5 −0.6 −0.5 −0.4 −0.3 −0.2 −0.10 0.1 0.2 0.3 0.4 0.5 −10 −9−8−7−6−5−4−3−2−1 0 1 2 3 4 5 6 7 8 9 10 −10 −9−8−7−6−5−4−3−2−1 0 1 2 3 4 5 6 7 8 9 10 −10 −9−8−7−6−5−4−3−2−1 0 1 2 3 4 5 6 7 8 9 10
Time to/after death
Time to/after death Time to/after death
Panel A. All authors
Panel C. Non-collaborators
Panel B. Collaborators
Figure 2. Effect of Star Scientist Death on Subfield Growth and Decline
Notes: The dark dots in the above plots correspond to coefficient estimates stemming from conditional (subfield) fixed effects Poisson specifications in which publication flows in subfields are regressed onto year effects, subfield age effects, as well as 20 interaction terms between treatment status and the number of years before/after the death event (the indicator variable for treatment status interacted with the year of death is omitted). The specifications also include a full set of lead and lag terms common to both the treated and control subfields to fully account for tran-sitory trends in subfield activity around the time of the death. The 95 percent confidence interval (corresponding to robust standard errors, clustered at the level of the star scientist) around these estimates is plotted with vertical light gray lines; panel A corresponds to a dynamic version of the specification in column 1 of Table 3; panel B corre-sponds to a dynamic version of the specification in column 2 of Table 3; panel C correcorre-sponds to a dynamic version of the specification in column 3 of Table 3.
non-collaborators in treated subfields, relative to control subfields. The distinction between sudden and anticipated events is explored further in Section IIID.
The last three columns of Table 3 focus on funding flows from the National Institutes of Health (NIH) rather than publication flows. More precisely, the out-come variable in columns 4, 5, and 6 is the number of distinct NIH awards that acknowledge a publication in the subfield in the three-year window before the year of publication for the related article (summing the financial total of grant amounts, as opposed to the number of grants, yields similar results). The patterns are very similar to those obtained in the case of publication activity, both in terms of magni-tudes and in terms of statistical significance.
C. Subfield Growth Patterns
In the remainder of the manuscript, we seek to characterize the kind of contribu-tion, and the type of investigators that give rise to the novel empirical regularity we uncovered: that of relative growth for subfields following the death of their superstar anchor, a phenomenon entirely accounted for by research activity undertaken by scientists who never collaborated with the star while alive. As a consequence, all the results below pertain to contributions by non-collaborators; any article with even one author who collaborated with the star is excluded from the count of articles that constitute the dependent variable.
The Impact and Direction of New Research.—What characterizes the additional contributions that together lead to increased activity in a subfield after a star has passed on? Are these in fact important contributions to the subfield? Do they con-tinue to focus on mainstream topics within the subfield, or should they be under-stood as taking the intellectual domain in a novel direction? Tables 4 and 5 explore these issues.
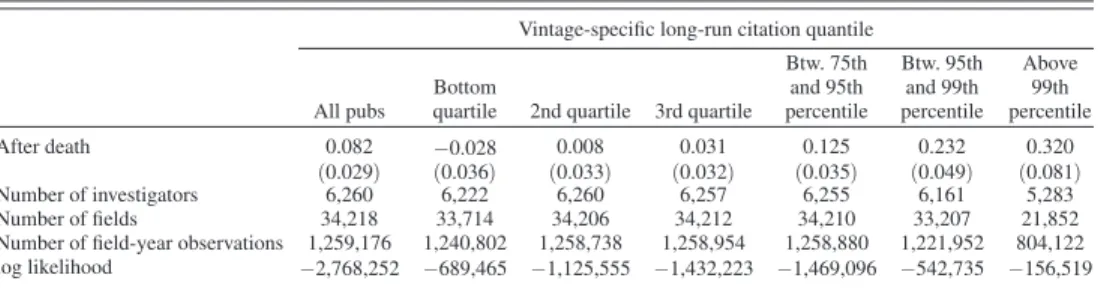
In Table 4, we parse every related article in the subfields to assign them into one of six mutually exclusive bins, based on their vintage-specific long-run citation impact: articles that fall in the bottom quartile of the citation distri-bution; in the second quartile; in the third quartile; articles that fall above the seventy-fifth percentile, but below the ninety-fifth percentile; articles that fall above the ninety-fifth percentile, but below the ninety-ninth percentile; articles that fall above the ninety-ninth percentile of the citation distribution.21 Each
column in Table 4 (with the exception of the first which simply replicates the effect for all papers, regardless of impact, that was previously displayed in Table 3, column 3) reports the corresponding estimates. A startling result is that the magnitude of the treatment effect increases sharply and monotonically as we focus on the rate of contributions with higher impact. In contrast, the number of
21 A vintage is comprised of all the articles published in a given year. When we are referring to the vintage-specific, article-level distribution of citations, the relevant universe to compute quantiles is not limited to the articles that constitute the subfields in our data. Rather, the relevant universe includes the entire set of 17,312,059 articles that can be cross-linked between PubMed and the Web of Science. As a result, there is no reason to suspect that individ-ual stars, or even our entire set of stars, could ever alter the shape of these distributions. For example, the article by Sopko et al. highlighted in online Appendix Figure C5 received 40 citations from other articles in PubMed by 2015. This puts this article above the seventy-ninth percentile of the citation distribution for articles published in 2002.
lower-impact articles contributed by non-collaborators contracts slightly, though the effect is not precisely estimated.22
Table 5 parses the related articles in each subfield to ascertain whether contri-butions by non-collaborators constitute a genuine change in intellectual direction. Panel A distinguishes between contributions that are proximate in intellectual space to the source article from those that are more distant (though still part of the sub-field as construed by PMRA). Because we have at our disposal both a cardinal and an ordinal measure of intellectual proximity, we present two sets of estimates. In both cases, the magnitude of the treatment effect pertaining to PMRA-proximate publication activity is larger, and more precisely estimated than the magnitude corresponding to PMRA-distant publication activity (relative to the same patterns for the control group of subfields). We can certainly rule out the conjecture that non-collaborators enter the field from the periphery. Rather, their contributions appear to tackle mainstream topics within the subfield. Panel B sheds light on the intellectual direction of the field, by examining the cited references contained in each related article. The first two columns separate related articles in two groups: publications that cite at least some work which belongs to the subfield identified by PMRA for the corresponding source and publications that cite exclusively out of the PMRA subfield. Only articles in the second group appear to experience growth in the post-death era. The next two columns proceed similarly, except that the list of references is now parsed to highlight the presence of articles authored by the star (column 3), as opposed to all other authors (column 4). We find that subfield growth
22 Online Appendix Table E3 and Figure E3 break down these results further by examining separately the growth of subfields by cause of death (anticipated versus sudden). As mentioned earlier, the case for exogeneity is stronger for sudden death, since when the death is anticipated, it would be theoretically possible for the star to engage in “intellectual estate planning,” whereby particular scientists (presumably close collaborators) are anointed as representing the next generation of leaders in the subfield. Our core results continue to hold when analyzed sep-arately by cause of death. However, we gain statistical power from pooling these observations, and some empirical patterns would be estimated less precisely if we chose to focus solely on observations corresponding to subfields for which the star died suddenly and unexpectedly.
Table 4—Scientific Impact of Entry
Vintage-specific long-run citation quantile
All pubs Bottom quartile 2nd quartile 3rd quartile
Btw. 75th and 95th percentile Btw. 95th and 99th percentile Above 99th percentile After death 0.082 −0.028 0.008 0.031 0.125 0.232 0.320 (0.029) (0.036) (0.033) (0.032) (0.035) (0.049) (0.081) Number of investigators 6,260 6,222 6,260 6,257 6,255 6,161 5,283 Number of fields 34,218 33,714 34,206 34,212 34,210 33,207 21,852
Number of field-year observations 1,259,176 1,240,802 1,258,738 1,258,954 1,258,880 1,221,952 804,122
log likelihood −2,768,252 −689,465 −1,125,555 −1,432,223 −1,469,096 −542,735 −156,519
Notes: Estimates stem from conditional (subfield) fixed effects Poisson specifications. The dependent variable is the total number of publications by non-collaborators in a subfield in a particular year, where these publications fall in a particular quantile bin of the long-run, vintage-adjusted citation distribution for the universe of journal articles in PubMed. All models incorporate a full suite of year effects and subfield age effects, as well as a term common to both treated and control subfields that switches from 0 to 1 after the death of the star. Exponentiating the coeffi-cients and differencing from one yield numbers interpretable as elasticities. For example, the estimates in column 1, panel A imply that treated subfields see an increase in the number of contributions by non-collaborators after the superstar passes away, a statistically significant 100 × (exp[0.082] − 1) = 8.55%. Robust standard errors in paren-theses, clustered at the level of the star scientist.
can be mostly accounted for by articles from non-collaborators who do not build on the work of the star.
Whereas panel B highlighted the extent to which contributors were bringing new sources of inspiration into the subfield, panel C focuses on the extent to which the
Table 5—Entry and Research Direction
Cardinal measure Ordinal measure Intellectual proximate articles Intellectual distant articles Intellectual proximate articles Intellectual distant articles Panel A After death 0.091 0.028 0.117 −0.024 (0.030) (0.035) (0.028) (0.037) Number of investigators 6,228 6,099 6,260 6,017 Number of fields 33,375 32,232 34,218 31,712
Number of field-year observations 1,228,157 1,186,589 1,259,176 1,167,423
log likelihood −1,628,374 −1,816,449 −1,893,982 −1,628,170
In-field versus out-of-field references
Backward citations to the star’s bibliome With in-field references Without in-field references With references to the star Without references to the star Panel B After death −0.023 0.128 0.078 0.152 (0.041) (0.031) (0.036) (0.034) Number of investigators 6,195 6,260 6,247 6,259 Number of fields 32,721 34,218 34,179 34,147
Number of field-year observations 1,204,315 1,259,176 1,257,747 1,256,576
log likelihood −792,795 −2,510,344 −1,914,448 −1,767,571
Vintage of cited references
Vintage of 2-way MeSH term combinations
Young Old Young Old
Panel C
After death 0.071 −0.010 0.090 0.029
(0.035) (0.034) (0.033) (0.036)
Number of investigators 6,260 6,260 6,258 6,260
Number of fields 34,218 34,214 34,206 34,210
Number of field-year observations 1,259,176 1,259,044 1,258,732 1,258,906
log likelihood −2,124,598 −1,613,457 −1,853,062 −1,784,275
Notes: Estimates stem from conditional (subfield) fixed effects Poisson specifications. In panel A, the dependent variable is the total number of publications by non-collaborators in a subfield in a particular year, where these pub-lications can either be proximate in intellectual space to the star’s source publication, or more distant (in the PMRA sense). Since PMRA generates both a cardinal and an ordinal measure of intellectual proximity, we parse the related articles using both measures, yielding a total of four different specifications. For the cardinal measure, a related article is deemed proximate if its similarity score is above 0.58, which corresponds to the median of relatedness in the sample. For the ordinal measure, a related article is deemed proximate if its similarity rank is below 90, which also corresponds to the median of similarity in the sample. In panel B, we focus on whether the content of entrants’ contributions in the subfield change after the superstar passes away. Each cited reference in a related article can either belong to the subfield, or fall outside of it; it can cite a publication of the star scientist associated with the subfield, or fail to cite any of the star’s past contributions. In panel C, the dependent variable is the total number of publications by non-collaborators in a subfield in a particular year, where these publications can either be “fresh” (citing young references, or being annotated by MeSH terms of recent vintage) or “stale” (citing old references, or being annotated by MeSH terms of distant vintage). All models incorporate a full suite of year effects and subfield age effects, as well as a term common to both treated and control subfields that switches from 0 to 1 after the death of the star. Exponentiating the coefficients and differencing from one yield numbers interpretable as elasticities. For example, the estimates in the first column of panel A imply that treated subfields see an increase in the number of PMRA-proximate contributions by non-collaborators after the superstar passes away, a statistically significant 100 × (exp[0.091] − 1) = 9.53%. Robust standard errors in parentheses, clustered at the level of the star scientist.