HAL Id: hal-00318134
https://hal.archives-ouvertes.fr/hal-00318134
Submitted on 9 Aug 2006
HAL is a multi-disciplinary open access
archive for the deposit and dissemination of
sci-entific research documents, whether they are
pub-lished or not. The documents may come from
teaching and research institutions in France or
abroad, or from public or private research centers.
L’archive ouverte pluridisciplinaire HAL, est
destinée au dépôt et à la diffusion de documents
scientifiques de niveau recherche, publiés ou non,
émanant des établissements d’enseignement et de
recherche français ou étrangers, des laboratoires
publics ou privés.
Survey of large-amplitude flapping motions in the
midtail current sheet
V. A. Sergeev, D. A. Sormakov, S. V. Apatenkov, W. Baumjohann, R.
Nakamura, A. V. Runov, T. Mukai, T. Nagai
To cite this version:
V. A. Sergeev, D. A. Sormakov, S. V. Apatenkov, W. Baumjohann, R. Nakamura, et al.. Survey
of large-amplitude flapping motions in the midtail current sheet. Annales Geophysicae, European
Geosciences Union, 2006, 24 (7), pp.2015-2024. �hal-00318134�
Ann. Geophys., 24, 2015–2024, 2006 www.ann-geophys.net/24/2015/2006/ © European Geosciences Union 2006
Annales
Geophysicae
Survey of large-amplitude flapping motions in the midtail current
sheet
V. A. Sergeev1, D. A. Sormakov1, S. V. Apatenkov1, W. Baumjohann2, R. Nakamura2, A. V. Runov2, T. Mukai3, and
T. Nagai4
1St. Petersburg State University, Petrodvoretz, 198504 St. Petersburg, Russia
2Austrian Academy Science, Space Research Inst., Schmiedlstrasse 6, Graz, 8042, Austria 3ISAS, Sagamihara, Kanagawa 229, Japan
4Tokyo Inst Technology., Dept Earth & Planetary Sciences., Ookayama 2-12-1 Meguro., Tokyo, 152-8551, Japan Received: 27 February 2006 – Revised: 10 May 2006 – Accepted: 14 June 2006 – Published: 9 August 2006
Abstract. We surveyed fast current sheet crossings (flapping motions) over the distance range 10–30 RE in the
magneto-tail covered by the Geomagneto-tail spacecraft. Since the local tilts of these dynamic sheets are large and variable in these events, we compare three different methods of evaluating current sheet normals using 4-s/c Cluster data and define the success criteria for the single-spacecraft-based method (MVA) to ob-tain the reliable results. Then, after identifying more than ∼ 1100 fast CS crossings over a 3-year period of Geotail obser-vations in 1997–1999, we address their parameters, spatial distribution and activity dependence. We confirm that over the entire distance covered and LT bins, fast crossings have considerable tilts in the YZ plane (from estimated MVA nor-mals) which show a preferential appearance of one (YZ kink-like) mode that is responsible for these severe current sheet perturbations. Their occurrence is highly inhomogeneous; it sharply increases with radial distance and has a peak in the tail center (with some duskward shift), resembling the oc-currence of the BBFs, although there is no one-to-one local correspondence between these two phenomena. The crossing durations typically spread around 1 min and decrease signif-icantly where the high-speed flows are registered. Based on an AE index superposed epoch study, the flapping motions prefer to appear during the substorm expansion phase, al-though a considerable number of events without any electro-jet and auroral activity were also observed. We also present statistical distributions of other parameters and briefly dis-cuss what could be possible mechanisms to generate the flap-ping motions.
Keywords. Magnetospheric physics (Magnetotail; MHD waves and instabilities; Plasma sheet)
Correspondence to: V. A. Sergeev
1 Introduction
Magnetospheric (magnetopause and magnetotail) current sheets are among those rare space current sheets which are available for direct observations. Their dynamics provide important clues to understand the plasma transport and con-ditions for explosive tail instability (substorm) to occur. One dynamic phenomenon, the flapping motions of the tail cur-rent sheet, manifests in observations as dramatic variations of the main magnetic field component (tail-aligned, Bx) in
the tail, often with the change in the Bx sign, indicating a
crossing of tail current central surface. Being known since first spacecraft measurements in the tail (Speiser and Ness, 1967), it is frequently observed in the active plasma sheet and is interesting both as a spectacular phenomenon (origin, properties, possibility to use as a diagnostic tool of active processes), as well as a tool to probe the sheet structure by crossing quickly across considerable portions of the current sheet (CS) thickness. There was a number of past studies which noticed their association with interplanetary shocks (McComas et al., 1986), with substorms and/or fast flows (Toichi and Miyazaki, 1976, Bauer et al., 1995, Sergeev et al., 1998), although counter-examples were also provided. The ideas about their characters included solar wind blow-induced surface waves in the X-direction (e.g. Fairfield et al., 1981), or kink-like oscillations in the Y direction (e.g. Lui et al., 1978; Nakagawa and Nishida, 1989), however, the diffi-culties of separating temporal and spatial variations, and of measuring the gradients and current sheet tilts strongly lim-ited the possibilities to study these phenomena with a single spacecraft.
The situation drastically changed recently after the launch of the four-spacecraft Cluster which allows one to probe gra-dients and to better investigate both the current sheet struc-ture and its dynamics. Already first event studies (start-ing from Zhang et al., 2002) indicated very large and vari-able tilts in the YZ plane and a predominant propagation
2016 V. A. Sergeev et al.: Survey of flapping motions in the midtail in the Y-direction associated with flapping motions, and this
was thereafter confirmed in statistical studies (Sergeev et al., 2004; Runov et al., 2005) which allowed one to identify them as the “kink-like” perturbations. However, the polar orbit of Cluster strongly limits the amount of current sheet crossings recorded, as well as their distance in the tail (they were all clustered near Cluster apogee at r around 18 Re during the first years of operation). To address the occurrence in the tail, possible changes in the perturbation mode and characteristics with distance (both along and across the tail), as well as ac-tivity dependence and some other aspects which require one to analyze the large amount of data, one has to include other data sources. In this paper we use the Cluster experience and the extensive observations in near-equatorial tail region made by Geotail to study the flapping motions statistically.
The paper is organized as follows. In the next section we compare 3 different techniques available at Cluster for cur-rent sheet normal determination with the purpose of defining the practical criterion to use a single-spacecraft-based Mini-mal Variance Analysis technique when surveying the Geotail data. Then in the main Sect. 3 we analyse the Geotail obser-vations, and thereafter discuss the results in Sect. 4.
2 Tilt characterization during fast current sheet
cross-ings: Cluster results
Some results and conclusions of the flapping survey pre-sented below depend on the accuracy of estimated local cur-rent sheet (CS) tilts, which requires some comments and an additional study. No perfect method exists to probe the sheet tilt and structure, even with data obtained at a few regu-larly spaced observation points, like the four Cluster space-craft. The advantage of Cluster is that three different meth-ods could be used, which, fortunately, depend on different assumptions, so their cross-comparison helps to be sure in the correctness of the interpretation results. The four space-craft timing method, which assumes a planar sheet structure and either a constant speed, or a constant thickness (see, e.g. Haaland et al., 2004), gives both the sheet orientation and the normal component of its propagation velocity. Also, us-ing the magnetic field gradient linear estimation technique (Chanteur et al., 1998), the sheet tilt can be determined based on the direction of the estimated electric current (j , ob-tained in the center of 1-D sheet, planar sheet structure is also assumed). This vector is suggested to lay on the neu-tral sheet plane, therefore, the unit vector of the sheet nor-mal can be obtained as n=[l×j]/|[l×j]|, where l is the max-imum B-variability direction obtained from MVA (Runov et al., 2005). The agreement between these methods can be used as an indication that we deal with nearly a 1-D current sheet which conserves its orientation during the CS crossing. Finally, the well-known Minimum Variance Analysis (Son-nerup and Schneible, 1998) was widely used for many years to estimate the sheet orientation, although, in a strict sense,
no physical law guarantees that it provides the accurate esti-mate even in a nearly 1-D current sheet. For example, in the Harris-type 1-D sheet the magnetic variance is zero not only in the normal direction, but also along the direction of elec-tric current, so some other factors, either field-aligned cur-rents or perturbations, will determine what will be the small-est MVA variance direction.
Previous Cluster-based studies of solar wind discontinu-ities (based on a comparison between timing and MVA meth-ods) indicated that it is possible to obtain the success crite-ria for the MVA to work. Particularly, for solar wind dis-continuities Knetter et al. (2004) found the good accuracy of MVA (with sufficient amount of measurement points in the discontinuity) when the magnetic shear was large and the medium-to-minimal eigenvalues ratio r23=λ2/λ3 was large (>8 in their case). Unfortunately, these practical criteria can-not be easily transferred to acan-nother object (to the tail current sheet, in our case), where the underlying physics can be dif-ferent. Also, with the increasing threshold of r23, the amount of usable data strongly decreases, so some trade off between the high accuracy and sufficient amount of remaining events is unavoidable. This is what we investigate in this section based on Cluster data, and what will then be used later on in the analysis of Geotail data.
We used the Cluster FGM observations at 1-s resolution during July–October 2001 and 2004 tail seasons, in which the spacecraft tetrahedron has comparable sizes (∼1000– 1500 km). Short (30 s<1t <300 s) crossings of the current sheet with considerable Bx change (being a sizable
frac-tion of the lobe field BL, that is 1Bx>0.5 BL∼15 nT) have
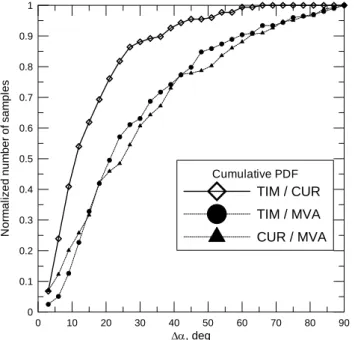
been identified, which resulted in 186 (and 187) crossings identified in years 2001 (and 2004). A subset of ∼200 crossings was then selected in which all four spacecraft crossed (or touched) the neutral sheet, where a sufficient amount of curlometer determinations were accurate enough (|DivB|/|CurlB|<0.3 in >60% of points) and variations at all SC have similar shapes (allowing the use of timing); see Runov et al. (2005) for the description of the selection proce-dure and events in 2001, as well as all data procession details. Cross-comparison of current sheet normals obtained by different methods in the later analysis is based on scalar prod-ucts between the pairs of normals from which the angular difference between the two normals (1α) was obtained. Cu-mulative probability distribution functions (PDF) in Fig. 1 (for events in which the normals could be obtained by both compared methods, notice that amounts of events differ in different pairs) shows that the best agreement is observed be-tween timing (TIM) and current-based (CUR) methods. For them more than 2/3 of all events agree to within a 1α=15◦ difference. Agreement of these two methods with the MVA determinations is not as good, requiring a much broader in-terval 1α<35◦ for 2/3 of all events to agree. No selection on any other parameter/condition characterizing MVA per-formance (e.g. dependence on the ratio r23) was used at this step; this is what we explore next.
V. A. Sergeev et al.: Survey of flapping motions in the midtail 2017 0 10 20 30 40 50 60 70 80 90 ∆α, deg 0 0.1 0.2 0.3 0.4 0.5 0.6 0.7 0.8 0.9 1 N o rm al iz ed num ber of s a m p le s Cumulative PDF TIM / CUR TIM / MVA CUR / MVA
Fig. 1. Cumulative probability distribution function of events with
angular difference between two normals (obtained with TIM, CUR or MVA methods) below the given 1α angular difference.
We choose then a subset of 109 crossings in which the TIM/CUR agreement is good (1α<15◦). Using the TIM
normals as our guess of the true normal in these cases, we used MVA determinations from each of the 4 spacecraft to compare their angular deviations from true normal as a func-tion of r23 (in total having 428 intervals). Figure 2 indicates that indeed the angular deviation is small for large r23 val-ues, and grows with a decrease of this ratio; similar to the results by Knetter et al. (2004) the error curve shows a con-siderable change around the r23=8 threshold. However, the amount of events strongly decreases when the r23 decreases from 20 until 3, so for practical purposes one should com-promise between the requirements, to obtain a good accu-racy and to keep a large enough and representative data set for doing statistics. With the threshold r23>4 adopted be-low for our statistical study of Geotail data, most of normal determinations are expected to be accurate to within 20–30◦.
3 Geotail observations of flapping motions
The present Geotail equatorial orbit provides an excellent opportunity to survey the plasma sheet dynamics between 10 and 30 Re since 1995. We used magnetic field (MGF) and plasma (LEP) parameters at a 12-s resolution to select and characterize the events and a 3-s magnetic field data to perform the MVA. We surveyed the spatial region X<8, |Y |<15 Re GSM and excluded magnetosheath samples in the near flank regions. We defined fast CS crossings by the re-quirement of a fast (30 s<1t<300 s), monotonous change in
1 2 3 5 10 20 30 50 100 200
r
23 0 10 20 30 40<∆α>
, degrees
20 79 120 110 57 28 8 6MVA accuracy depending on eigenvalue ratio (r23) 0 20 40 60 80 100 Samples with r 23 a b o v e th e thre sh old, % HQ Median LQ
Fig. 2. Performance of MVA as a function of eigenvalue ratio r23. Angular differences from the TIM normal (characterized by median and high (HQ) and low (LQ) quartiles, where the number of events in every bin) is shown together with the number of events (circled
curve) with r23exceeding the given threshold.
the Bx-component of considerable amplitude (|1Bx|>BL,
where BL is the equivalent lobe field obtained from the pres-sure balance as BL=(B2+2µ0nTi)1/2). With these
criteri-ons we identified 1270 fast current sheet crossing events dur-ing ∼3 years (December 1996–May 1999) to be analysed. Their spatial coverage is shown in Fig. 3.
3.1 Occurrence and current sheet parameters
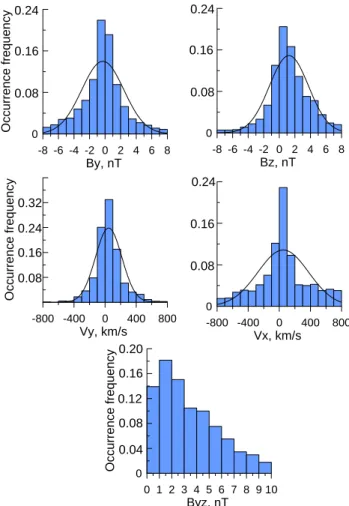
Characteristic values of plasma velocity (Vx and Vy) and
magnetic field components in the neutral sheet (Bx∼0) are
given in Fig. 4. The magnetic field magnitude in the CS center is nonzero but most frequently small (Byz median is
about 2nT). The Bycomponent has symmetric distribution,
whereas Bzis shifted towards positive values, reflecting the
closed character of the field lines in the majority of the sur-veyed events. Unlike the narrow Gaussian Vydistribution, Vx
has a wide non-Gaussian distribution. It has a large amount (>25%) of low-speed events (Vx<100 km/s), but also
dis-plays pronounced high-speed flow wings for both earthward and tailward flows, showing that many fast crossings had as-sociated fast plasma flows (BBFs).
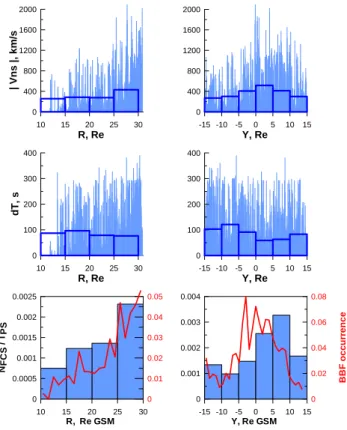
A large amount of high speed flows is also seen in the top charts of Fig. 5, however, the average values (see Y-dependent plot) are near 400 km/s, which is the conventional threshold for the BBFs (Angelopoulos et al., 1994). Y-plot shows somewhat higher flow speed in the middle-dusk sec-tor of the tail, where the average velocity strongly increases
2018 V. A. Sergeev et al.: Survey of flapping motions in the midtail -15 -10 -5 0 5 10 15 Ygsm, Re 0 -5 -10 -15 -20 -25 -30 X, Re dusk dawn
1270 points (absent solar plasma, points with dT>400 sec and mistake points > -10 Re) Figure 3
Fig. 3. Spatial distribution of fast current sheet crossings in the
equatorial plane.
with the distance from ∼200 km/s in the 10–15 Re bin to-wards >400 km/s in the 25–30 Re bin, consistent with previ-ous flow speed statistics in the earthward flux transfer events (e.g. Sch¨odel et al., 2001).
We also computed the occurrence of crossings and com-pare it with the occurrence of BBFs. (These are different kinds of statistics: the flapping occurrence is a statistic of the events with different durations, whereas the BBF occurrence is s statistic of 12-s samples with plasma β>1 and a flow ve-locity above the 400-km/s threshold. To have the occurrences in comparable quantities we normalized the amount of flap-ping events by the amount of minutes of observations with β>1, after noticing that the average duration of the flapping event is close to one minute.) As seen at the bottom plots of Fig. 5, the occurrence of crossings is very inhomogeneous over the region studied, and this is probably the most im-portant new result of our survey. It increases considerably with the distance, and maximizes in the central sector of the tail (with some duskward shift). The significance of this in-homogeneity is further emphasized by a comparison to the occurrence of the fast plasma flows (BBFs, red traces) which shows similar behavior. This suggests a close relationship between these two phenomena, which will be further dis-cussed in Section 4. The occurrence of crossings is roughly a factor 20 smaller than the occurrence of BBFs. (We shall not later discuss thoroughly the different Y-positions of the peak in flapping and BBF distributions, because we found that the shape of BBF Y-distribution varies with the varying selec-tion criteria. In particular, lifting the β>1 condiselec-tion results in the dusk-shifted distribution which matches the flapping occurrence.) -8 -6 -4 -2 0 2 4 6 8 By, nT 0 100 200 300 Occurrence frequency -8 -6 -4 -2 0 2 4 6 8 Bz, nT 0 100 200 300 -800 -400 0 400 800 Vy, km/s Occurrenc e frequency -800 -400 0 400 800 Vx, km/s 0 100 200 300 0 1 2 3 4 5 6 7 8 9 10 Byz, nT 0 50 100 150 200 250 Occurrence frequency 0.24 0.16 0.08 0.24 0.16 0.08 0.24 0.16 0.08 0.24 0.16 0.08 0.32 0.16 0.08 0.20 0.12 0.04
Fig. 4. Normalized occurrence frequency distributions of magnetic
field and plasma flow velocity components in the neutral sheet dur-ing fast plasma sheet crossdur-ings (their Gaussian fits are also shown).
Byz=(By2+Bz2)1/2)is the magnetic field in the neutral sheet.
The duration of the crossings (dT is the time between ob-servations of min/max Bxvalues during the CS crossing) is,
on average, about 1 min (see dT medians in Fig. 5); it shows some tendency to decrease with distance, displaying some anticorrelation with the average velocity behavior. This re-lationship is directly seen in Fig. 6, showing the drastic dif-ference between very short crossings seen in the high speed flows as contrasted to much slower (with large spread in du-ration) crossings in the low speed plasma.
3.2 Characteristics of current sheet in the flapping wave Now we investigate the properties of the perturbations caus-ing the fast current sheet crosscaus-ings. The first characteris-tic of importance is the tilt of the flapping sheets available from the MVA techniques, whose accuracy was discussed in Section 2. After obtaining the MVA estimates based on 3-s time resolution data (with a requirement that at least 15 data points during the crossing should be available for the MVA analysis) we studied statistics and selected the eigenvalue
V. A. Sergeev et al.: Survey of flapping motions in the midtail 2019 10 15 20 25 30 R, Re 0 400 800 1200 1600 2000 | Vns |, km/s -15 -10 -5 0 5 10 15 Y, Re 0 400 800 1200 1600 2000 10 15 20 25 30 R, Re 0 100 200 300 400 dT, s -15 -10 -5 0 5 10 15 Y, Re 0 100 200 300 400 -15 -10 -5 0 5 10 15 Y, Re GSM 0 0.001 0.002 0.003 0.004 0 0.02 0.04 0.06 0.08 B B F occ u rr en ce 10 15 20 25 30 R, Re GSM 0 0.0005 0.001 0.0015 0.002 0.0025 NFC S / T PS 0 0.01 0.02 0.03 0.04 0.05
Fig. 5. Dependence of neutral sheet flows, duration of CS crossing
and occurrence frequency of flapping events against the distance
from the Earth (R=(x2+y2)1/2) and across the tail (Ygsm). The
flapping occurrence is normalized to a total number of minutes of observation spent by the spacecraft in that spatial bin. Occurrence rate of fast plasma flows (with |V x|>400 km/s) is shown for com-parison in the two bottom panels.
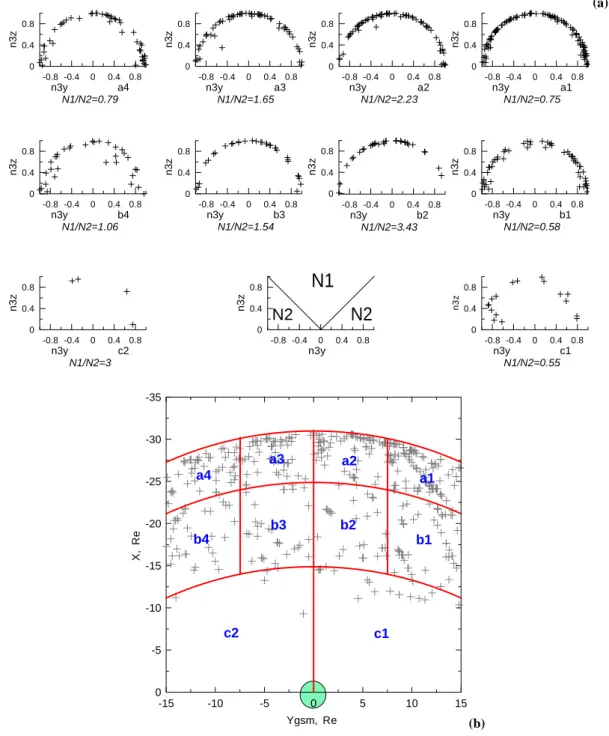
ratio low threshold to be r23=4. These requirements leave us 469 crossings (less than half of all events, but still a good number to study the spatial variation of characteristics). Since seasonal/daily tilting and warping of the current sheet produce large deviations of the neutral sheet normal from the Zgsm axis, for each event we computed the local normal ex-pected for the given epoch at the given location, according to empirical neutral sheet shape given by Tsyganenko and Fair-field (2004), and rotated the obtained MVA normal (vector n3) to this local neutral sheet coordinate system – see Fig. 7a.
The distributions of the tilts in all spatial bins of Fig. 7 are surprisingly similar, lying near the unit circle in the YZ plane (means, |nx| |ny|,|nz| since n2=1). According to Fig. 2,
under the threshold used, the expected MVA accuracy lies to within a 20–30◦ deviation from the actual normal, there-fore, the large deviations from the nominal normal are a real property of flapping motions in all spatial bins which have enough data points. The points are nearly homogeneously distributed along the unit circle, which means that strong de-viations from the nominal normal (Z-axis) are a rule for the flapping current sheets. The ratio N1/N2 is used to
character-10 100 1000
Vxy, km/s
0 100 200 300 400dT, sec
Fig. 6. Relationship between the neutral sheet flow amplitude V xy=((V x2+V y2)1/2)and duration of the CS crossings. Short crossings (12 to 30 s) were also included in this plot.
ize the amount of sheets N1 with normals close to the nomi-nal normal (along Z), as compared to the amount of anoma-lously tilted sheets N2 (see a scheme in the Fig. 7a). Com-paring different bines we easily see that while in the cen-tral sector (bins a2, a3, b2, b3 – see a binning scheme in Fig. 7b) the normals near the nominal direction are more fre-quent (N1/N2 1), while near the flanks (a1, a4, b1, b4) the anomalously tilted normals prevail (N1/N2≤1).
The data base of fast current sheet crossings includes both isolated crossings, as well as sequences of crossings. We de-fined as a sequence a number (at least three) of sequential fast CS crossings, if the time difference between them does not exceed 300 s. Fifty-one sequences were identified with these criteria in our data base. An example in Fig. 8 shows such a sequence and helps to demonstrate the techniques used to evaluate the parameters of what could be the flapping wave. They are based on the interpretation of vertical plasma ve-locity Vzas a proxy for the up/down translational motions of
entire plasma sheet. A test for such a hypothesis could be the anticorrelation between the time derivative dBx/dtand
verti-cal velocity Vz(Sergeev et al., 1998). This is definitively the
case in the example event, where (see compared time series in the second-top panel) the correlation coefficient between the dBx/dt and Vz data points is CC=0.58. By integrating Vzin time and after detrending the resulting pattern (because
of systematic Vzoffset often existing in the observations of
spacecraft rotating around Z-axis) we obtain the estimated vertical motions of the current sheet (top panel). By eval-uating the largest difference between subsequent peaks we obtain the apparent amplitude of the vertical wave motion (A, see Fig. 8).
2020 V. A. Sergeev et al.: Survey of flapping motions in the midtail -0.8 -0.4 0 0.4 0.8 n3y a4 N1/N2=0.79 0 0.4 0.8 n3z -0.8 -0.4 0 0.4 0.8 n3y a3 N1/N2=1.65 0 0.4 0.8 n3z -0.8 -0.4 0 0.4 0.8 n3y a2 N1/N2=2.23 0 0.4 0.8 n3z -0.8 -0.4 0 0.4 0.8 n3y a1 N1/N2=0.75 0 0.4 0.8 n3z -0.8 -0.4 0 0.4 0.8 n3y b4 N1/N2=1.06 0 0.4 0.8 n3z -0.8 -0.4 0 0.4 0.8 n3y b3 N1/N2=1.54 0 0.4 0.8 n3z -0.8 -0.4 0 0.4 0.8 n3y b2 N1/N2=3.43 0 0.4 0.8 n3z -0.8 -0.4 0 0.4 0.8 n3y b1 N1/N2=0.58 0 0.4 0.8 n3z -0.8 -0.4 0 0.4 0.8 n3y c2 N1/N2=3 0 0.4 0.8 n3z -0.8 -0.4 0 0.4 0.8 n3y 0 0.4 0.8 n3z -0.8 -0.4 0 0.4 0.8 n3y c1 N1/N2=0.55 0 0.4 0.8 n3z
N1
N2
N2
(a) -15 -10 -5 0 5 10 15 Ygsm, Re 0 -5 -10 -15 -20 -25 -30 -35 X, Re469 points (absent solar plasma, points with dT>400 sec and mistake points > -10 Re, mva: N>15 and L23>4)
a1 a2 a3 a4 b1 b2 b3 b4 c1 c2 (b)
Fig. 7. Distribution of the MVA normals in the YZ plane in the current-sheet related coordinate system. Data are shown separately in
different R-Y bins (a) according to the scheme shown in part (b). The ratio of crossings with the normals within the ±45◦cone around the
nominal CS sheet normal (N1) and of remaining crossings (N2) is shown to characterise quantitatively the spread of the normals around the
n=1 circle.
From 51 sequences available, the analysis was done for 26 sequences in which the correlation coefficient between dBx/dtand −Vzat a 12-s time resolution was >0.30.
Another usage of the dBx/dt and Vz correlation is to
obtain the estimate of the average apparent vertical sheet half-thickness H from the regression slope a (from linear fit dBx/dt = −aVz+b) and the lobe field BL; this gives us
H =BL/a (Sergeev et al., 1998). The corresponding statistic
V. A. Sergeev et al.: Survey of flapping motions in the midtail 2021 16:50:00 16:55:00 17:00:00 0 6371 12742 Z,km -200 -100 0 100 200 Vz km/s -2 -1 0 1 2 3 dBx/dt, nT/sec -40 -20 0 20 40 Bx , n T -300 -200 -100 0 100 V x , k m/s 0.1 0.2 0.3 0.4 0.5 De n, cm -3 4 5 6 7 8 9 T, keV 990518 GEOTAIL
A
Fig. 8. Example of a sequence of fast current sheet crossings
(flap-ping wave) observed by Geotail on 18 May 1999 at [–16.3; 9.0; 4.5] Re GSM.
The typical amplitude according to this statistic is about 1–2 Re, and the sheet thickness is about one Re. The ratio A/H has a median value of about 1, which implies that the average current sheet thicknesses and amplitudes of its verti-cal motion are comparable. These values are consistent with previous Cluster analyses made at ∼18 Re distance (Runov et al., 2005).
3.3 Activity dependence
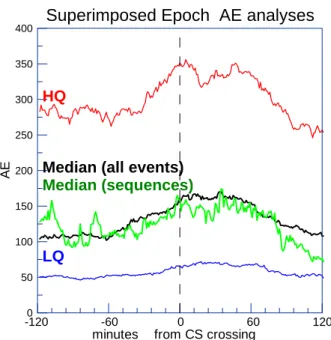
A large data base of crossings allows us to investigate sta-tistically the relationship of flapping motions with the mag-netic activity. Using the preliminary AE index available at 1-min resolution (http://swdcwww.kugi.kyoto-u.ac.jp/aedir/ index.html), we performed a superimposed epoch analysis of AE behavior during the time interval ±2 h from the time of the fast crossing, for ∼1100 crossing events in 1997–1999. There are two main lessons from the results shown in Fig. 10. First, many flapping events occur during rather low mag-netic activity. For example, the median AE values are modest (∼150 nT) and for a quarter of all events there is no signif-icant magnetic activity at all (low quartile is about 50 nT). The second lesson is that, independent of the activity level, the flapping motions tend to occur at the AE increase phase near the AE maximum, which is usually associated with the substorm expansion phase. Separate analyses made for the
0 0.8 1.6 2.4 3.2 4 4.8 A, Re 0.04 0.08 0.12 0.15 0.19 Occu rr ence fr equency 0 0.8 1.6 2.4 3.2 4 H, Re 0.04 0.08 0.12 0.15 0.19 0.23 0.27 0.31 0 0.8 1.6 2.4 3.2 4 A / H 0.04 0.08 0.12 0.15 0.19 0.23 0.27 0.31 Occurrence frequency
Fig. 9. Distributions of maximal amplitude of the vertical sheet
motion and of its apparent thickness, as well as of their ratio in 26 sequences of flapping motions.
subset of events which form the sequences (discussed in pre-vious section) do not show any differences from this general behavior.
4 Discussion
Our survey of occurrence and properties of fast current sheet crossings (flapping motions) between 10 to 30 Re in the mag-netotail confirmed many results previously obtained by the Cluster system at r ∼18 Re. It concerns such important prop-erties of crossings as the common occurrence of large tilts of the current sheet, and the special orientation of the CS nor-mals (distributed over the circle of n2y+n2z=1; see statistics presented in Sergeev et al., 2004 and Runov et al., 2005). Using the additional possibilities of the four-spacecraft ob-servations, these Cluster studies demonstrated that the cur-rent sheet surface often display a wavy pattern in subsequent up/down crossings (during sequences similar to those shown in Fig. 8), with alternating tilts of the electric current and re-lated rotations of the CS normal. In rare conjunctions of ra-dially separated Cluster and Double Star spacecraft the syn-chronous Bx-oscillatory patterns were reported (Zhang et al.,
2005). All this is consistent with a particular “YZ kink”-like mode (see diagram in Fig. 11), which is the most frequent mode of the flapping motions. Our survey of tilt distributions in Fig. 7 expand this conclusion to show that similar proper-ties are observed all along (10–30 Re) and across the midtail.
2022 V. A. Sergeev et al.: Survey of flapping motions in the midtail
minutes from CS crossing
0 50 100 150 200 250 300 350 400 A E -120 -60 0 60 120
Superimposed Epoch AE analyses
HQ
Median (all events) Median (sequences)
LQ
Fig. 10. Superposed epoch analysis of AE-index data with respect
to the time of observation of fast CS crossing.
Other average crossing characteristics evaluated in our study (typical crossing duration of the order of ∼1 min, wave am-plitudes of ∼1 Re and CS half thickness about a fraction of 1 Re) are also similar to those found in Cluster-based surveys (Runov et al., 2005). These major flapping mode characteris-tics, therefore, do not show considerable changes in the mid-tail.
Our survey also provides a number of new results. First, the flapping motions are notably more frequent in the central part of the tail than near the flanks (Fig. 5). This is consistent with the source of the flapping motions localized in the tail center, as schematically shown in Fig. 11. That conclusion was previously suggested by the Cluster observation, that in the near-flank tail regions the motions of flapping waves are predominantly from the center to the flanks (Sergeev et al., 2004), as also shown by the arrows in Fig. 11. Both results match each other and confirm an internal origin of the flap-ping motions, due to some processes localized deep inside of the magnetotail.
The second new result is a strong radial dependence of the flapping occurrence, which, together with a strong de-pendence of crossing duration on the local flow amplitude (Fig. 6), suggests a hint for the possible source process. The similarity of occurrence patterns in Fig. 5 suggests that either the fast plasma sheet flows (BBFs) are directly related to the generation of flapping motions, or that both phenomena are caused by the same parent process. However, a considerable number of crossings have very weak local flows (see, e.g. second half of crossings in Fig. 8 and statistics in Fig. 5). Therefore, if the BBFs are the process which launches the flapping wave – this wave has to be observed (propagate?)
9
Figure 10. Scheme showing predicted distributions of MVA normals in YZ plane for two different types of surface (neutral sheet) waves.
distributions in Fig. 6 expand this conclusion to show that similar properties are observed all along (10-30 Re) and across the midtail. Other average crossing characteristics evaluated in our study (typical crossing duration of the order of ~1min, wave amplitudes of ~1Re and CS halfthickness about a fraction of 1Re) are also similar to those found in Cluster-based surveys (Runov et al., 2005). These major flapping mode characteristics, therefore, do not show considerable changes in the midtail.
Our survey also provides a number of new results. First is that the occurrence of flapping motions is notably more frequent in the central part of the tail than near the flanks (Fig.5). This is consistent with the major source of the flapping motions operating in the tail center, as schematically shown in Fig.10. That conclusion was previously suggested by the Cluster observation that in the near-flank tail regions the motions of flapping waves are predominantly fron center to the flanks (Sergeev et al., 2004), as also shown by arrows in Fig.10. Both results confirm consistenly an internal origin of the flapping motions, due to some processes initiated deep inside of the magnetotail.
Z Y X n3z n3y n3y n3z
MVA normals
‘YZ kink’ ‘XZ kink’Fig. 11. Scheme showing predicted distributions of MVA normals
in the YZ plane for “YZ-kink” type of surface (neutral sheet) waves.
outside of the fast flow stream, or (more probable in our view) both BBFs and the flapping wave could be created by the same parent process, which is the magnetic reconnection. Following Sch¨odel et al. (2001) results we have to emphasize that the sharp decrease in the BBF occurrence with decreas-ing distance in the midtail does not mean that the flux tube transport is similarly damped, but only that it proceeds with lower velocity (being compensated by the compression of the tubes, so V ×Bz is nearly conserved). Therefore, the similar-ity of BBF and the flapping occurrence implies that either the large speed of the earthward moving plasma, or the prox-imity to the reconnection region are important conditions to provide the flapping perturbations.
Our statistical result on the preferable occurrence of flap-ping motions during the AE-index growth (substorm expan-sion phase) is consistent with previous case studies showing the association of fast crossings with substorm events or dis-turbed periods (e.g. Toyichi and Miyazaki, 1976; Bauer et al., 1995; Sergeev et al., 1998; etc.), which are also charac-terized by enhanced magnetic reconnection and BBF activity (Angelopoulos et al., 1994; Nagai et al., 1998; Baumjohann et al., 1999). Observation of some fraction of crossings dur-ing very quiet (AE) periods does not contradict this associa-tion, since both localized isolated fast streams and magnetic reconnection events are also known to appear under magneti-cally quiet conditions (Baumjohann et al., 1990; Angelopou-los et al., 1994; Nagai et al., 1998).
As concerns the generation mechanisms, one should first consider the direct mechanism of MHD-type CS deforma-tion during magnetic reconnecdeforma-tion. It was suggested that in sheared magnetic configurations (with nonzero By in the
neutral sheet) the interaction of reconnected flux tubes with the sheet is asymmetric and this causes the up-down sheet motions on the flanks of the localized (in Y) reconnection region (Semenov et al., 1994; Shirataka et al., 2006). Predic-tions of this mechanism regarding the generation of flapping waves are not yet sufficiently explored, but this seems to be the first potential candidate, most directly linked to the gen-eration of the BBFs. A number of other mechanisms were also discussed for kink perturbations, including drift- (e.g.
V. A. Sergeev et al.: Survey of flapping motions in the midtail 2023 Karimabadi et al., 2003) or Kelvin-Helmholtz- (e.g.
Naka-gawa and Nishida, 1989) instabilities, or a kind of standing mode in the (neutral) current sheet (Fruit et al., 2002a,b). One crucial test is the propagation velocity, which is pre-dicted to be slow and duskward in the case of instabilities. The latter feature conflicts with the flankward propagation direction of the flapping waves, if such propagation is not due merely to the plasma convection (this can be reserved as a possibility which should be further explored). Regard-ing the propagation effects, the balloonRegard-ing-like mode in the curved current sheet magnetic field was claimed to be able to propagate azimuthally in flankward directions from the source (Golovchanskaya and Maltsev, 2004). Excitation of nonlinear kink-like waves, with phase velocity an order of magnitude less than the thermal ion speed, was reported in numerical kinetic simulations of initially very thin current sheets (Karimabadi et al., 2003) and of bifurcated sheets with realistic thickness (Sitnov et al., 2004), which give the pertur-bation shape and scales similar to some of observed events. More work has to be done to clarify all of these issues.
Acknowledgements. The preliminary AE index data were made
available at Kyoto WDC-C data base and Geotail data are avail-able at DARTS website. We thank N. Dmitrieva and S. Dubya-gin for their help in data analysis and discussions. We also thank L. Zelenyi, A. Petrukovich and M. Sitnov for fruitful discussions. VAS and SVA thanks Austrian Academy of Science for the sup-port during their stays in Graz. This work was supsup-ported by IN-TAS grant 03-51-3738, RFBR grant 03-05-20012, WTZA Austria-Russia grant N I.1/04 as well as Austria-Russian Ministry of science grant 15392.
Topical Editor I. A. Daglis thanks two referees for their help in evaluating this paper.
References
Angelopoulos, V., Kennel, C. F., Coroniti, F. V., et al.: Statistical characteristics of bursty bulk flow events. J. Geophys. Res., 99, 21 257–21 280, 1994.
Bauer, T. M., Baumjohann, W. and Treumann, R. A.: Neutral sheet oscillations at substorm onset, J. Geophys. Res., 100, 23 737– 23 742, 1995.
Baumjohann, W., Paschmann,G., and L¨uhr, H.: Characteristics of high-speed ion flows in the plasma sheet. J. Geophys. Res., 95, 3801–3810, 1990.
Chanteur, G.: Spatial interpolation for four spacecraft:
The-ory, in Analysis Methods for Multi-Spacecraft Data, edited by: Paschmann, G. and Daly, P., ESA, Noordwijk, 349–369, 1998. Fairfield, D. H., Hones Jr, E. W., and Meng, C.-I.: Multiple crossing
of a very thin plasma sheet in the Earth’s magnetotail, J. Geo-phys. Res., 86, 11 189–11 200, 1981.
Fruit, G., Louarn, P., Tur, A., and Le Qu´eau, D.: Propagation of MHD perturbations in a Harris current sheet. 1- discrete modes, J. Geophys. Res., 107, 1411, doi:10.1029/2001JA009212, 2002a. Fruit, G., Louarn, P., Tur, A. and Le Qu´eau, D.: Propagation of MHD perturbations in a Harris current sheet. 2 – continuous
spectrum and resonant absorption, J. Geophys. Res., 107, 1412, doi:10.1029/2001JA009215, 2002b.
Golovchanskaya, I. V. and Maltsev, Yu. P.: On the identification of plasma sheet flapping waves observed by Cluster, Geophys. Res. Lett., 32, L02102, doi:10.1029/2004GL021552, 2004.
Halland, S. E., Sonnerup, B., Dunlop, M. W., Balogh,
A.,Georgescu, E., et al.: Four-spacecraft determination of mag-netopause orientation, motion and thickness: comparison with results from single-spacecraft methods, Ann. Geophys., 22, 1347–1365, 2004.
Karimabadi, H., Pritchett, P. L., Daughton, W., and
Krauss-Varban, D.: Ion-ion kink instability in the magnetotail: 2
Three-dimensional full particle and hybrid simulations and comparison with observations, J. Geophys. Res., 108, 1401, doi:10.1029/2003JA010109, 2003.
Knetter T., Neubauer, F. M., Horbury, T., and Balogh, A.: Four-point discontinuity observations using Cluster magnetic field
data: A statistical survey, J.Geophys. Res., 109, A061-2,
doi:10.1029/2003JA010099, 2004.
Lui, A. T. Y, Meng, C.-I., and Akasofu, S.-I.: Wavy nature of the magnetotail neutral sheet, Geophys. Res. Lett., 5, 279–282, 1978.
McComas, D. J., Russel, C. T., Elphic, R. C., and Bame, S. J.: The near-Earth cross-tail current sheet: Detailed ISEE 1 and 2 case studies, J. Geophys. Res., 91, 4287–4301, 1986.
Nagai, T., Fujimoto, M., Saito, Y., et al : Structure and dynamics of magnetic reconnection for substorm onsets with Geotail obser-vations, J. Geophys. Res., 103, A3, 4419–4440, 1998.
Nakagawa, T. and Nishida, A.: Southward magnetic field in the neu-tral sheet produced by wavy motions in the dawn-dusk direction, Geophys. Res. Lett., 11, 1265–1268, 1989.
Runov, A., Sergeev, V. A., Baumjohann, W., Nakamura, R., Ap-atenkov, S., et al : Electric current and magnetic field geometry in flapping magnetotail current sheets, Ann. Geophys, 23, 1391– 1403, 2005.
Sch¨odel, R., Baumjohann, W., Nakamura,R., Sergeev, V. A., and Mukai, T.: Rapid flux transfer in the central plasma sheet, J. Geo-phys. Res., 106, 301–313, 2001.
Semenov, V. S., Farrugia, C. J., Biernat, H. K., et al.: Reconnection-associated surface waves at the magnetopause, Geophys. Res. Lett., 21, 2437–2440, 1994.
Sergeev, V., Angelopulous, V., Carlson, C., and Sutcliffe, P.: Cur-rent sheet measurements within a flapping plasma sheet, J. Geo-phys. Res, 103, 9177–9188, 1998.
Sergeev, V., Runov, A., Baumjohann, W., Nakamura, R.,
Zhang, T. L., et al: Orientation and propagation of
cur-rent sheet oscillations, Geophys. Res. Lett., 31, L05 807, doi:10.1029/2003GL019 346, 2004.
Shirataka, N., Fujimoto, M., Hasegawa, H., and TanDokoro, R.: Re-producing the bi-polar magnetic signature at the jet leading edge by three-dimensional reconnection with non-zero guide field, J. Geophys. Res., 111, A07201, doi:10.1029/2005JA011521, 2006. Sitnov, M. I., Swisdak, M., Drake, J. F., Guzdar, P. N.,
and Rogers, B. N.: A model of the bifurcated current
sheet: 2. Flapping motion, Geophys. Res. Lett., 31, L09 805, doi:10.1029/2004GL019 473, 2004.
Sonnerup, B. U. and Schneible, M.: Minimum and maximum variance analysis, Analysis Methods for Multi-Spacecraft Data, edited by: Paschmann, G. and Daly, P., ISSI Scientific Report
2024 V. A. Sergeev et al.: Survey of flapping motions in the midtail SR-001, ISSI/ESA, 185–220, 1998.
Speiser, T. W. and Ness, N. F.: The neutral sheet in the geomagnetic tail: Its motion, equivalent currents, and field line reconnection through it, J. Geophys. Res., 72, 131–141, 1967.
Toyichi, T. and Miyazaki, T.: Flapping motions of the tail plasma sheet induced by the interplanetary magnetic field variations, Planet. Space Sci., 24, 147–156, 1976.
Tsyganenko, N. A. and Fairfield, D. H. : Global shape of the mag-netotail current sheet as derived from Geotail and Polar data, J. Geophys. Res., 109, A03218, doi:10.1029/2003JA010062, 2004. Volwerk, M., Glassmeier, K.-H., Runov, A., Nakamura, R.,
Baumjohann, W., et al. : Flow burst induced large scale
plasma sheet oscillation, J. Geophys. Res., 109, A11208, doi:10.1029/2004JA010533, 2004.
Volwerk, M., Glassmeier, K.-H., Runov, A., Baumjohann, W., Nakamura, R., et al.: Kink mode oscillation of the current sheet, Geophys. Res. Lett., 30, 1320, doi:10.1029/2002GL016467, 2003.
Zhang, T. I., Baumjohann, W., Nakamura, R., Balogh,
A., and Glassmeier, K.-H. : A wavy twisted neutral
sheet observed by Cluster, Geophys. Res. Lett., 29, 1899, doi:10.1029/2002GL015544, 2002.
Zhang, T. L. , Nakamura, R., Volwerk, M., Runov, A., Baumjohann, W., et al.: Double Star/Cluster observation of neutral sheet oscil-lations on August 5, 2004, Ann. Geophys., 2909–2914, 2005.