HAL Id: hal-02351943
https://hal.archives-ouvertes.fr/hal-02351943
Submitted on 1 Dec 2020HAL is a multi-disciplinary open access archive for the deposit and dissemination of sci-entific research documents, whether they are pub-lished or not. The documents may come from teaching and research institutions in France or abroad, or from public or private research centers.
L’archive ouverte pluridisciplinaire HAL, est destinée au dépôt et à la diffusion de documents scientifiques de niveau recherche, publiés ou non, émanant des établissements d’enseignement et de recherche français ou étrangers, des laboratoires publics ou privés.
Structural modifications of calcium based catalysts by
non-thermal plasma in the CO2 reforming of CH4 and
the influence of water
Nassim Bouchoul, Elodie Fourré, Jean-Michel Tatibouet, Alysson Duarte,
Nathalie Tanchoux, Catherine Batiot-Dupeyrat
To cite this version:
Nassim Bouchoul, Elodie Fourré, Jean-Michel Tatibouet, Alysson Duarte, Nathalie Tanchoux, et al.. Structural modifications of calcium based catalysts by non-thermal plasma in the CO2 reforming of CH4 and the influence of water. Journal of CO2 Utilization, Elsevier, 2020, �10.1016/j.jcou.2019.09.006�. �hal-02351943�
1
Structural modifications of calcium based catalysts by non-thermal plasma in
the CO2 reforming of CH4 and the influence of water
Nassim Bouchoul1, Elodie Fourré1, Jean-Michel Tatibouët1, Alysson Duarte2, Nathalie Tanchoux2, Catherine Batiot-Dupeyrat1*
1IC2MP, ENSIP, Université de Poitiers - UMR CNRS 7285 1 rue Marcel Doré, TSA 41105, 86073 Poitiers cedex 9 (France)
2 ICGM-MACS, UMR 5253, ENSCM, 8 rue de l’Ecole Normale, 34296 Montpellier cedex 5
*E-mail : catherine.batiot.dupeyrat@univ-poitiers.fr
Abstract
Calcium oxide, calcium hydroxide and calcium carbonate were tested for the CO2/CH4 reaction
in a dielectric barrier discharge plasma reactor under humid conditions. It appeared that the presence of water in the gas stream enhanced slightly the selectivity to CO and H2 syngas on
each support (2 to 5 %), contrary to the selectivities to CxHy that decreased (0.5 to 2 %). The water showed little effect on oxygenates selectivities (in the order of 0.1%) compared to dry treatment. The three materials were characterized by thermogravimetric analysis and infrared spectroscopy prior and after, dry and humid, plasma treatments. Addition of humidity in the plasma gas stream led to the formation of calcium hydroxide on the surface of CaO and enhanced the carbonation of Ca(OH)2. We showed that the carbonation of Ca(OH)2, H2O
proceeded through simultaneous CO2 capture and H2O release, highlighting an oscillating
2
Introduction
Valorization of CO2 is a major subject of investigation since decades and is of upper importance
nowadays, especially after the alarming reports issued from the COP24. The simultaneous conversion of carbon dioxide and methane is an important topic since it allows the valorization of those two greenhouse gases into syngas, a feedstock for methanol synthesis and for light hydrocarbons production via Fischer Tropsch reaction [1]. The conventional catalytic method for CH4 reforming is performed at elevated temperature since the reaction is highly endothermic
(H°= 247 kJ.mol-1) [2]. The high energy consumption associated with the catalyst deactivation
due to carbon deposition, make the process little attractive for industrial application [3]. The concomitant activation of methane and carbon dioxide under plasma discharge has been the subject of many publications, using several types of plasma (dielectric barrier discharges: DBD, microwave: MW and gliding arc: GA) and different experimental conditions (reactant flow, ratio CH4/CO2, dilution by rare gases etc.) [4-6]. However, the reported studies showed
that the selectivity towards targeted products was often difficult to achieve due to the occurrence of a large number of reactions in the gaseous phase under plasma discharge [7].
Non-thermal plasma combined with a catalytic material has been widely investigated over the years for CO2/CH4 reaction [8, 9]. From the published data and different effects reported, it
appeared that non thermal plasma induces modification of the catalytic substrate, but very few deep analysis of the catalysts modification under plasma discharge has (ever) been made and further investigations are essential to fully understand this process. In fact, by coupling a catalyst with a plasma, the reactants conversion could be increased in some cases [10], but as indicated by J.C. Whitehead, the interaction between the plasma and the catalyst was difficult to understand [11]. Tu et al. [12] showed that the use of Ni/Al2O3 catalyst (exhibiting high
efficiency in classical catalytic process) limited the reactant conversion when coupling with plasma due to the modification of the plasma discharge at the surface of conductive Ni species.
3 When nonthermal plasma was combined with La2O3 deposited over alumina balls, the CO2
conversion was significantly increased while CH4 conversion was not modified as soon as the
reaction was performed at 400°C [13]. The selectivity to CO was improved in the presence of the catalyst and the formation of surface oxycarbonate species was identified. From these results, new studies on the use of oxides, in particular those prone to carbonation, are of particular importance. Not only the carbonation step could favor the activation of CO2 but also
it could be a way to trap CO2 in flue gas.
Calcium oxide, CaO, is a well-known sorbent and was largely used for CO2 capture at high
temperature [14]. Moreover, it was shown that the addition of steam in carbonation procedure increases significantly the performances for CO2 capture [15]. In this study, the influence of
calcium based oxides for CH4 and CO2 transformation was investigated, with a strong focus on
catalyst structural modifications under plasma discharge, in the presence (or not) of water.
1. Experimental part
The coaxial dielectric barrier discharges (DBD) reactor, represented in figure 1, is described in previous work [16]. The reaction was carried out at room temperature and atmospheric pressure. A total flow rate of 40 mL.min-1 was set, consisting in 75 % helium and 25 % CH
4/ CO2. The
mixture of methane and carbon dioxide was fixed at a ratio CH4/CO2= 2, the reactants being
diluted with helium in order to favor the reactivity under plasma discharge [17]. The calcium oxides (ACROS supplier) were sieved between 355 and 650µm and introduced into the reactor in order to completely fill the plasma zone. A catalyst Ca(OH)2+H2O (18wt%) was also
prepared by adding liquid water to the powder Ca(OH)2. The residence times in the reactor were
1.8 s without catalyst and 1.6 s in the presence of a catalyst. The water phase was introduced into the feed at a rate of 0.1g.h-1 (which corresponds to about 5 vol %).
4 The calcination of CaO material at 800°C was achieved under a dry air flow at a rate of 10°C.min-1, during 2 hours. The sample was cooled down to ambient with dry air. Before and
after plasma treatment, the sample was in contact to ambient air and surface modification due to exposure to ambient air is taken into account in the results.
A function generator (TG1010A Aim-TTi, Thurlby Thandar Instruments Brand) was connected to an amplifier (Trek, 20/20) to generate a sinusoidal signal between the electrodes. The discharge power was set at 8W (constant frequency of 800 Hz and voltage of 13.5 kV) and was calculated from the Manley method, a well-known procedure based on the analysis of Lissajous graphs [18]. Two high voltage probes (PMK, model PHV4-2757) connected to an oscilloscope (waveRunner 62 Xi, Lecroy) were used to measure the signals.
Characterizations of the oxides were performed before and after the plasma treatment. It consisted in BET analysis (Micromeritics Flowsorb II 2300 equipment at -196°C) for surface area calculations and thermogravimetric analysis (SDTQ600TA analyzer under a 100mL/min flow of air up to 1173K). The diffraction patterns (Siemens D-5005 X-Ray diffractometer with CuK=1.5417Å, operating at 40kV and 30mA) were recorded in the 2 range of 10-90° with a step interval of 0.02° and period of 1s.
Infrared spectra were collected for the solid samples before and after plasma treatment on a Perkin Elmer FT-IR (Spectrum One) operating in the range 4000-650 cm-1. The spectra were
normalized for comparison.
The reaction was carried out for one hour and gases were analyzed by on-line gas chromatography, detailed in [19]. A margin error of ±3% was evaluated from 3 successive experiments, in between which the electrode was cleaned and catalyst changed.
Yields, conversion and selectivities was calculated from:
𝑐𝑜𝑛𝑣𝑒𝑟𝑠𝑖𝑜𝑛 𝑋 (%) = 100 ×𝑚𝑜𝑙𝑒 𝑋 𝑐𝑜𝑛𝑣𝑒𝑟𝑡𝑒𝑑 𝑚𝑜𝑙𝑒 𝑋 𝑖𝑛 𝑓𝑒𝑒𝑑 Where X is CH4 or CO2
5 𝑆𝑒𝑙𝑒𝑐𝑡𝑖𝑣𝑖𝑡𝑦 𝐶𝑛𝐻𝑦 (%) = 100 × 𝑛 × 𝑚𝑜𝑙𝑒 𝐶𝑛𝐻𝑦 (𝑚𝑜𝑙𝑒 𝐶𝐻4+ 𝑚𝑜𝑙𝑒 𝐶𝑂2)𝑐𝑜𝑛𝑣𝑒𝑟𝑡𝑒𝑑 𝑆𝑒𝑙𝑒𝑐𝑡𝑖𝑣𝑖𝑡𝑦 𝐶𝑂 (%) = 100 × 𝑚𝑜𝑙𝑒 𝐶𝑂 (𝑚𝑜𝑙𝑒 𝐶𝐻4+ 𝑚𝑜𝑙𝑒 𝐶𝑂2)𝑐𝑜𝑛𝑣𝑒𝑟𝑡𝑒𝑑 𝑌𝑖𝑒𝑙𝑑 𝐻2 (%) = 100 × 𝑚𝑜𝑙𝑒 𝐻2 2 × (𝑚𝑜𝑙𝑒 𝐶𝐻4) 𝑖𝑛𝑡𝑟𝑜𝑑𝑢𝑐𝑒𝑑 𝐶𝑎𝑟𝑏𝑜𝑛 𝑏𝑎𝑙𝑎𝑛𝑐𝑒 (%) = 100 × 𝑚𝑜𝑙𝑒 𝐶𝑂 + ∑(𝑛 × 𝑚𝑜𝑙𝑒 𝐶𝑛𝐻𝑦) (𝑚𝑜𝑙𝑒 𝐶𝐻4+ 𝑚𝑜𝑙𝑒 𝐶𝑂2)𝑐𝑜𝑛𝑣𝑒𝑟𝑡𝑒𝑑
2. Results and discussion
2.1.CH4 and CO2 transformation on calcium oxide with and without water addition
In a first time, experiments were conducted using CaO, calcined at 800°C in order to remove as much as possible carbonate species. The introduction of water leads to a slight increase of methane conversion while CO2 conversion is not modified by the presence of water whatever
the temperature: 100, 200 or 300°C (Fig.2). The yield of CO is increased significantly in the presence of water and the carbon balance is also improved. The formation of hydrocarbons is favored under the experimental conditions used (excess of methane) and the presence of methyl radicals generated under plasma discharge leads to the production of ethane, ethylene and propane, ethane being the main product formed (approximately 90% of hydrocarbons quantity). The carbon balance is always lower than 100% particularly at the highest temperature since the formation of ethylene (a precursor of coke) is favored at high temperature. Moreover the formation of heavy products, in an excess of methane is also probable [13]. It appears that the presence of water has no significant influence on hydrocarbons and global oxygenates yields (Fig. 3). The production of oxygenates is low whatever the reaction temperature, with and without water. However a small increase of methanol selectivity is observed in the presence of
6 water (Table 2). The other oxygenates quantified were ethanol, acetaldehyde, acetone and formaldehyde. Bogaerts et al. [20] performed chemical kinetics calculations and showed that methanol selectivity can be increased by more than a factor 4 when 32% of water was added in the feed. The differences observed could result from the higher energy density used in our study: 12kJ/L against 3 kJ/L in ref [20]. At this energy density, methanol would readily be decomposed under the plasma discharge as soon as it is formed, by electron impact dissociation. Moreover the reaction of CO2 and water with the solid could also explain the lower methanol selectivity
since part of CO2 and H2O is consumed through hydroxylation and carbonation of CaO (see
TGA analysis below).
From the coefficient R (Fig. 3), corresponding to the ratio between the CO formed (COf) and the CO2 transformed (CO2t), it was possible to estimate if CO comes only from direct CO2
dissociation or from both methane partial oxidation and CO2 splitting. The results show that, at
100°C, the ratio is always higher than unity proving that CO is formed by the two reactions. Moreover, the presence of water leads to a R value close to 2, which is higher than without water (Rmax=1.5) suggesting the formation of CO through methane water reforming (CH4 +
H2O → CO+H2) which is corroborated by the increased methane conversion with water. The
molar ratio H2/CO is far from unity which indicates that hydrogen from methane is mainly
converted into H2O whatever the reaction temperature and even when water is introduced into
the gas feeds.
2.2.TGA analysis of CaO
The thermogravimetric analysis performed after one hour of reaction under plasma at 100, 200 and 300°C are shown in Fig. 4. Two weight losses between 400-450°C and 600-760°C are attributed to the decomposition of Ca(OH)2 to CaO [21] and the decomposition of CaCO3 to
7 corresponds to water elimination (m/z=18) and the second one to CO2 elimination (peak
corresponding to m/z = 44). Note that before reaction, TGA analysis of CaO exhibited a weight loss at high temperature showing that the carbonation of CaO had proceeded by atmospheric CO2 after calcination under air at 800°C (Fig. 4a). The amount of CaCO3 in the starting material
was estimated at 2.4wt%. After reaction without water, no significant differences were observed in the TGA profile suggesting that no structural modifications of the material had occurred. As soon as water was added in the gas feed, the weight loss of 6.2% at 400-450°C showed that Ca(OH)2 was formed under plasma discharge and the carbonation was not favored. At 200°C,
the hydroxylation of CaO was very small in the presence of water in the feed while it proceeded readily without water. At this temperature, the carbonation of CaO is not favored, while at 300°C a weight loss of 7.5 wt% is obtained without water and corresponds to 8.7wt% with water. It is known that high temperature favors CO2 sorption [22], but it was also reported that
water vapor has a positive effect for CaO carbonation in the temperature range of 250-400°C due the occurrence of a two-step route when H2O vapor is used: CaO →Ca(OH)2 → CaCO3.
Under non-thermal plasma it appears that the addition of water into the feed does not improve significantly the carbonation process at 300°C.
2.3.CH4 and CO2 transformation on calcium based oxides with and without water addition
In a second time, it was interesting to investigate the influence of different starting materials such as CaCO3 and Ca(OH)2 and evaluate the impact of surface carbonate on the efficiency and
selectivity of the reaction. Experiments were performed at room temperature and at 100°C in presence of water in order to avoid its condensation at the surface of the solid. The experiments at 100°C without water showed no difference in terms of conversions or selectivity compared to room temperature ones. Theresults, gathered in Table 1, show that CO2 and CH4 conversions
8 of water, as observed on CaO. The different oxides have no or little effect on the syngas production, which is however favored in the presence of water. Higher yields of CO and H2 are
obtained, while hydrocarbons (mainly ethane) yield decreased with water.
The yield of oxygenates products is relatively low independently of the material, methanol and formaldehyde are the two main oxygenated products formed (Table 2). Besides methanol and formaldehyde, ethanol, acetaldehyde and acetone were also quantified but low selectivities were obtained.
The selectivity to formaldehyde is higher using CaCO3, Ca(OH)2 and Ca(OH)2+H2O than in
the presence of CaO. It was proposed by some authors that formaldehyde is formed under plasma from CO2 and CH2 radicals [23], which generation is favored in presence of carbonate
on the material surface. As shown below (TGA analysis), Ca(OH)2 and Ca(OH)2+H2O are
carbonated under plasma discharge, so the involvement of carbonate species from the surface of catalyst could be proposed in the reaction mechanism, however only to a small extent. The addition of water into the feed increases significantly the selectivity to methanol regardless the nature of the material, consequently it seems that the reaction occurs mainly in gaseous phase, through water activation according to the following [24]:
CH4 + He* → CH3 + H + He
H2O + e- → OH + H
CH3 + OH →CH3OH
Additionally, the reaction was performed during 2 hours over the material Ca(OH)2+H2O at
room temperature (Fig. 5). Carbon dioxide was completely converted during the first minutes of reaction due to carbonation (described below), the yield of CO was stabilized at around 13% after 20 minutes. The carbon balance did not reach 100% and the catalyst took a yellowish color after 2 hours on stream probably due to the presence of adsorbed organic products. Among the
9 products analyzed by pyrolysis coupled with mass spectrometry, many compounds such as C3 aldehydes and C5 ketones were detected.
2.4. TGA analysis of CaCO3 and Ca(OH)2
The thermogravimetric analysis of CaO, CaCO3, Ca(OH)2 and hydrated Ca(OH)2 were
performed before and after reaction under plasma without and with water (0.1g.h-1) (Fig. 6).
Four weight losses were identified in the temperature range: 50-100, 400-450, 600-660 and 660-760°C, attributed to the desorption of water, decomposition of Ca(OH)2 to CaO and from
600°C to the decomposition of CaCO3 to CaO respectively. The transformation of CaCO3 can
be divided into two different steps, one from 600-660 corresponding to the desorption of weakly linked CO2 (surface and upper layers) and the second one between 660-760°C corresponding
to carbonate in strong interaction with calcium: bulk CaCO3. Note that TGA analysis before
reaction, showed that the presence of carbonate species was also visible for CaO, Ca(OH)2 and
hydrated Ca(OH)2 due to ambient air contamination. After reaction under plasma, the TGA
profile of CaO material is not strongly modified (ambient air contamination) compared to before reaction while as soon as water is introduced with the reactants, the formation of Ca(OH)2 is clearly visible. The hydroxylation of CaO occurs under plasma as soon as water is
introduced in the stream, while the carbonation of CaO is not favored. Starting from calcium carbonate, no significant differences are observed in terms of temperature range and weight loss whatever the experimental conditions used. A weight loss of about 42 wt% is obtained (Table 3), a value closed to the theoretical one associated with the CaCO3 decomposition into
CaO and CO2: 44 wt%. After reaction under plasma, Ca(OH)2 is modified, the material is
partially carbonated and dehydroxylated according to the TGA profile and the values reported in Table 3. The formation of more stable carbonate species occurred under plasma as shown by the removal of carbonate species in the 660-760°C temperature range. The presence of stable
10 CaCO3 is clearly visible when water is introduced in the feed gas, while the amount of Ca(OH)2
is strongly decreased. This result shows that the addition of water in gaseous state favors the carbonation of Ca(OH)2 under the plasma discharge. The better performance of Ca(OH)2
compared to CaO as sorbent for CO2 capture was evidenced under classical carbonation
experimental conditions (temperature around 900K) [25, 26]. Moreover, the carbonation of CaO was over doubled when steam was introduced, which was attributed to the formation of transient Ca(OH)2 [27, 28]. Under non-thermal plasma a different behavior is observable: the
introduction of steam do not favor significantly the carbonation of CaO but the formation of Ca(OH)2 is obtained. Starting from Ca(OH)2, the poor carbonation is confirmed under plasma,
while the addition of steam to the feed strongly enhanced the carbonation of Ca(OH)2. The
addition of water into the solid Ca(OH)2 (18% in wt) improves the carbonation of the material
under plasma, while the addition of steam during the reaction favors the formation of Ca(OH)2
instead of CaCO3. It is suggested that the amount of water is too high to allow the carbonation
of the Ca(OH)2 phase when performing the reaction under water steam. Indeed the carbonation
proceeds rapidly as evidenced in Fig. 5, with water in gas phase CO2 absorption into water is
believed to be favored limiting the carbonation of Ca(OH)2. Note that after reaction under
plasma, all the physisorbed water was removed most probably due to the increase of temperature into the plasma zone estimated at around 110°C (joule effect).
In order to visualize better the modification of the materials under plasma discharge, the results are gathered as bargraphs corresponding to the amount of the respective phases obtained from TGA analysis (Fig. 7). It clearly shows that carbonation is favored starting from Ca(OH)2, in
the presence of water in gaseous phase, proving the beneficial role of hydroxyl group for CO2
absorption under plasma. To better understand the carbonation step under plasma discharge, experiments were performed using Ca(OH)2, H2O under plasma and a flow of CO2, analyzing
11 2.5.Transformation of Ca(OH)2 +H2O under CO2/plasma
The structural modification of Ca(OH)2 +H2O was investigated by analyzing the exit gas using
a mass spectrometer, m/z= 18 and m/z=44 corresponding to water and CO2, respectively. A
flow of carbon dioxide diluted in helium was introduced at room temperature, without plasma, H2O was released during the first ten minutes on stream while carbon dioxide was retained by
the solid (Fig. 8). After ten minutes, CO2 absorption was stopped and the signal corresponding
to m/z=44 remained stable. The slow increase of the water signal seemed to indicate that dehydration proceeded slowly from 10 to 60 minutes.
Carbonation of Ca(OH)2,H2O proceeds at room temperature under the flow of CO2 in helium
due to the presence of water, which favors CO2 ionization to form CO32-, according to [29] :
CO2 + H2O →2H+ + CO3
2-Carbonation proceeds through the following equations: Ca(OH)2 → Ca2+ + 2OH
-Ca2+ + CO32- → CaCO3
From equations above, a complete carbonation is possible as soon as water is introduced at least as stoichiometric amount relative to Ca. The carbonation of Ca(OH)2,H2O was confirmed by
TGA analysis, exhibiting a weight loss in the temperature range 600-750°C. The carbonation is limited, a weight loss of 17.6% related to CO2 elimination being measured (Table in Fig.9).
Under plasma a different behavior was observed (Fig. 8b). Plasma was switched on after 15 minutes, corresponding to a stable CO2 signal. As soon as plasma was switched on, the
concentration of CO2 decreased and an oscillation period occurred from 15 to 35 minutes. The
decrease of CO2 signal indicates that carbonation is favored under plasma discharge. Another
experiment was performed at lower deposited power (P=4W) and the solid was characterized by TGA analysis after each reaction. According to the weight loss measured (Table in Fig.9) it
12 is possible to give the molar composition of the material after reaction, it can be summarized as follow:
Starting material: 0.9Ca(OH)2,0.9H2O,0.1CaCO3
Flow of CO2 (in He), room T, 1 hour ↓
0.6Ca(OH)2,0.6H2O,0.4CaCO3
Flow of CO2 (in He), room T, 1 hour, plasma
P=8W P=4W
0.5Ca(OH)2,0.5CaCO3 0.1Ca(OH)2,0.9CaCO3
It appears clearly that under plasma discharge carbonation of the starting material is improved particularly at low deposited power since 90% of Ca is present as CaCO3 after reaction. It is
believed that at low deposited power, the increase of temperature is limited in the catalyst bed and consequently the water added to Ca(OH)2 favors the carbonation. Meanwhile, at higher
deposited power, the temperature measured at the exit of the reactor is close to 90°C suggesting that it can reach higher values in the catalyst bed, which leads to water evaporation.
Moreover, it is interesting to observe that the signals of CO2 and H2O evolved in opposite phase
during that period: CO2 decrease corresponding to H2O increase. Fig. 8b can be decomposed
into three parts: 1) During the first 15 minutes: CO2 sorption proceeds without water
elimination, 2) between 15 and 35 minutes: CO2 sorption is accompanied by H2O release,
according to a periodic behavior 3) no significant evolution. The reactions involved during the different stages could be:
1) Ca(OH)2,H2O + CO2 → CaHCO3.OH,H2O
2) Ca(OH)2,H2O + CO2 → CaHCO3.OH + H2O and CaHCO3.OH → CaCO3 + H2O
The water elimination could be due to thermal effect under plasma discharge. The periodic variation of CO2 consumption associated to water release could be explained by diffusion
13 Indeed it was proposed that CaCO3 generated at the surface of the material blocked the contact
between the solid and CO2 in gas phase [30]. It appears that the activation of CO2 under plasma
discharge favors the carbonation of Ca(OH)2,H2O, it could be suggested that the active oxygen
species generated in gas phase through CO2 decomposition could be involved in the carbonation
reaction, its diffusion through the CaCO3 layer would facilitate the reaction with Ca2+ leading
to carbonation.
3) No more water is available to favor the carbonation
Note that the decomposition of CaCO3 in Ar plasma due to thermal effect has been evidenced
by Giammaria et al. [31] at low deposited power, however, the experiments were performed at 630°C while in the present study it was at room temperature.
2.6.Infrared analysis
The infrared spectrum of the different calcium based materials are gathered in Fig. 10. As expected, CaO before reaction exhibited small peaks related to a carbonate contamination. In the low region, CO32- out-of-plane-bending-mode ν2 at 870 cm-1 and in-plane bending mode ν4
at 710 cm-1 and in the mid-region, ν3 asymmetric C-O stretch at 1410 cm-1 were identified [32,
33]. A similar spectrum was obtained after reaction under plasma without water, corroborating the TGA since no phase transformation had occurred. After plasma reaction in the presence of humidity, a sharp absorption peak is visible at 3630 cm-1 related to the stretching mode of
Ca(OH)2 hydroxyl group, supported also the results of TGA analysis. The splitting of the band
at 1410 cm-1 generated a band at 1480 cm-1 which was identified as amorphous calcium
carbonate [34]. The band at 1080 cm-1 was related to the ν
1 symmetric C-O stretch of carbonate
and a blurry zone between 2000-2300 cm-1 to the gaseous CO2 [35]. Increasing the temperature
14 (at 200°C and 300°C) and of the band at 3630 cm-1 related to hydroxyde (at 300°C), indicating
a loss of calcium hydroxide, which is in agreement with TGA analysis.
Regarding Ca(OH)2, the plasma treatment led to a decrease of the bands related to carbonate
contamination (1430, 870, 710 cm-1) and this effect was reversed in presence of humidity where
carbonates formation was enhanced. These results are in agreement with TGA analysis where 26.8 wt% are lost under humid conditions against 5.2 wt% under dry conditions. The addition of water on the surface of Ca(OH)2 prior to its treatment under plasma discharge showed evident
bands related to water at 3370 cm-1 and 1640 cm-1 corresponding to O-H stretching and O-H
bending vibrations, respectively. After plasma treatment, with or without humidity in the gas flow, the water bands completely disappeared leaving only bands related to calcium oxide (3640 cm-1) and carbonate (1430, 1080, 870, 710 cm-1). Those results were also completely linked
with TGA ones, where water weight loss was only visible on the untreated sample.
An additional band at 1800 cm-1 completed the characterization of carbonates on the CaCO3
spectrum, corresponding to the ν1 and ν4 symmetric stretching modes of carbonate, which was
also detected on Ca(OH)2 + H2O.
Conclusion
Different calcium based materials, with calibrated grain size, were tested for the transformation of methane and carbon dioxide in a DBD plasma at room temperature, with a constant deposited power fixed at 8 W. This low deposited power excludes the activation of reactants due to thermal effect. It is observed that the conversion of methane and carbon dioxide is not significantly modified whatever the nature of the calcium based material used. The yield of oxygenates products is relatively low independently of the material, but formaldehyde is favored over CaCO3 and Ca(OH)2 , this last material being carbonated under plasma discharge,
15 for HCOH formation could be suggested but only to a small extent. Over CaO, an increase of the reaction temperature from 100°C to 300°C favors slightly the conversion of methane and the hydrocarbon yield. At 100°C, the addition of water into the feed leads to an increase of methane conversion as CO and oxygenates yields due to the involvement of the water reforming reaction and the formation of OH species by H2O activation under plasma.
The respective contribution of pure plasma reaction and surface catalyst reaction induced by plasma is very difficult to establish. However, it is believed that carbonate species formed at the surface of the catalyst can be involved in the formation of formaldehyde but only to a small extent.
The most significant results obtained within the present study is the deep catalyst modification under plasma: the hydroxylation of CaO proceeded as soon as water was added in the gas flow, while the carbonation was favored over Ca(OH)2. An oscillating phenomena was highlighted
under CO2 plasma discharge over Ca(OH)2,H2O resulting in carbonation through simultaneous
CO2 capture and H2O release. Moreover an almost complete carbonation of Ca(OH)2,H2O was
evidenced after one hour exposure to a mixture He/CO2, under a low energetic plasma: P=4W,
exhibiting, for the first time, the potentiality for CO2 capture under plasma.
Acknowledgements
The authors grateful acknowledge the ANR for the financial support of the PRC program VALCO2PLAS and the financial support from the European Union (ERDF) and "Région Nouvelle Aquitaine”
16
References
[1] D.L. Trimm, Catal. Rev. Sci. Eng. 16 (1977) 155-189
[2] S.C. Tsang, J.B. Claridge, M.L.H. Green, Catal. Today, 23 (1995) 3-15 [3] M.C. Bradford, M.A. Vannice, Catal. Rev. – Sci. Eng. 41 (1999) 1-42
[4] A.J. Zhang, A.M. Zhu, J. Guo, Y. Xu, C. Shi Chem. Eng. J. 156 (2010) 601-606
[5] M. Kraus, W. Egli, K. Haffner, B. Eliasson, U. Kogelschatz, A. Wokaun, Phys. Chem. Chem. Phys. 4 (2002) 668-675
[6] X. Tao, M. Bai, X. Li, H. Long, S. Shang, Y. Yin, X. Dai, Progress in Energy and combustion Science 37 (2011) 113-124
[7] B. Eliasson, W. Egli, U. Kogelschatz, Pure Appl. Chem. 66(6) (1994) 1275-1286 [8]E.C. Neyts, K. Ostrikov, M.K. Sunkara, A. Bogaerts, Chem. Rev. 115 (2015) 13408-13446
[9] H. Puliyalil, D. L. Jurkovic, V.D.B.C. Dasireddy, B. Likozar, RSC Adv. 8 (2018) 27481-27507
[10] H.K. Song, J.W. Choi, S.H. Yue, H. Lee, B.K. Na, Catal. Today 89 (2004) 27-33 [11] J.C. Whitehead, J. Phys. D: Appl. Phys. 49 (2016) 243001-243025
[12] X. Tu, H.J. Gallon, M. V. Twigg, P. A. Gorry, J.C. Whitehead, J. Phys. D: Appl. Phys. 44 (2011) 274007-274017
[13] M.H. Pham, V. Goujard, J.M. Tatibouët, C. Batiot-Dupeyrat, Catal. Today, 171 (2011) 67-71
[14] W. Liu, H. An, C. Qin, J. Yin, G. Wang, B. Feng, M. Xu, Energy and fuels, 26 (2012) 2751-2767
[15] A. Ćwika, I. Casanova, K. Rausis, K. Zarębsk, Journal of CO₂ Utilization 32 (2019) 155–162
17 [16] N. Bouchoul, E. Fourré, J.M. Tatibouët, C. Batiot-Dupeyrat, Plasma Chem. Plasma Process., 39 (2019) 713-727
[17] S.L. Brock, M. Marquez, S.L. Suib, Y. Hayashi, H. Matsumoto, J. Catal. 180 (1998) 225–233
[18] T.C. Manley, The Electric Characteristics of the Ozonator Discharge, Trans. Electrochem. Soc. 84 (1943) 83–96
[19] D. Yap, J.M. Tatibouët, C. Batiot-Dupeyrat, Catal. Today, 299 (2018) 263-271
[20] R. Snoeckx, W. Wang, X. Zhang, M. Suk Cha, A. 0, Scientific Reports, 8 (2018) 15929-15936
[21] Z. Mirghiasi, F. Bakhtiari, E. Darezereshki, E. Esmaeilzadeh, J. Ind. Eng. Chem. 20 (2014) 113-117
[22] C. Wang, L. Jia, Y. Tan, E. Anthony, Fuel, 87 (7) (2008) 1108-1114
[23] C. De Bie, J. Van Dijk, A. Bogaerts, J. Phys. Chem. C 119 (2015) 22331-22350 [24] C.J. Liu, G.H. Xu, T. Wang, Fuel process. Technol. 58 (1999) 119-134
[25] S. Lin, Y. Wang, Y. Suzuki, Energy Fuel, 23 (2009) 2855-2861
[26] J. Blamey, V. Manovic, E.J. Anthony, D.R. Dugwell, P.S. Fennell, Fuel 150 (2015) 269-277
[27] R.T. Symonds, D.Y. Lu, R.W. Hughes, E.J. Anthony, A. Macchi, Ind. Eng. Chem. Res. 48 (2009) 8431-8440
[28] B. Dou, Y. Song, Y. Liu, C. Feng, J. Hazard. Mater. 183 (2010) 759-765
[29] N. Koga, K. Tsuru, I. Takahashi, K. Ishikawa, Ceramic Int. 41 (2015) 9482-9487 [30] Z.H. Li, Y. Wang, K. Xu, J.Z. Yang, S.B. Niu, H. Yao, Fuel Process. Tech. 151 (2016) 101-106
[31] G. Giammaria, G. Van Rooij, L. Lefferts, Catalysts, 185 (2019) 9-34
18 [33] G.-B. Cai, S.-F. Chen, L. Liu, J. Jiang, H.-B. Yao, A.-W. Xu and S.-H. Yu, Cryst. Eng. Comm., 12 (2010) 234–241
[34] J. D. Rodriguez-Blanco, S. Shaw and L. G. Benning, Nanoscale 3 (2011) 265-271
[35] M. Khachani, A. El Hamidi, M. Halim, S. Arsalane, J. Mater. Environ. Sci. 5 (2014) 615-624
19 List of Tables: Material Water (0.1g.h-1) Conversion (%) Yield (%) CB (%) CO2 CH4 H2 CO CxHy Oxy. CaO No 11.3 17.5 6.1 11.4 9.4 1.3 75.9 Yes 14.7 21.1 8.3 17.2 8.8 1.7 79.9 CaCO3 No 12.1 16.5 6.2 14.6 6.4 1.6 78.5 Yes 10.4 17.7 7.0 16.3 5.9 1.9 84.7 Ca(OH)2 No 12.5 16.5 5.4 14.7 7.6 1.7 81.0 Yes 13.2 21.0 6.8 15.5 5.3 1.8 86.0 Ca(OH)2+H2O No 12.0 16.3 6.2 13.3 6.6 1.8 80.1 Yes 11.7 18.8 7.5 17.4 5.8 1.9 82.8
Table 1: Influence of the nature of calcium based materialon product yield (average value, reaction time: 30 minutes), grain size: 355-650µm, P=8W, total flow: 40mL/min, He: 75%, ratio CH4/CO2 =2. Reaction temperature: without water: room temperature, in the presence of
water: T=100°C
Material Water (0.1g.h-1)
Selectivity to oxygenates (%)
Methanol Ethanol Acetaldehyde Acetone formaldehyde
CaO No 1.0 0.3 0.3 0.4 1.5 Yes 1.4 0.5 1.1 0.7 1.1 CaCO3 No 0.4 0.4 0.6 0.5 3.5 Yes 1.2 0.5 0.6 0.9 3.5 Ca(OH)2 No 0.3 0.3 0.5 0.6 3.8 Yes 0.9 0.4 0.5 0.8 2.7 Ca(OH)2+H2O No 0.2 0.3 0.7 0.6 4.2 Yes 1.1 0.5 0.3 0.7 3.3
Table 2: Influence of the nature of calcium based materialon selectivity to oxygenates (average value, reaction time: 30 minutes), grain size: 355-650µm, P=8W, total flow: 40mL/min, He: 75%, ratio CH4/CO2 =2. Reaction temperature: without water: room temperature, in the
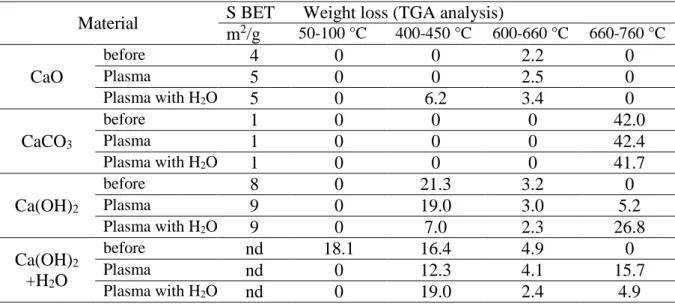
20 Material S BET Weight loss (TGA analysis)
m2/g 50-100 °C 400-450 °C 600-660 °C 660-760 °C CaO before 4 0 0 2.2 0 Plasma 5 0 0 2.5 0 Plasma with H2O 5 0 6.2 3.4 0 CaCO3 before 1 0 0 0 42.0 Plasma 1 0 0 0 42.4 Plasma with H2O 1 0 0 0 41.7 Ca(OH)2 before 8 0 21.3 3.2 0 Plasma 9 0 19.0 3.0 5.2 Plasma with H2O 9 0 7.0 2.3 26.8 Ca(OH)2 +H2O before nd 18.1 16.4 4.9 0 Plasma nd 0 12.3 4.1 15.7 Plasma with H2O nd 0 19.0 2.4 4.9
Table 3: Characterization of the calcium based materials before and after plasma treatment,
surface area, weight loss according to TGA analysis, reaction conditions: grain size: 355-650µm, P=8W, total flow: 40mL/min, He: 75%, ratio CH4/CO2 =2, with water: 0.1g.h-1
21 Figure 1: Reactor scheme
Gap : 1.5 mm HV
Gas in
22 Figure 2: Influence of the presence of water for CH4 and CO2 transformation, at room
temperature, T=100, 200 and 300°C, CaO in the plasma zone, P=8W, total flow: 40mL/min, He: 75%, ratio CH4/CO2 = 2.0; legend: + without water, × with water (0.1 g.h-1)
a) T= 100°C, b) T=200°C, c) T=300°C 0 5 10 15 20 25 30 0 20 40 CH 4 con ve rsion (% ) time (min) 0 5 10 15 20 25 30 0 20 40 CO 2 con ve rsion (% ) time (min) 0 5 10 15 20 25 30 0 20 40 CO yield (% ) time (min) 0 10 20 30 40 50 60 70 80 90 100 0 20 40 C ar bon balan ce ( % ) time (min) 0 5 10 15 20 25 30 0 20 40 CH 4 con ve rsion (% ) time (min) 0 5 10 15 20 25 30 0 20 40 CO 2 con ve rsion (% ) time (min) 0 5 10 15 20 25 30 0 20 40 CO yield (% ) time (min) 0 10 20 30 40 50 60 70 80 90 100 0 20 40 C ar bon balan ce ( % ) time (min) 0 5 10 15 20 25 30 0 20 40 CH 4 con ve rsion (% ) time (min) 0 5 10 15 20 25 30 35 40 45 50 0 20 40 CO 2 con ve rsion (% ) time (min) 0 5 10 15 20 25 30 0 20 40 CO yield (% ) time (min) 0 10 20 30 40 50 60 70 80 90 100 0 20 40 C ar bon balan ce ( % ) time (min) c) ) a) ) b)
23 Figure 3: Influence of the presence of water for CH4 and CO2 transformation into products, at
room temperature, T=100, 200 and 300°C, CaO in the plasma zone, P=8W, total flow: 40mL/min, He: 75%, ratio CH4/CO2 = 2.0; legend: + without water, × with water (0.1 g.h-1)
b) T= 100°C, b) T=200°C, c) T=300°C 0 2 4 6 8 10 12 14 16 18 20 0 20 40 HC yield (% ) time (min) 0 1 2 3 4 5 0 20 40 oxyge n ate s yield (% ) time (min) 0,0 0,5 1,0 1,5 2,0 2,5 0 20 40 R C Of /CO 2 t time (min) 0,0 0,1 0,2 0,3 0,4 0,5 0,6 0,7 0 20 40 H2 /CO time (min) 0 2 4 6 8 10 12 14 16 18 20 0 20 40 HC yield (% ) time (min) 0 1 2 3 4 5 0 20 40 oxyge n ate s yield (% ) time (min) 0,0 0,5 1,0 1,5 2,0 2,5 0 20 40 R C Of /CO 2 t time (min) 0,0 0,1 0,2 0,3 0,4 0,5 0,6 0,7 0 20 40 H2 /CO time (min) 0 2 4 6 8 10 12 14 16 18 20 0 20 40 HC yield (% ) time (min) 0 1 2 3 4 5 0 20 40 oxyge n ate s yield (% ) time (min) 0,0 0,5 1,0 1,5 2,0 2,5 0 20 40 RC Of /CO 2 t time (min) 0,0 0,1 0,2 0,3 0,4 0,5 0,6 0,7 0 20 40 H2 /CO time (min) c) ) a) ) b)
24 Figure 4: TGA-TDA profiles of CaO after reaction under plasma, with and without water (0.1g.h-1) at different temperatures (from 100 to 300°C), grain size: 355-650µm, P=8W, total flow: 40mL/min, He: 75%. CH4/CO2 =2, without water, with water
80 85 90 95 100 0 200 400 600 800 w eigh t (% ) Temperature ( C) before reaction 80 85 90 95 100 0 200 400 600 800 w eigh t (% ) Temperature ( C) m/z= 18 m/z= 44 80 85 90 95 100 0 200 400 600 800 w eigh t (% ) Temperature ( C) Reaction temperature Weight loss (%) 400-450°C 600-760°C 100°C dry 0.1 2.4 water 6.2 3.3 200°C dry 6.1 4.3 water 0.6 3.3 300°C dry 2.1 7.5 water 1.6 8.7
25 Figure 5: Transformation of CH4 and CO2 at room temperature over Ca(OH)2+H2O (18 wt% of
water), grain size: 355-650µm, P=8W, total flow: 40mL/min, He: 75%. CH4/CO2 =2
0 10 20 30 40 50 60 70 80 90 100 0 30 60 90 120 con ve rsion (% ) time (min) 0 5 10 15 20 25 30 35 40 45 50 0 30 60 90 120 CO yield (% ) time (min) 0 10 20 30 40 50 60 70 80 90 100 0 30 60 90 120 Car b on b alan ce (% ) time (min) + CH4 × CO2
26 Figure 6: TGA-TDA profiles of Calcium based material after reaction under plasma, with and without water (0.1g.h-1) grain size: 355-650µm, P=8W, total flow: 40mL/min, He: 75%. CH4/CO2 =2, before plasma, after plasma without water, after plasma
with water, T= room temperature without water, T=100°C with water
CaO CaCO3 Ca(OH)2 Ca(OH)2 + H2O 80 85 90 95 100 0 200 400 600 800 w eig h t (% ) Temperature ( C) 50 60 70 80 90 100 0 200 400 600 800 w eigh t (% ) Temperature ( C) 50 60 70 80 90 100 0 200 400 600 800 w eig h t (% ) Temperature ( C) 50 60 70 80 90 100 0 200 400 600 800 w eigh t (% ) Temperature ( C)
27 Figure 7: Modification of calcium based material under plasma discharge, with and without water in gaseous phase, grain size: 355-650µm,, P=8W, total flow: 40mL/min, He: 75%. CH4/CO2 =2, T= room temperature without water, T=100°C with water
Plasma CH4/CO2
CaO Ca(OH)2 Ca(OH)2, H2O
Plasma CH4/CO2/H2O (5 vol%)
CaO Ca(OH)2 Ca(OH)2, H2O
CaCO3 CaCO3 CaCO3 CaCO3 Ca(OH)2 CaCO3 Ca(OH)2 Ca(OH)2 Ca(OH)2 Ca(OH)2 gain loss
28 Figure 8: Ca(OH)2+H2O, total flow: 40mL/min, flow: CO2/He (75%), mass analysis:
a) without plasma, b) P= 8W -15 -5 5 15 25 35 45 55 time (min) m/z=44 m/z=18 -15 -5 5 15 25 35 45 55 time (min) m/z=44 m/z=18 a) b)
29 Figure 9: TGA analysis before and after plasma, Ca(OH)2+H2O, total flow: 40mL/min, flow:
CO2/He (75%), after one hour on stream ─ starting material, ▬ after exposure to a flow of
CO2 (in He) during 60 min, - - after plasma (P=8W), ▬ after plasma (P=4W)
50 60 70 80 90 100 0 200 400 600 800 w eigh t (% ) Temperature ( C) P (W) Weight loss (%) 30-100 400-450 600-750 0*(no CO2) 17.4 17.2 6.4 0** 11.2 10.6 17.6 8 0 9.2 25.4 4 0 2.3 37.8 * starting material ** after exposure to CO2
30 Figure 10: Infra-Red analysis before and after plasma over CaO, CaCO3, Ca(OH)2 and
Ca(OH)2+H2O, ─ before plasma, ─ after plasma without water, ─ after plasma with water
(0.1g.h-1) 4000 3500 3000 2500 2000 1500 1000 500 0 20 40 60 80 100 Trans mittance (%) Wavenumber (cm-1) CaO 4000 3500 3000 2500 2000 1500 1000 500 0 20 40 60 80 100 Trans mitance (%) Wavenumber (cm-1) CaCO3 4000 3500 3000 2500 2000 1500 1000 500 0 20 40 60 80 100 Trans mittance (%) Wavenumber (cm-1) before plasma
after plasma without water after plasma with water
Ca(OH)2 4000 3500 3000 2500 2000 1500 1000 500 0 20 40 60 80 100 Trans mittance (%) Wavenumber (cm-1) Ca(OH)2 + H2O
31 Figure 11: Infra-Red analysis of CaO after plasma treatment at different temperature, without and with water
4000 3500 3000 2500 2000 1500 1000 500 0 20 40 60 80 100 Trans mittance (%) Wavenumber (cm-1) 100°C 100°C + H2O 200°C + H2O 300°C + H2O