HAL Id: hal-00872540
https://hal.archives-ouvertes.fr/hal-00872540
Submitted on 18 Nov 2020
HAL is a multi-disciplinary open access
archive for the deposit and dissemination of
sci-entific research documents, whether they are
pub-lished or not. The documents may come from
teaching and research institutions in France or
abroad, or from public or private research centers.
L’archive ouverte pluridisciplinaire HAL, est
destinée au dépôt et à la diffusion de documents
scientifiques de niveau recherche, publiés ou non,
émanant des établissements d’enseignement et de
recherche français ou étrangers, des laboratoires
publics ou privés.
Distributed under a Creative Commons Attribution - NoDerivatives| 4.0 International
of the North Pacific subtropical gyre during a strong La
Nina condition: relationship with the hydrological
conditions
M. Girault, H. Arakawa, Aude Barani, H. J. Ceccaldi, F. Hashihama, S.
Kinouchi, Gérald Grégori
To cite this version:
M. Girault, H. Arakawa, Aude Barani, H. J. Ceccaldi, F. Hashihama, et al.. Distribution of
ultraphy-toplankton in the western part of the North Pacific subtropical gyre during a strong La Nina condition:
relationship with the hydrological conditions. Biogeosciences, European Geosciences Union, 2013, 10
(9), pp.5947-5965. �10.5194/bg-10-5947-2013�. �hal-00872540�
Biogeosciences, 10, 5947–5965, 2013 www.biogeosciences.net/10/5947/2013/ doi:10.5194/bg-10-5947-2013
© Author(s) 2013. CC Attribution 3.0 License.
EGU Journal Logos (RGB)
Advances in
Geosciences
Open Access
Natural Hazards
and Earth System
Sciences
Open AccessAnnales
Geophysicae
Open AccessNonlinear Processes
in Geophysics
Open AccessAtmospheric
Chemistry
and Physics
Open AccessAtmospheric
Chemistry
and Physics
Open Access DiscussionsAtmospheric
Measurement
Techniques
Open AccessAtmospheric
Measurement
Techniques
Open Access DiscussionsBiogeosciences
Open Access Open Access
Biogeosciences
Discussions
Climate
of the Past
Open Access Open Access
Climate
of the Past
Discussions
Earth System
Dynamics
Open Access Open Access
Earth System
Dynamics
DiscussionsGeoscientific
Instrumentation
Methods and
Data Systems
Open Access
Geoscientific
Instrumentation
Methods and
Data Systems
Open Access DiscussionsGeoscientific
Model Development
Open Access Open Access
Geoscientific
Model Development
DiscussionsHydrology and
Earth System
Sciences
Open AccessHydrology and
Earth System
Sciences
Open Access DiscussionsOcean Science
Open Access Open Access
Ocean Science
Discussions
Solid Earth
Open Access Open Access
Solid Earth
Discussions
The Cryosphere
Open Access Open Access
The Cryosphere
Discussions
Natural Hazards
and Earth System
Sciences
Open Access
Discussions
Distribution of ultraphytoplankton in the western part of the North
Pacific subtropical gyre during a strong La Ni ˜na condition:
relationship with the hydrological conditions
M. Girault1, H. Arakawa1, A. Barani2, H. J. Ceccaldi2, F. Hashihama1, S. Kinouchi1, and G. Gregori2
1Department of Ocean Sciences, Tokyo University of Marine Science and Technology, 5–7 Konan 4, Minato-ku, Tokyo
108-8477, Japan
2Aix-Marseille Universit´e, Mediterranean institute of oceanography MIO UM110, Universit´e du Sud Toulon-Var,
CNRS/INSU IRD, 13288, Marseille, cedex 09, France
Correspondence to: M. Girault (d092028@kaiyodai.ac.jp, gerald.gregori@univ-amu.fr)
Received: 28 February 2013 – Published in Biogeosciences Discuss.: 25 March 2013 Revised: 8 July 2013 – Accepted: 29 July 2013 – Published: 11 September 2013
Abstract. The distribution of ultraphytoplankton was in-vestigated in the western North Pacific Subtropical Gyre (NPSG) during La Ni˜na, a cold phase of El Ni˜no South-ern Oscillation (ENSO). Observations were conducted in a north-south transect (33.6–13.25◦N) along the 141.5◦E meridian in order to study the ultraplankton assemblages in various oligotrophic conditions. Analyses were performed at the single cell level by analytical flow cytometry. Five ultra-phytoplankton groups (Prochlorococcus, Synechococcus, pi-coeukaryotes, nanoeukaryotes and nanocyanobacteria-like) defined by their optical properties were enumerated in three different areas visited during the cruise: the Kuroshio region, the subtropical Pacific gyre and a transition zone between the subtropical Pacific gyre and the Warm pool. Prochlorococcus outnumbered the other photoautotrophs in all the investigated areas. However, in terms of carbon biomass, an increase in the relative contribution of Synechococcus, picoeukaryotes and nanoeukaryotes was observed from the centre of the subtropical gyre to the Kuroshio area. In the Kuroshio re-gion, a peak of abundance of nanoeukaryotes observed at the surface suggested an increase in nutrients likely due to the vicinity of a cold cyclonic eddy. In contrast, in the salin-ity front along the isohaline 35 and anticyclonic eddy lo-cated around 22.83◦N, the mainly constant distribution of Prochlorococcus from the surface down to 150 m
charac-terised the dominance by these microorganisms in high salin-ity and temperature zone. Results suggested that the distri-bution of nanocyanobacteria-like is also closely linked to
the salinity front rather than low phosphate concentration. The maximum abundance of ultraphytoplankton was located above the SubTropical Counter Current (STCC) at depths
>100 m where higher nutrient concentrations were mea-sured. Finally, comparison of the ultraphytoplankton concen-trations during El Ni˜no (from the literature) and La Ni˜na (this study) conditions seems to demonstrate that La Ni˜na condi-tions lead to higher concentracondi-tions of Synechococcus in the Subtropical gyre and a lower abundance of Synechococcus in the Kuroshio region. Our results suggest that the west part of NPSG is a complex area, where different water masses, salinity fronts and eddies lead to a heterogeneous distribu-tion of ultraphytoplankton assemblages in the upper layer of the water column.
1 Introduction
In the subtropical Pacific Ocean, phytoplankton assemblages are mainly dominated by small-sized organisms from 0.2 µm to 2 µm in diameter (Li et al., 2011). These microorgan-isms have been reported to significantly contribute to the biological pump and export of carbon in oligotrophic con-ditions (Richardson and Jackson, 2007). Phytoplankton dis-tribution is a well-documented topic in the North Pacific Subtropical Gyre (NPSG), especially in the vicinity of the equator and in the centre of the subtropical gyre (Camp-bell and Vaulot, 1993; Suzuki et al., 1995; Camp(Camp-bell et al.,
1997; Blanchot et al., 2001). Ultraphytoplankton, consist-ing of photoautotrophic prokaryotes (such as picocyanobac-teria, Prochlorococcus and Synechococcus) and eukaryotes (< 10 µm), are distributed in the euphotic layer between the surface and 200 m, depending on irradiance, hydrography line, climatic conditions such as El-Ni˜no Southern Oscilla-tion (ENSO), nutrient availability (Matsumoto et al., 2004) and trophic processes (predation and viral lysis).
However, only a few reports, mainly conducted under the warm phase of the ENSO (El Ni˜no), have addressed the distribution of phytoplankton in the western part of the NPSG (Zhang et al., 2008; Kitajima et al., 2009). Nutri-ents in this area were reported to be depleted in the surface layer (Hashihama et al., 2009). Under such oligotrophic con-ditions, investigations of phytoplankton communities based only on pigment measurements are more difficult due to the low cellular pigment content induced by irradiance and nu-trient limitation (Goericke and Montoya, 1998; Henriksen et al., 2002).
In this study, we used analytical flow cytometry in order to assess the ultraphytoplanktonic community distribution where the nutrient concentrations were close to the detection limit and chlorophyll a maxima observed at the limit of the euphotic layer. We have investigated the distribution of pico-and nanophytoplankton during a North-South transect from 33.6◦N to 13.25◦N. The heterotrophic prokaryote distribu-tion was also addressed in this study. Along this transect, we looked for the relationships between the spatial variability of dominant ultraphytoplankton communities and the environ-mental factors and water masses during a notable La Ni˜na event.
2 Materials and methods
2.1 Study area and sampling strategy
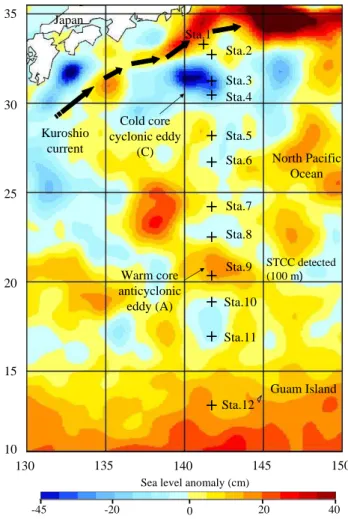
Seawater samples were collected during the Tokyo-Palau cruise conducted in the western part of NPSG along 141.5◦E transect (Fig. 1). The cruise was carried out from 17 January to 8 February 2011 on board RT/V Shinyo Maru. During this cruise, 12 stations between 33.6◦N and 13.25◦N were sampled. Seawater samples were collected without replicates at several depths between the surface and 200 m with 2.5 L Niskin bottles mounted on a Conductivity-Temperature-Depth/Carousel system equipped with an in situ fluorometer. Due to the severe climatic conditions, seawater samples were collected only at the surface with a single Niskin bottle be-tween stations 1 and 4 and CTD casts were not performed. However, eXpendable Conductivity/Temperature/Depth pro-filing systems (XCTD) were used to measure the temperature and salinity between stations 1 and 4. This is why, in this manuscript, data from the surface and data along the water column are addressed separately (e.g. for principal compo-nent analysis). From station 5, the sampling depths were
de-35 30 25 20 15 10 130 135 140 145 150 Guam Island North Pacific Ocean Japan Sta.1 Sta.4 Sta.2 Sta.3 Sta.5 Sta.6 Sta.7 Sta.8 Sta.9 Sta.10 Sta.11 Sta.12 Cold core cyclonic eddy (C) Warm core anticyclonic eddy (A) Kuroshio current
Sea level anomaly (cm)
-45 -20 0 20 40
STCC detected (100 m)
Fig. 1. Map of the sea level anomaly (cm) in the west part of the
North Pacific subtropical gyre. Thick black arrows display the di-rection of the Kuroshio Current. Black crosses are the location of the sampling stations during the cruise.
cided based on the chlorophyll a profile measured with an in situ fluorometer during the downward cast. Due to the max-imal depth sampled in this study (200 m), we did not cor-rect the temperature for adiabatic heating as a result of com-pression. The light parameters have been monitored at five stations (5, 7, 9, 11, 12) using a Profiling Reflectance Ra-diometer (PRR 600 Biospherical Instrument®). The euphotic layer was measured as the depth of 1 % of photosyntheti-cally active radiation at noon. The mixed layer depths were calculated according to the 1σO=0.15 kg m−3 (relative to
z =10 m, Thomson and Fine, 2003). 2.2 Nutrient analysis
Nutrient concentrations in the seawater samples were de-termined by using highly sensitive colorimetry that con-sisted of an AutoAnalyser II (Technicon, now SEAL Ana-lytical) and Liquid Waveguide Capillary Cells (World Preci-sion Instruments) as described in Hashihama et al. (2009) for nitrate + nitrite and soluble reactive phosphorus and in
Hashihama and Kanda (2010) for silicic acid. The detec-tion limits were 3, 3, and 11 nM for nitrate + nitrite, soluble reactive phosphorus, and silicic acid, respectively. Seawater collected from the surface of the western subtropical North Pacific and preserved for > 1 yr was used as nitrate + nitrite blank, and nitrate + nitrite concentrations of this blank wa-ter was dewa-termined by the chemiluminescent technique (Gar-side, 1982). The soluble reactive phosphorus and silicic acid blank were prepared by the MAGIC procedure (Karl and Tien, 1992). Soluble reactive phosphorus consists mainly of orthophosphate (hereafter referred to as phosphate). Because nitrite was not substantially detectable, nitrate + nitrite was referred to as nitrate hereafter. Due to the lack of data from stations 10 to 12, data were not shown below the depth of 70 m. By using the nutrient concentrations the Redfield and Brzezinski ratios have been calculated on the basis of the following stoichiometries: Si : N : P = 15 : 16 : 1 (Brzezinski, 1985).
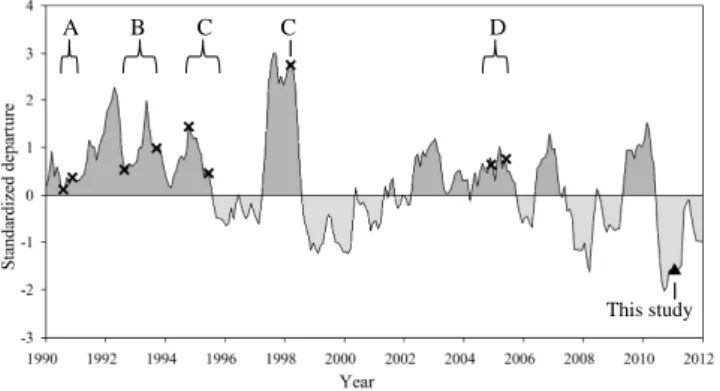
2.3 Altimetry and large scale climatic condition The altimeter data (sea level anomaly) were produced by Ssalto/Duacs and distributed by Aviso, with support from CNES (http://www.aviso.oceanobs.com/duacs/). The sea level anomaly map centred on the 18/01/2011 (the pro-cess generates maps compiling data collected six weeks be-fore and after the chosen date) (Fig. 1) was plotted using the Panoply software from the NASA (http://www.giss.nasa. gov/tools/panoply/). The multivariate ENSO index (MEI) data were used to describe the large scale climatic condi-tion. The data were available from the NOAA website (http: //www.esrl.noaa.gov/psd/enso/mei/) (Fig. 2).
2.4 Flow cytometry (FCM) and carbon biomass Seawater samples collected from the Niskin bottles were pre-filtered through a 100 µm mesh size net to prevent any clog-ging of the flow cytometer. Cryovials (5 cm3) were filled with 4.5 cm3subsamples that were preserved with 0.5 cm3of a 20 % formaldehyde solution (2 % final concentration) for ultraphytoplankton analysis. Cryovials (2 cm3) were filled with 1.8 cm3 subsamples that were preserved with 0.2 cm3 of a 20 % formaldehyde solution (2 % final concentration) for heterotrophic prokaryote analysis. Samples were then rapidly frozen in liquid nitrogen and stored in a deep freezer (−60◦C) until analysis at the PRECYM flow cytometry
plat-form (http://precym.com.univ-mrs.fr). In the laboratory, cry-ovials were rapidly thawed at room temperature and analysed using a FACSCalibur flow cytometer (BD Biosciences®) of the PRECYM flow cytometry platform. The flow cytome-ter is equipped with a blue (488 nm) air-cooled argon laser and a red (634 nm) diode laser. For each particle (cell), five optical parameters were recorded: two light scatter sig-nals, namely forward and right angle light scatter, and three fluorescences corresponding to emissions in green (515–
A B C D
This study
C
Fig. 2. Multivariate El Ni˜no–Southern oscillation Index, (MEI)
be-tween January 1990 and 2012. The dark grey shaded area above the line shows the El Ni˜no condition period and light grey be-low the line is the La Ni˜na condition period. The black crosses show the previous observations conducted in the western part of North Pacific subtropical gyre. The black triangle shows the Tokyo Palau cruise (this study). A, B, C, D are the studies of Shimada et al. (1993), Suzuki et al. (1997), Horimoto et al. (2001) and Ki-tajima et al. (2009), respectively. Shimada et al. (1993) sampled seawater during two cruises (from August to September and from November to December). Suzuki et al. (1997) conducted experi-ments in August-September 1992 and 1993. Horimoto et al. (2001) collected samples during 3 cruises (October 1994, June 1995 and March 1998) and Kitajima et al. (2009) during two cruises (Novem-ber to Decem(Novem-ber 2004 and May to June 2005).
545 nm), orange (564–606 nm) and red (653–669 nm) wave-length ranges. Data were collected using the CellQuest soft-ware (BD Biosciences®). The analysis and identification of ultraphytoplankton groups were performed a posteriori us-ing SUMMIT v4.3 software (Beckman Coulter). For each sample the runtime of the flow cytometer was set up at 3 and 2 min for ultraphytoplankton and heterotrophic prokary-ote analyses, respectively. The sample flow rate was about 50 µL min−1 (corresponding to the “Med” flow rate of the flow cytometer).
Five ultraphytoplankton groups (Prochlorococcus,
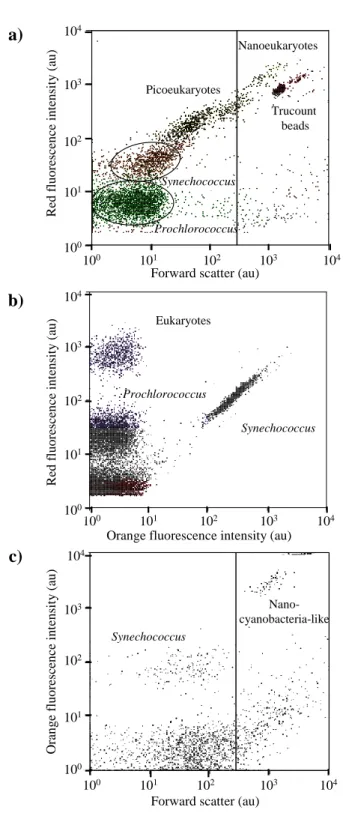
Synechococcus, picoeukaryotes, nanoeukaryotes, and nanocyanobacteria-like) were resolved without any staining on the basis of their scatter and fluorescence properties (Fig. 3). Combining the light scatter and fluorescence properties of each “particle” (cell), ultraphytoplankton was optically resolved in three different groups of picophyto-plankton (the prokaryotes: Prochlorococcus, Synechococcus, and eukaryotes with a diameter size ranging from 0.2 to 2 µm) and two groups of nanophytoplankton (nanoeukary-otes and nanocyanobacteria-like with a diameter size ranging from 2 to 10 µm). Separation of picoeukaryotes and nanophytoplankton was performed by adding 2 µm yellow-green fluorescent cytometry beads (Fluoresbrite YG 2 µm, Polyscience Inc.) to the samples. Trucount™ calibration beads (Becton Dickinson Biosciences) were also added to the samples as an internal standard both to
100 101 102 103 104 0 1 2 3 4 104 103 102 101 R ed fl u o re sc en c e in te n si ty (a u ) 104 103 102 101 100 Synechococcus Eukaryotes Prochlorococcus 100
Orange fluorescence intensity (au)
. 100 101 102 103 104 FS Log 100 101 102 103 104 F lu o R o u g e L o g 104 103 102 101 R ed fl u o re sc en ce i n te n si ty (a u ) 100 100 104 103 102 101 100
Forward scatter (au)
Prochlorococcus Synechococcus Picoeukaryotes Nanoeukaryotes Trucount beads , . 100 101 102 103 104 100 101 102 103 104 F lu o o ra n g e L o g 104 103 102 101 100 100
Forward scatter (au) 104 103 102 101 O ra n g e fl u o re sc en c e in te n si ty (a u ) Nano-cyanobacteria-like Synechococcus
c)
a)
b)
Fig. 3. Resolution by flow cytometry of the ultraphytoplankton
as-semblage composition during the Tokyo-Palau cruise. Panels (a) and (b) display cytograms of red fluorescence (chlorophyll a) ver-sus forward scatter (size) and orange fluorescence (phycoerythrin) resolving four cell groups: Synechococcus, Prochlorococcus, pi-coeukaryotes and nanoeukaryotes in samples collected at station 8 (100 m depth). Panel (c) displays the orange fluorescence versus forward scatter and discriminates the nanocyanobacteria-like to the
Synechococcus in the sample collected at 3 m depth of the
sta-tion 11. The beads are the Trucount calibrasta-tion beads (Beckton Dickinson).
monitor the instrument stability and to determine the volume analysed by the instrument. This is mandatory to compute the cell abundances. The nanophytoplankton community was characterised by the highest intensities in light scatter and red fluorescence (chlorophyll a related). Prochlorococcus and picoeukaryotes were resolved thanks to their lower light scatter, red fluorescence intensities and low orange fluorescence. Synechococcus were recognised by their small intensities in light scatter and red fluorescence, concomi-tant with higher values of orange fluorescence due to the presence of phycoerythrin. An additional group reported here as nanocyanobacteria-like was observed at several sta-tions during the cruise. This group has the highest value of orange fluorescence and was separated from Synechococcus thanks to the strong intensities of forward scatter (Sato et al., 2010). As no molecular analyses were performed to confirm the identification of nanocyanobacteria, this flow cytometry group was cautiously named nanocyanobacteria-like in this manuscript.
Ultraphytoplankton abundances were also expressed in term of carbon biomass using conversion factors reported in the literature. The factors 49, 250, 671, 2100 and 3498 fg C cell−1 were used to convert Prochlorococcus,
Synechococcus, picoeukaryotes, nanocyanobacteria and
na-noeukaryotes, respectively (Cailliau et al., 1996; Kana and Glibert, 1987; Campbell and Yentsch, 1989; Karayanni et al., 2005).
Although this study focuses on the distribution of ult-raphytoplankton, heterotrophic prokaryotes were also enu-merated as part of the Tokyo-Palau project. Heterotrophic prokaryotes were analysed after staining of their nucleic acid using SYBR Green II (Molecular Probes®) on the basis of the methods detailed in Marie et al. (1999) and Lebaron et al. (1998), modified by Gregori et al. (2003). The overlap-ping of stained Prochlorococcus in the green fluorescence versus side scatter cytograms was accounted for by using the red fluorescence (induced by the chlorophyll) that dis-tinguishes Prochlorococcus from heterotrophic prokaryotes (Sieracki et al., 1995). In this study, heterotrophic prokary-otes will be considered as a whole group, without distinction of subclusters related to the nucleic acid content. The het-erotrophic prokaryote abundance was expressed in terms of carbon biomass using a conversion factor of 15 fg C cell−1 (Caron et al., 1995).
2.5 Statistical analyses
Statistical analyses were performed using the R software (ve-gan package) and Biplot macro for Excel® (Lipkovich and Smith, 2002). Kruskal-Wallis tests were performed in order to compare the abundances of ultraphytoplankton at the var-ious sampling stations.
To analyse the multivariate dataset, principal component analyses (PCA) and redundancy analysis (RDA) were also performed.
PCA reduces the data dimensionality by performing a co-variance analysis between factors. The procedure transforms a number of possibly correlated variables into a smaller number of uncorrelated factors called principal components (Pearson, 1901). Due to the severe weather conditions at the beginning of the sampling cruise, two PCAs were performed in this study: (i) using the data collected at the surface only and (ii) using the data collected at various depths from sta-tions 5 to 11. Choice of two different PCAs was motivated by the lack of sampling point below the seawater surface from stations 1 to 4. Station 12 was not included in the PCA per-formed on the vertical profiles because several variables were missing.
In addition to the PCA, the relationships between phyto-plankton communities and environmental factors were inves-tigated by using RDA. Data were log10(x +1)-transformed
to correct for the large differences in scale among the origi-nal variables. Then, Monte-Carlo tests were used to test the significance of the contribution of the various environmen-tal variables to explain the microorganism distribution by the RDA. Partial RDA was also used to evaluate the effects of each explanatory variable set on the organism composition (Liu, 1997). Two RDA were performed using (i) the surface observations only and (ii) the vertical profiles (Sta. 5 to 11). However, this manuscript only consider the result for the ver-tical profiles because the Monte-Carlo test statistics were not significant for the surface data (P = 0.1, using 999 permuta-tions).
Hierarchical ascendant classifications were also performed to readily regroup similar stations together (low within-variability). Hierarchical clustering was performed using the first and second axes of the PCA which explained more than 60 % of the inertia.
3 Results
3.1 Hydrographic conditions
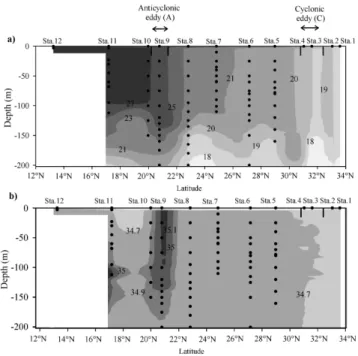
Seawater was sampled along a 2300 km transect in January 2011 during a significant cold phase of ENSO (La Ni˜na) (Fig. 2). Sea level anomaly map shows two main eddies over the sampling area, (i) a cold core cyclonic eddy (C, 31◦N, 141◦E) and (ii) a warm core anticyclonic eddy (A, 20.5◦N, 142◦E) (Fig. 1). Stations 3 and 9 were located in the vicin-ity of C and A, respectively. Figure 4a illustrates the ver-tical distribution of temperature (0–200 m) measured along the transect (141.5◦E). Figure 4a shows a north-south
tem-perature gradient with a minimum at station 1 (18.5◦C) and a maximum at station 12 (28.2◦C). At station 3, the low tem-perature (18.6◦C) in the near surface and the occurrence of a thermocline dome at 150 m depth evidenced the pumping effect of the anticlockwise eddy C. Figure 4b shows the ver-tical distribution of salinity measured during the cruise. The lower salinities (< 34.7) were observed from stations 1 to 4
Fig. 4. Vertical distributions of temperature (a) and salinity (b)
mea-sured along the studied transect (141.5◦E). The location of the
ob-served stations is indicated in the upper scale axis. Black dots illus-trate the sampling depths. Cold core cyclonic eddy (C) and warm core anticyclonic eddy (A) identified with the sea level anomaly map are shown with small black arrows.
and in the upper 50 m between station 10 and 11. Station 9 was located within a thermohaline front.
The temperature-salinity diagram (Fig. 5) highlights three major groups of stations (stations 1–4; stations 5–8; sta-tions 9–11). The four northernmost stasta-tions were charac-terised by a low salinity (34.62 to 34.71) and tempera-tures ranging from 17.1◦C to 19.6◦C. The Kuroshio re-gion term is used to characterise this group of stations ac-cording to Sekine and Miyamoto (2002). Salinity and tem-perature of the second group (Subtropical gyre, stations 5– 8) were in the ranges 34.7–34.8 and 18.2–22.5◦C, respec-tively. Although the profiles were similar between 18◦C and 21◦C, differences in the temperature-salinity curves of sta-tions 7 and 8 were observed in the upper layer (surface to 150 m depth). In the upper layer the salinity at station 7 were higher than station 8. The last group includes the southern-most stations (Transition zone, stations 9–10–11). These sta-tions were characterised by a high variability in salinity (34.6 to 35.1) and temperature (18.5◦C to 27.5◦C). Among the
third group, salinity ranged from 34.86 to 35.1 at station 9 and remained higher than other stations. Similarly, the lowest amplitude of temperature was observed between the surface (26◦C) and 200 m depth (19.8◦C). The seawater temperature from stations 9 to 11 was lower than 28.5◦C.
Fig. 5. Temperature-salinity diagram from surface to 200 m between
stations 1 and 11. The three groups of stations are shown with dif-ferent colours: stations in the Kuroshio region (1–4) by a white sym-bol; stations in the centre of the subtropical gyre (5–8) in black; and stations in the transition zone (9–11) in dark grey.
3.2 Nutrient conditions
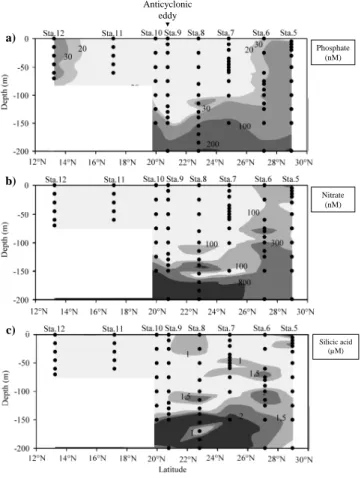
Figure 6 shows the vertical distribution of nutrients between stations 5 and 12. The general pattern of the phosphate dis-tribution was characterised by a depletion of surface waters (< 20 nM) between stations 7 and 11 (Fig. 6a). At the north-ernmost and southnorth-ernmost ends (stations 5, 6, and 12) phos-phate concentrations ranged from 20 nM at the surface to 160 nM in the deeper layer (200 m). In this section, the high-est phosphate concentrations were observed below the depth of 150 m. Nitrate concentrations values varied from < 3 nM to 929 nM (station 9, 200 m, Fig. 6b). Although a slight in-crease in nitrate concentration was observed at stations 5 and 6 (100 nM), the distribution globally paralleled phosphate concentrations. Contrasting to nitrate and phosphate distribu-tions, high concentrations of silicic acid were observed in the upper layer from station 5 to station 8 (Fig. 6c). The concen-trations of silicic acid varied from 0.3 µM (station 7, 30 m) to 2.4 µM (station 9, 150 m). At station 8, between 100 m and 120 m depth, phosphate, nitrate, and silicic acid concentra-tions were higher than surrounding sampling depths. Except for the station 3, the phosphate and nitrate concentrations at the surface of the Kuroshio area ranged from 8 to 20 nM and from 240 nM to 297 nM, respectively. The concentrations of phosphate (96 nM) and nitrate (630 nM) at station 3 were the highest measured in the surface layer. However, the sili-cic acid concentration at station 3 (1.01 µM) was the lowest measured in the Kuroshio region (average 1.38 µM).
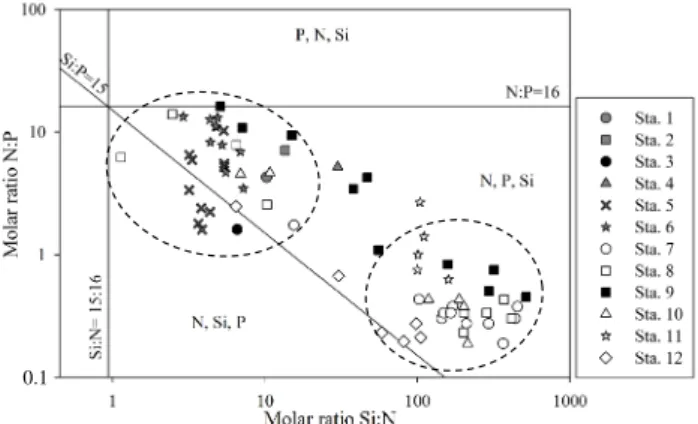
The Redfield and Brzezinski ratios calculated among the stations are mainly characterised by a potential limitation in nitrogen (Fig. 7). The second potential limitation was phos-phorus and silica. Two different groups were observed for the stations and were discriminated using circles (Fig. 7). A first group (stations 1 to 6) was characterised by a high N : P ra-tio close to phosphorus potential limitara-tion. In contrast, the second group, consisting of 92 % of samples collected in the upper 50 m (stations 7 to 12), had a lower N : P
stoichiome-Nitrate (nM) Silicic acid (µM) a) b) c) b) c) Anticyclonic eddy Phosphate (nM) Nitrate (nM) Silicic acid (µM)
Fig. 6. Vertical distribution of nutrient concentrations measured
be-tween stations 5 and 12: Distribution of (a) phosphate (nM) (b) ni-trate (nM), and (c) silicic acid (µM). The black dots display the sampled depths and the names of the stations are indicated in the upper scale axis.
try (0.18 to 1.38) and a high ratio of Si : N (59 to 514). The seawater sampled deeper than 50 m was characterised by a progressive increase in the molar ratio N : P and a decrease in the Si : N ratio at the same time. Station 3 (black dot) has a particular pattern due to its Si : P ratio lower than 15, ob-served at the surface. In contrast, station 9 (black squares) located near the anticyclonic eddy had the highest Si : P ratio of the cruise.
3.3 Microbial community composition and distribution Flow cytometry analyses made it possible to discriminate five ultraphytoplankton clusters on the basis of the cellular optical properties (light scatter and fluorescence). Figure 8 illustrates the concentrations of Synechococcus,
Prochloro-coccus, picoeukaryotes and nanoeukaryotes at the surface
from station 1 to 12. Two main patterns were identified dur-ing the cruise: (i) Synechococcus and Prochlorococcus abun-dance peaks centred on station 8, (ii) a significant difference in the picoeukaryote, nanoeukaryote and nanocyanobacteria-like concentrations between the group defined by stations 1
0.1
Fig. 7. Si : N : P molar ratio of all data collected during the Tokyo
Palau cruise. In each area, delimited by the Brzezinski (1985) Si : N : P = 15 : 16 : 1, the potential limiting nutrient are shown in or-der of priority. The black symbols show the sampling depth near the cyclonic and anticyclonic gyres (stations 3 and 9, respectively). The black dotted circles discriminated two groups of sampling points depending on their nutrient ratios.
to 8 and the group defined by stations 9 to 12 (Kruskal–Wallis one-way analysis of variance, n = 36, p value < 0.05).
Synechococcus concentrations at the edge of the transect
ranged from 1.94 × 10³cells cm−3to 8.27 × 10³cells cm−3 (northern and southern side respectively). The maximum abundance of Synechococcus was observed at station 8 (2.73 × 10⁴cells cm−3). Except for station 4,
Prochloro-coccus were more abundant than SynechoProchloro-coccus and their
abundances ranged from 2.05 × 10³cells cm−3 (station 12) to 4.22 × 10⁵cells cm−3 (station 8). Picoeukaryote and na-noeukaryote concentrations were close to 700 cells cm−3 at the southern stations and drastically increased between 20◦N and 22.83◦N (up to 6.4 × 10³cells cm−3). Few vari-ations in abundances were observed from station 1 to sta-tion 8 and concentrasta-tions were about 6.6 × 10³cells cm−3. Nanoeukaryote abundances slightly decreased in the north-ern part of the transect, except for station 3 near the cold cy-clonic eddy C where the maximum abundance was found. In contrast, nanocyanobacteria-like concentrations were mainly observed between station 9 and station 12. With the peak of abundance at station 11 (312 cells cm−3, right axis), nanocyanobacteria-like had the lowest concentration com-pared with the abundance of other populations. The distri-bution of heterotrophic prokaryotes abundance at the sur-face is also shown in Fig. 8. The concentrations ranged from 4.16 × 10⁵cells cm−3 (Station 9) to 2.33 × 10⁶cells cm−3 (Station 4). Except for these two extreme values, abun-dance of the heterotrophic prokaryotes was centred around 1 × 10⁶cells cm−3along the transect.
Figure 9a displays the vertical distribution of
Synechococ-cus between stations 5 and 12. Two different zones
corre-sponding to stations 5 to 8 and stations 9 to 12, respec-tively were distinguished based on the cell abundances.
Fig. 8. Abundances of heterotrophic prokaryotes and
ultraphyto-plankton at surface depending on the latitude along the 141.5◦E
meridian. The sampling stations are given on the upper scale axis. The black squares represent the concentration of the heterotrophic prokaryotes, the white circles the Prochlorococcus, the black cir-cles the Synechococcus, the black and the white triangles the abundances of picoeukaryotes and nanoeukaryotes, respectively. The black crosses show the nanocyanobacteria-like (right axis). Nanocyanobacteria-like were not detected in the surface samples from the stations 1 to 8.
Abundances of Synechococcus were higher between sta-tions 5 and 8 than in the area south of station 9.
Syne-chococcus were widely distributed from the surface down
to 150 m depth in the group of the northernmost stations. However, lower concentrations were observed in the area south of station 9. In the stations between 28.98◦N and
22.83◦N (stations 5 to 8), the maximal abundances ranged
from 40 m to 80 m depths, close to the maximum of chloro-phyll a. (Fig. 10). In this layer the maximum concentration (3.04 × 10⁴cells cm−3) was measured at station 8 at 50 m depth. Prochlorococcus were mainly distributed from the surface down to 110 m between stations 7 and 9 (Fig. 9b). From station 10, the highest concentrations were observed between 70 m and 120 m depths and matched with the sub-surface chlorophyll a maximum. Similarly to
Synechococ-cus, the maximum of Prochlorococcus was measured at
station 8 at 50 m depth (4.34 × 10⁵cells cm−3). As far as picoeukaryotes are concerned (Fig. 9c), the major pattern of distribution is defined by high abundances observed in the subtropical gyre seawater and low abundances mea-sured at the southernmost stations (< 4.3 × 10³cells cm−3). Between stations 5 and 12, picoeukaryote concentrations ranged from 51 cells cm−3, (station 9, 200 m depth) to 11.5 × 10³cells cm−3 (station 6, 50 m depth). The vertical distribution of nanoeukaryotes (Fig. 9d) was characterised by several patches of relatively high concentrations among the stations (station 5, 25 m; station 6, 125 m; station 8 sur-face and 50 m; station 10, 100 m). Concentrations of na-noeukaryotes ranged from 69 cells cm−3 (station 6, 150 m)
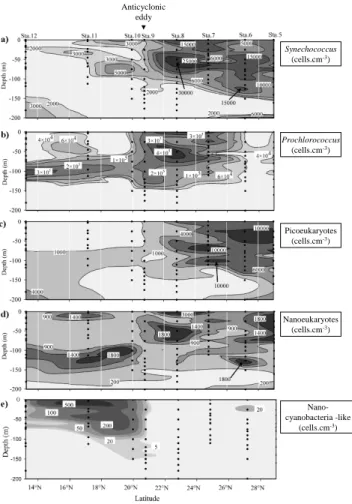
Anticyclonic eddy Synechococcus (cells.cm-3) Prochlorococcus (cells.cm-3) Picoeukaryotes (cells.cm-3) Nanoeukaryotes (cells.cm-3) Nano-cyanobacteria -like (cells.cm-3)
Fig. 9. Vertical abundances (cells cm−3) of the five
ultraphyto-plankton groups defined during the cruise: (a) Synechococcus, (b)
Prochlorococcus, (c) picoeukaryotes and (d) nanoeukaryotes and
(e) nanocyanobacteria. Black dots illustrate the sampling depth
be-tween stations 5 and 12.
to 3 × 10³cells cm−3 (station 8, surface and 50 m). Fig-ure 9e shows the distribution of nanocyanobacteria-like from station 5 to 12. Nanocyanobacteria-like were mainly ob-served in the area south of station 9 where the concentration reached 550 cell cm−3 at 3 m depth (station 11). Distribu-tion of nanocyanobacteria-like concentraDistribu-tion is located in the shallow layer from the surface to 100 m. Except for station 6 (25 m, 25 cells cm−3), concentrations were below the limit of detection of the method used (about 5 cell cm−3, i.e. 1 cell detected in the volume analysed by the flow cytometer) from station 8 to the northernmost station.
Figure 10 displays the distribution of chlorophyll a and the depths of the euphotic and mixed layers (MLD). At sta-tion 3, within the cyclonic eddy in the Kuroshio region, the MLD was found at 145 m, well above the MLD at surround-ing stations 2 and 4 (180 m). At station 9, within the anticy-clonic eddy, the MLD was observed at 133 m, deeper than at surrounding stations 8 and 10 (101 and 95 m, respectively). The bottom of the euphotic layer was mainly observed above
D ep th ( m ) -200 -150 -100 -50 0 14 16 18 20 22 12 0.1 0.1 0.2 0.2 0.3 0.3 0.2 Latitude (°N) 1 2 3 4 5 6 7 8 9 10 11 12 Cyclonic eddy Anticyclonic eddy 24 26 28 30 32 34
Fig. 10. Vertical profiles of chlorophyll a concentrations (µg dm−3)
measured during the cruise. The black dots are the sampled depths. The white circles are the mixed layer depths. The white triangles are the depths of 1 % of photosynthetically active radiation.
the MLD. The chlorophyll a distribution matched that of pi-coeukaryotes (Fig. 9)
The vertical distribution of the heterotrophic prokaryotes at stations 5 to 12 is reported in Fig. 11. The most obvi-ous feature is their low abundance (< 5 × 10⁵cells cm−3)
in the upper 150 m of station 9. Conversely, high con-centrations of heterotrophic prokaryotes were mainly lo-cated in the upper layer for the other stations. The two highest concentrations were observed at a depth of 50 m at station 7 (1.6 × 10⁶cells cm−3) and 112 m at sta-tion 11 (2.9 × 10⁶cells cm−3) where Prochlorococcus and nanoeukaryotes were particularly abundant. The relationship with autotrophs, investigated from stations 5 to 12 by calcu-lating the integrated abundance of the heterotrophic prokary-otes to 200 m, and looking for a correlation with the inte-grated chlorophyll content in the same water column (data not shown). There is no apparent correlation between the variables.
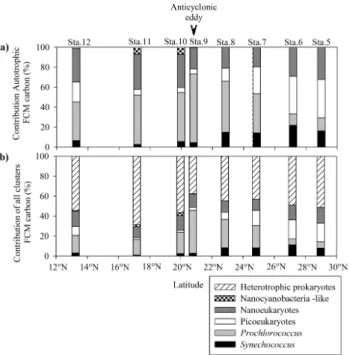
Figure 12a illustrates the contribution of each autotrophic cluster (carbon biomass integrated between the surface and 200 m depth) to the total autotrophic carbon biomass (sum of the biomass of the various autotrophic flow cytometry clusters). Percentages of contribution are shown for each cluster between stations 5 and 12. The contributions of
Synechococcus ranged from 2.6 % to 6.5 % between
sta-tions 9 and 12. However, as their biomass was significantly higher between stations 5 and 8, the percentage contribution to total autotrophic carbon biomass varied from 14.1 % to 21.7 % (Kruskal–Wallis one-way analysis of variance, n = 7,
pvalue < 0.05). The contribution of Prochlorococcus to the total autotrophic carbon biomass was lower at stations 5 and 6 (13.1 % and 11.7 %, respectively). It increased to reach a maximum at station 9 (69 %) and then progressively de-creased to 39 % at station 12. In contrast, contribution of picoeukaryotes decreased from station 5 (38 %) to station 9 (5 %), and increased between stations 9 and 12 (20 %). The contribution of nanoeukaryotes oscillated between 33 % and
Anticyclonic eddy
Fig. 11. Vertical concentration (cells cm−3)of the heterotrophic
prokaryotes between stations 5 and 12. The black dots are the sam-pled depths.
35 % south of 20◦N, reached a minimum value of 19.7 % at station 7, and increased until station 5 (32.4 %). The con-tribution of nanocyanobacteria-like was low along the tran-sect, especially to the north of station 9 (0.2 %, station 6). The higher contribution is mainly centred between stations 9 (0.4 %) and 12 (0.5 %) where a peak was observed at sta-tions 10 and 11 (6 % and 7.2 %, respectively). Figure 12b displays the contribution of each cluster (carbon biomass in-tegrated between the surface and 200 m depth) to the sum of the biomass of the all the flow cytometry clusters. The carbon biomass of heterotrophic prokaryotes exceeded the sum of biomasses of all autotrophic clusters at stations 5, 10, 11 and 12 (51.4 %, 56.4 %, 68.4 % and 54.6 %, respec-tively). At stations 6, 7 and 8 heterotrophic prokaryotes were the main cluster with percentages ranging from 43.2 % to 49 %. However, at station 9, the carbon biomass is dominated by Prochlorococcus (43 %) and by heterotrophic prokaryotes (37.7 %).
3.4 Statistical analyses
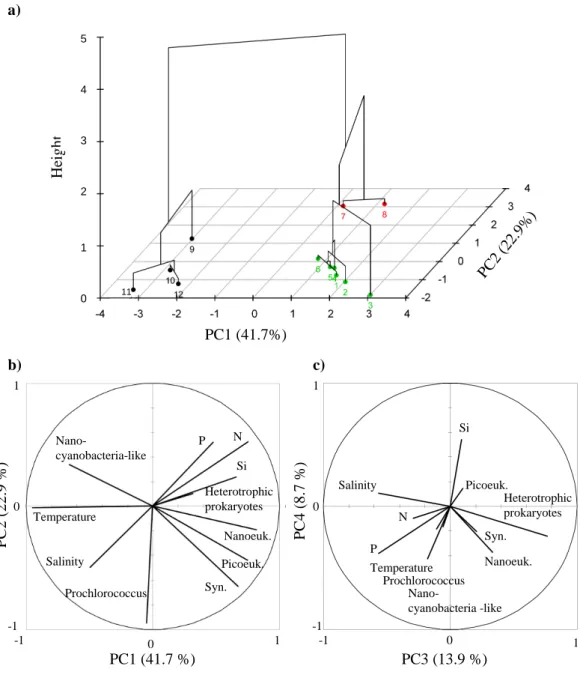
As data were collected on a large number of variables, we have applied Principal Component Analysis (PCA) to re-duce the dimensions into a smaller number of principal com-ponents (linear combination of the observed variables) that account for most of the variance (Pearson, 1901). The cor-respondence analysis applied on the surface samples was characterised by the two first principal components which explain 41.7 % and 22.9 % of the total inertia, respectively (Fig. 13). The third component explains 13.9 % only of the total inertia and is mostly influenced by the heterotrophic prokaryote concentration due to their high abundances com-pared to ultraphytoplankton. By a measure of dissimilarity between the various sets of observations, an ascendant hierar-chical classification was then performed to group similar sta-tions together. Three groups of stasta-tions were thus identified (Fig. 13). In agreement with the transition zone evidenced by the hydrographical conditions, the first group is defined by the stations south of 20.5◦N (stations 9, 10, 11 and 12). The second group consists of two stations only (stations 7 and 8)
Fig. 12. Latitudinal contributions of (a) each autotrophic cluster
defined by flow cytometry (FCM) to the whole autotrophic car-bon biomass integrated between surface and 200 m depth. (b) Dis-plays the contribution (%) of each cluster (autotrophs and het-erotrophic prokaryotes) defined by flow cytometry to the whole car-bon biomass integrated between surface and 200 m depth.
located in the subtropical water mass. The third group con-tains the six stations located in the northernmost section of the transect (stations 1 to 6).
By using PCA, we measured the relationship between the ultraphytoplankton and the environmental variables mea-sured. Ultraphytoplankton in the surface formed groups discriminated by their different coordinates on the two first principal components. Thus, the variable corresponding to nanocyanobacteria-like and Prochlorococcus abundance have a negative coordinate on PC1 while the variables corre-sponding to Synechococcus, picoeukaryote, and nanoeukary-ote abundances had positive coordinates based on the circle of correlation between the variables (Fig. 13). PC1 differenti-ates temperature, salinity and nanocyanobacteria-like (nega-tive coordinates) from nutrients (posi(nega-tive coordinates), espe-cially nitrate and phosphate, and heterotrophic prokaryotes. Temperature and salinity were associated with the southern-most stations and contributed more to nanocyanobacteria-like and Prochlorococcus distributions than to other ultra-phytoplankton clusters. In contrast, the northernmost sta-tions were characterised by the highest nutrient concen-trations and their correlation with the nanoeukaryotes, pi-coeukaryotes, Synechococcus, and heterotrophic prokaryotes concentrations. PC2 revealed that stations 7 and 8 were as-sociated with high abundances of Prochlorococcus,
PC1 (41.7 %) P C 2 ( 2 2 .9 % ) PC3 (13.9 %) P C 4 ( 8 .7 % ) b) a) PC1 (41.7%) PC2 (22. 9% ) H ei g h t 0 1 2 3 4 c) -1 1 0 -1 0 1 Temperature Salinity Nano-cyanobacteria-like Prochlorococcus Nanoeuk. Syn. Picoeuk. P N Si Heterotrophic prokaryotes -1 1 0 -1 0 1 Heterotrophic prokaryotes Picoeuk. Si Salinity Prochlorococcus Syn. Nanoeuk. Nano-cyanobacteria -like P N Temperature 5 11
Fig. 13. Determination of the three groups of stations (1–6, 7–8, and 9–12) as identified by the hierarchical clustering (a) performed on the
various parameters measured at the surface: temperature, salinity, nutrients (phosphate (P), nitrate (N) and silicic acid (Si)), the heterotrophic prokaryotes and the ultraphytoplankton (Nanocyanobacteria-like, Prochlorococcus, Synechococcus (Syn.), picoeukaryotes (Picoeuk.), Na-noeukaryotes (Nanoeuk.)). The circle (b) of correlation displays the two first dimensions of the Principal Component Analysis (PCA) and the circle (c) the dimensions 3 and 4.
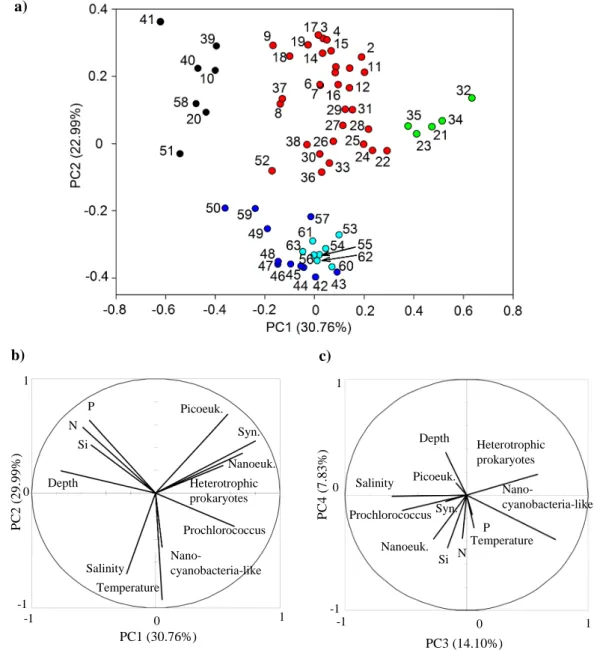
The PCA and hierarchical classification applied to the data between stations 5 and 11 yielded an interesting syn-thesis of the environmental conditions and distribution of ultraphytoplankton (Fig. 14 and Table 1). The two first principal components explained 30.76 % and 29.99 % of the total inertia, respectively. With 14.1 % of total iner-tia, PC3 mainly differentiated heterotrophic prokaryotes and nanocyanobacteria-like from the ultraphytoplanktonic groups, nutrients and salinity. PC1 mainly discriminated the environmental conditions of the microorganisms. Similarly
to the PCA performed with the surface data,
Prochloro-coccus and nanocyanobacteria-like were separated from Synechococcus, picoeukaryotes, nanoeukaryotes, and
het-erotrophic prokaryotes. PC2 provides an interesting pattern due to the discrimination between temperature, salinity, and nutrients. By performing ascendant hierarchical classifica-tion, stations 5 to 11 were distributed in five clusters (Fig. 14 and Table 1). Cluster 1 characterised the sampled depths lo-cated in the deep layer where nutrients were measured in higher concentrations compared with the upper layer of the
-1 1 0 -1 0 1 Temperature Salinity Nano-cyanobacteria-like Prochlorococcus Heterotrophic prokaryotes Nanoeuk. Syn. Picoeuk. P N Si Depth -1 1 0 -1 0 1 Temperature Salinity Nano-cyanobacteria-like Syn. Picoeuk. P N Si Heterotrophic prokaryotes Depth Prochlorococcus Nanoeuk. PC1 (30.76%) P C 2 ( 2 9 .9 9 % ) PC3 (14.10%) P C 4 ( 7 .8 3 % ) b) c) a)
Fig. 14. Hierarchical clustering illustrated for the two first principal components of the principal component analysis performed with the data
collected from stations 5 to 11 (a). According to the classification (Table 1), the sampling depths (illustrated by numbers) were separated into 5 clusters: one characterises the deep layer (Cluster 1, black), another the samples from stations 5 to 8 (Cluster 2, red), a third one the samples with a maximum of abundances (Cluster 3, green), and the two last clusters (4, blue and 5, dark blue) which characterised the southernmost stations. Cluster 5 (dark blue) focuses on station 9 where the salinity front was observed. The circle (b) displays the two first dimensions of the PCA and the circle (c) the dimensions 3 and 4.
seawater column. Cluster 2 mainly describes the northern-most stations (75 % of sampling depths collected between stations 5 and 8). Cluster 3 discriminates the sampled depths where the abundances of the enumerated organisms were maximum (station 7 at the surface and station 8 between 50 m and 75 m depths). Clusters 4 and 5 characterise the sta-tions from the salinity front to the southernmost station (86 % of the sampling depths collected between stations 9 and 11). Cluster 4 mainly describes station 9 where the salinity front was observed and cluster 5 the station where the higher
tem-perature and nanocyanobacteria-like were observed. Clus-ter 5 is significantly correlated with temperature and salinity (0.92 and 0.69, respectively).
The redundancy analysis (RDA) was applied to assess the influence of the environmental variables on the phytoplank-ton and heterotrophic prokaryote distributions (Fig. 15). The first two axes of the RDA performed on the vertical profile data explained 49 % and 33 % of the total variance respec-tively. Monte-Carlo tests for these two first canonicals axes were highly significant (p < 0.01, using 999 permutations).
Table 1. List of observations between station 5 and 11 and their
classifications into five clusters according to the PCA analysis.
Clus- Observations Latitude Sta- Depth ter (◦N) tion (m) 1 10 28.6 5 160 1 20 27.1 6 150 1 39, 40, 41 22.5 8 135, 150, 165 1 51 20.5 9 160 1 58 19.6 10 125 2 1, 2, 3, 4, 5, 28.6 5 0, 40, 60, 70, 78, 6, 7, 8, 9 80, 100, 120, 140 2 11, 12, 13, 14, 15, 27.1 6 0, 25, 60, 75, 80, 16, 17, 18, 19 90, 100, 115, 125 2 22, 24, 25, 26, 27, 24.5 7 10, 35, 40, 50, 59, 28, 29, 30, 31 60, 75, 90, 101 2 33, 36, 37, 38 22.5 8 25, 95, 110, 125 2 52 20.5 9 200 3 21, 23 24.5 7 0, 25 3 32, 34, 35 22.5 8 0, 50, 75 4 42, 43, 44, 45, 46, 20.5 9 0, 25, 50, 75, 100, 47, 48, 49, 50 120, 130, 140, 150 4 57, 59 19.6 10 100, 150 5 53, 54, 55, 56 19.6 10 0, 25, 50, 75 5 60, 61, 62, 63 17.18 11 0, 30, 45, 60
The sums of all canonical eigenvalues indicated that 93 % of the observed planktonic cluster variation were explained by the environmental variables. The first axe is negatively correlated with temperature and salinity representing the mesoscale circulation. The second axe is negatively corre-lated with nutrient concentrations which represent the differ-ent conditions between the samples collected at surface or deeper in the water column.
Partial redundancy analysis (partial RDA) was also ap-plied to the profile dataset to estimate the effects of each environmental variable on the various ultraplanktonic clus-ters. Among the six environmental variables measured during the cruise, temperature and salinity statistically contribute for 28.9 % and 19.2 % of the variation in the composition of phy-toplankton and heterotrophic prokaryotes, respectively. The sample depth solely explained 8.3 % whereas nitrate, silicic acid and phosphate explained 4.3 %, 3.6 % and 2 %, respec-tively.
4 Discussion
4.1 Spatial distribution of seawater masses in a complex system
This study differentiates the western part of the NPSG into three regions on the basis of the water mass properties (tem-perature and salinity) and environmental conditions (nutri-ents and ultraphytoplankton abundances).
Fig. 15. Correlation plot of the redundancy analysis (RDA) on the
relationships between the environmental variables and the prokary-ote and ultraphytoplankton composition determined by flow cytom-etry.
The stations located in the Kuroshio region were charac-terised by important abundances of ultraphytoplankton sup-ported by the highest concentrations of nutrients measured at the surface.
According to the Tomczak and Godfrey study, the subtrop-ical gyre water mass was identified by stations 5 to 8 between 28.98◦N and 22.83◦N (Tomczak and Godfrey, 1994). This
group of stations was isolated between the thermal front of the Kuroshio Current and the salinity front observed to the south of station 8. Similar salinity fronts have been previ-ously reported in the literature between 25.3◦N and 22.8◦N (Kitajima et al., 2009). This salinity front was demonstrated to be linked to the difference between the centre of the sub-tropical Pacific gyre water mass and the North Equatorial Current (NEC) (Tomczak and Godfrey, 1994). The salinity front observed around 22.83◦N appears to be a complex phenomenon induced by the mixing of different seawater masses. Several structures such as eddies can be observed between 20◦N and 25◦N (Fig. 1). This mesoscale circula-tion (75 km) illustrates the complex distribucircula-tion of seawater masses, as previously reported in the literature (Qiu, 1999; Aoki et al., 2002).
The temperature-salinity diagram highlights this pattern in the upper layer with different profiles between stations 7 and 8 (Fig. 5). Separation of these profiles can be in part caused by excessive evaporation which increased the salin-ity in the upper layer of station 7. Evaporation mechanism was indeed reported to drastically modify the salinity, espe-cially in the centre of the Pacific subtropical gyre (Kimura
et al., 2001). Due to the sparse information available in the literature, the notable lower salinity measured at station 8 be-tween 100 m and 130 m depths remains difficult to link to a particular seawater mass. However, several studies reported a slightly lower salinity in the upper layer around 21◦N (Ki-tajima et al., 2009; Xie et al., 2009). In the present study, the lower salinity recorded in the subsurface layer can be ex-plained in part by the vicinity of the subtropical front (STF). According to the investigation of Aoki et al. (2002), the STF is usually associated with the shallow eastward subtropical counter current (STCC). Several theories listed in Kobashi et al. (2006) try to explain the formation of the STCC, includ-ing wind stress, heat flux, Rossby waves, potential vorticity and subtropical mode water. Although subtropical mode wa-ter has the same salinity as station 8 (34.71 to 34.77; Oka, 2009), higher temperatures measured during this cruise do not match with the water mass properties measured between 100 m and 130 m depths. The core of the STCC was reported to have a potential density σO=24.5 at 23◦N and 138.5◦E
(Chu et al., 2002). These values may indicate that the STCC core was deeper than in this study. However, Kimura et al. (2001) previously showed that salinity and temperature anomalies were negative and positive, respectively at 22◦N during La Ni˜na event. Therefore, this result suggests that un-der the La Ni˜na condition, the density, as measured during the cruise, is slightly lower than the average STCC property. This difference in salinity (about 0.05) could identify the core of the STCC and explain the specific profile measured at sta-tion 8.
In the second group of stations, nutrients were depleted in the upper layer, especially in the area south of station 6, where nutrient concentrations were near the detection limit. Despite the oligotrophic conditions, a higher abundance of ultraphytoplankton was found in the second group of sta-tions with a maximum at station 8. This maximum was lo-cated just upper the low salinity record identified as the STCC and was related to the higher nutrient concentrations.
Due to the temperature being lower than 28.5◦C the third group of stations (stations 9 to 12) is referred in this study as a transition zone between the Warm pool and the sub-tropical gyre (Cravatte et al., 2009). This transition zone was characterised by a large gradient in salinity and temperature between surface and 200 m depth. Similarly to the previous group of stations, the nutrient concentrations were depleted in the upper layer. However, cell concentrations were the lowest of the transect. The transition zone was marked by the boundary in term of temperature and salinity between stations 8 and 9. From station 9 a clear decrease in salinity was observed in the layer above the thermocline. This lower salinity was usually observed in the upper layer because pre-cipitation minus annual average net evaporation was positive in this area (Lukas and Lindstrom, 1991). Between 100 m and 200 m depths the observed increase of salinity charac-terised the North Pacific tropical water (NPTW; Kimura et al., 2001).
4.2 Distribution of ultraphytoplankton assemblages and latitude
This study revealed an obvious variability in the abundance of ultraphytoplankton assemblages depending on latitude. This spatial variability confirmed that the constant olig-otrophic conditions may lead to the high variability in phyto-plankton assemblage (Mara˜non et al., 2003). Spatial distribu-tion of the dominant group of ultraphytoplankton,
Prococcus, usually paralleled the vertical distribution of
chloro-phyll a concentrations measured between the surface and 200 m depth (Figs. 9b and 10). The vertical distribution of
Prochlorococcus tends to differ from Synechococcus in the
NEC. South of 20◦N, the Prochlorococcus maximum was lo-cated in the NPTW layer where it induced a pronounced sub-surface chlorophyll a maximum (Fig. 10). Accumulation of organisms such as heterotrophic prokaryotes and
Prochloro-coccus might be favoured by the halocline. This pattern of
vertical distribution (low abundance at surface and a peak in the subsurface layer) was previously observed in the Sar-gasso Sea in summer and described as type 2 (Olson et al., 1990; Suzuki et al., 1995).
In the literature, Prochlorococcus are basically linked to stratified nutrient-depleted waters and several studies have mentioned that Prochlorococcus are absent in high lati-tude due to the low temperature and salinity (Campbell and Vaulot, 1993; Moore et al., 1995; Obayashi et al., 2001). Recently, significant relationships between Prochlorococcus and other autotrophic and heterotrophic clusters have indi-cated this segregation (Zhang et al., 2008). Results of the PCA and RDA confirmed this trend and suggest that the
Prochlorococcus distribution is more positively correlated
to temperature and salinity than the other picophytoplank-ton clusters, both in surface and in the deep layer waters (Figs. 13, 14 and 15). At station 9 in particular, the high-est salinity measured in the upper layer coincided with the maximum abundance of Prochlorococcus. The distribution of Prochlorococcus in the upper layer of this station was homogenous between the surface and down to 120 m. This type of profile observed only once during the cruise was de-scribed as type 3 in the literature and was previously reported to be most widespread between 30◦N and 30◦S (Suzuki et al., 1995; Partensky et al., 1999).
In oligotrophic conditions the primary production is usu-ally described to be linked to the regeneration of organic matter via microbial processes (Karl, 1999; Fernandez et al., 2008). Karl (1999) reported that regenerated primary pro-duction in the NPSG is 10 to 20 times greater than the new primary production. In order to identify a possible re-lationship between the autotrophic organisms and the het-erotrophic prokaryotes, we integrated the chlorophyll a con-centration and the abundance of heterotrophic prokaryotes from the surface down to 200 m depth (data not shown): re-sults revealed no clear relationship between these two pa-rameters as previously observed in other areas (Painchaud
and Therriault, 1989). However, according to the Thyssen et al. (2005) results, a positive relationship was found between the heterotrophic prokaryotes with a high nucleic acid con-tent (HNA) and chlorophyll a concentration.
The spatial distribution of Synechococcus in the Transition zone was mostly located above the maxima of
Prochloro-coccus and picoeukaryote abundances. Although surface Prochlorococcus cannot be accurately enumerated by flow
cytometry due to their dim fluorescence (due to low pig-ment content in response to the strong irradiation), our re-sults are consistent with the classical pattern and physiolog-ical properties of these microorganisms (Zhang et al., 2008; Mella-Flores et al., 2012). Mella-Flores et al. (2012) de-scribed that in contrast to Prochlorococcus, Synechococcus have developed efficient mechanisms to cope with strong light such as in the surface layer. Similarly,
Synechococ-cus were shown to have several advantages both in terms
of nitrate and phosphate uptake in depleted nutrient condi-tions (Rippka et al., 2000; Moutin et al., 2002; Michelou et al., 2011). In the subtropical gyre water mass, phosphate depleted concentrations (< 10 nM) at the surface were ex-pected to control the microorganism distributions (Kitajima et al., 2009). From stations 5 to 8, in contrast to other com-munities, the Synechococcus abundance highlighted its ca-pacity to successfully compete Prochlorococcus in nutrient depleted conditions (PCA results). Kitajima et al. (2009) re-ported similar increase in Synechococcus abundance in the north of 20◦N. They related the dominance by nanophyto-plankton cyanobacteria and Synechococcus to diazotrophy. This ability of some Synechococcus strains to fix a new source of nitrogen (dissolved N2)combined with the
signif-icant nitrogen uptake from organic compounds reported by Michelou (2009) can lead to a different gradient in abun-dance of species and in carbon biomass in this area, with consequences on the biological pump efficiency.
The fixation of dissolved N2 is an important ability
of some nanocyanobacteria to survive in both nitrate and phosphate depleted environments (Zehr et al., 2001). Ob-servations of nanocyanobacteria-like in the upper layer confirm previous investigations in the subtropical Pacific gyre (Sato et al., 2010). Although the concentrations of nanocyanobacteria-like are in the range of the abundances measured (Fig. 9e), latitudinal distribution of organisms enu-merated in this study differed from the observations of Ki-tajima et al. (2009) and Sato et al. (2010). In the NPSG, Kitajima et al. (2009) suggested that exhaustion of phos-phate at the surface is linked to a high concentration of nanocyanobacteria. However, Sato et al. (2010) suggested an opposite relationship between the high abundance of nanocyanobacteria and phosphate-replete conditions in the NPSG. On the basis of the study of Hashihama et al. (2009), Sato et al. (2010) reported that nanocyanobacteria abundance can not be linked to a front as referred from salinity or tem-perature in the NPSG. In this study, we observed that the con-centration of phosphate is very low (nanomolar level) in the
upper layer from station 7 to station 11, but the abundance of nanocyanobacteria-like is mainly located southward of sta-tion 9. Therefore, the concentrasta-tions of nanocyanobacteria-like did not coincide with the phosphate concentrations, but clearly coincided with the front of salinity observed at sta-tion 9. PCA and RDA performed on data collected both at the surface and along the vertical profiles (Figs. 13, 14 and 15, respectively) tend to statistically confirm the correlation between the salinity front, high temperature condition and high concentration of nanocyanobacteria-like. This result is in agreement with Church et al. (2008) who reported that frontal system can control the distributions of N2-fixing
ma-rine microbes in the NPSG.
4.3 Distribution of ultraphytoplankton assemblages and eddies
Along the transect studied during this cruise, several com-plex hydrographical structures such as eddies were observed and the relationship with the distribution of ultraphytoplank-ton was investigated. In the vicinity of the anticyclonic eddy A, the contribution of autotrophic clusters to the car-bon biomass integrated between 0 and 200 m revealed that nanocyanobacteria-like and picoeukaryotes at station 9 were the less important contributors (Fig. 12). Both in terms of carbon biomass and abundance, this station was dominated by Prochlorococcus. Ultraphytoplankton community numer-ically dominated by Prochlorococcus has usually been re-ported in anticyclonic eddies sampled in the Northern Hemi-sphere (Fernandez et al., 2008; Peterson et al., 2011). Using the hierarchical classification, the discrimination of the sam-pling depths suggested that the anticyclonic eddy has lead to a modification of nutrient conditions in the water col-umn. Low concentration of nutrients may suggest that the ecosystem can be supported by a microbial loop (regener-ated production) in the upper layer (Selmer et al., 1993). Consequently, high abundance of heterotrophic prokaryotes is expected in the epipelagic zone as previously reported in some anticyclonic eddies (Lasternas et al., 2013). Surpris-ingly, the lowest abundance of the heterotrophic prokaryotes in the upper layer was found at station 9 and does not seem to be linked to the chlorophyll a concentration (Fig. 11). Al-though previous investigations on the microbial community reported that high abundance of heterotrophic bacteria in the anticyclonic eddies can be explained by the senescence of the phytoplankton communities, Baltar et al. (2010) found sig-nificantly lower prokaryotic activity in the anticyclonic eddy than outside. Similarly, Lasternas et al. (2013) reported lower heterotrophic bacteria viability in the anticyclonic eddy de-spite a high release of dissolved organic carbon produced by cell lysis. Consequently, they suggested that limitation by in-organic nutrients such as phosphate can modify the viability of heterotrophic bacteria at anticyclonic eddies. Low values of N : P in the upper layer associated with the higher Si : P ratios were found at station 9. Although nutrients were at
nanomolar level in the surface layer of station 9, these values suggested that phosphate concentration is particularly low by comparison with the nutrient concentrations measured at other stations. Low concentrations of phosphate and nitrate associated with a deep thermocline may lead to the specific distribution of heterotrophic prokaryotes at anticyclonic eddy A.
In contrast, the cyclonic eddy C identified at the station 3 in the Kuroshio region tends to improve the nutrient con-ditions at surface. The nutrient enhancement, especially in nitrate and phosphate, coincided with a maximum of na-noeukaryotes. At the mesoscale level, the upward transport of water is reported to modify the composition of phyto-plankton communities in various environments (Fernandez et al., 2008; Rii et al., 2008). In the NPSG area, Rii et al. (2008) reported a slight increase of nanoeukaryote abundance in the periphery of the eddy. Similarly a previous study in the cen-tral Pacific Ocean showed that large phytoplankton groups were more abundant inside the cyclonic eddy than outside (Vaillancourt et al., 2003). During the Tokyo Palau cruise, results of microphytoplankton assemblages revealed that the highest abundance of diatoms was observed at station 3 (Gi-rault et al., 2013). Gi(Gi-rault et al. (2013) pointed out that sev-eral species, mainly diatoms, usually reported to live at the SCM were identified at the surface. These cells seem to partially use the dissolved organic phosphorus contrasting to other cells described to live in the surface layer. Difference in utilisation of dissolved organic phosphorus at the surface coupled with the thermocline dome suggested that the cold core cyclonic eddy at station 3 enhanced the phosphorus con-dition at the surface. The lowest value of the Si : P ratio calcu-lated in the Kuroshio suggested that silica (here silicic acid) is particularly used at surface of the cyclonic gyre (Fig. 7). Low Si : P ratio can result in the utilisation of the silicic acid by diatoms in the upper layer. The dominance by large phy-toplanktonic cells (nano- and microphytoplankton) were in agreement with previous observations which revealed that communities made of large phytoplankton are indeed usually promoted by the nutrient inputs in the cold core of cyclonic eddy (Vaillancourt et al., 2003).
4.4 Variability of ultraphytoplankton abundances depending on the ENSO
Previous investigations focussing on the distribution of pico-phytoplankton in the western part of NPSG were mainly con-ducted under the El Ni˜no conditions (Shimada et al., 1993; Horimoto et al., 2001; Kitajima et al., 2009). To the best of our knowledge this study during the Tokyo Palau cruise is the first report investigating the ultraphytoplankton assem-blages under marked La Ni˜na conditions (Fig. 2). While we recognise that this study focused on a single transect in Jan-uary and cannot be representative of the La Ni˜na condition in the whole Pacific, interesting results have emerged. De-spite the seasonal variability in abundance of
phytoplank-ton reported in the subtropical water (Steinberg et al., 2001), concentrations of ultraphytoplankton measured in our study are higher in the centre of the subtropical gyre than observa-tions reported in the same area. For instance the concentra-tions of Synechococcus were lower than 1 × 10⁴cells cm−3 in the subtropical area both in the studies of Shimada et al. (1993) (August–September, November–December), Ho-rimoto et al. (2001) (March) and Kitajima et al. (2009) (November–December and May–June). These concentra-tions were about a factor of 10 times lower than our results. In contrast, the concentrations of Synechococcus measured in the Kuroshio region were obviously higher than our results. By using a fluorescent microscope method, Horimoto et al. (2001) reported a concentration of Synechococcus higher than 3 × 10⁵cells cm−3 (October), and 2 × 10⁵cells cm−3 (June) at the surface of the Kuroshio Current. Similar high
Synechococcus concentrations from 29.8◦N to the
north-ernmost stations were reported in the study of Kitajima et al. (2009) (November–December and May–June). This dif-ference was also in agreement with the study conducted along the 175◦E transects in 1992 and 1993 during the strong El Ni˜no events (Suzuki et al., 1997). In their study, they noticed that a change in ultraphytoplankton abundance was characterised by high concentrations of
Prochlorococ-cus rather than SynechococProchlorococ-cus which were reported to be
in-significant by comparison with the chlorophyll a concentra-tions. In the open ocean, modifications in ultraphytoplankton communities are usually suggested to be linked to nutrient concentrations (Karl et al., 2001; Matsumoto et al., 2004; Matsumoto and Furuya, 2011). Although nutrient concen-trations at the surface were similar than the El Ni˜no condi-tions, Fig. 6 shows some patches of higher concentration of nutrients at the station 8 and north to station 6 (Kitajima et al., 2009; Hashihama et al., 2009). A possible explanation of these various ultraphytoplankton concentrations may be related to the variability in Ocean structures characterised by the El Ni˜no and La Ni˜na conditions. Contrasting con-ditions in the Ocean structures and phytoplankton distribu-tions can be enhanced by the strength of the NEC along the Equator. In the western part of the Pacific subtropical gyre the NEC bifurcates into Kuroshio Current (northward flow-ing) and the Mindanao Current (southward flowflow-ing) along the Philippine coast. The location of the bifurcation was sug-gested to vary depending on several factors including local monsoons and remote Rossby waves (Qiu and Lukas, 1996). However, bifurcation is also expected to vary seasonally and interannually in agreement with the ENSO value (Kim et al., 2004). Consequently, Kashino et al. (2009) reported that bi-furcation depending on the ENSO is an important mecha-nism able to modify the transport of the Kuroshio Current at higher latitudes. Due to the high correlation between the NEC and the Kuroshio transport Kim et al. (2004) suggested that one part of the ENSO signal of the NEC penetrates into the mid-latitude circulation through the Kuroshio Current. In the present study, the ENSO index (Fig. 2) shows that