3D-resolved targeting of photodynamic
therapy using temporal focusing
The MIT Faculty has made this article openly available.
Please share
how this access benefits you. Your story matters.
Citation
Rowlands, Christopher J et al. “3D-Resolved Targeting of
Photodynamic Therapy Using Temporal Focusing.” Laser Physics
Letters 11, 11 (September 2014): 115605 © 2014 Astro Ltd
As Published
http://dx.doi.org/10.1088/1612-2011/11/11/115605
Publisher
Wiley Blackwell
Version
Final published version
Citable link
http://hdl.handle.net/1721.1/120074
Terms of Use
Creative Commons Attribution 3.0 unported license
Laser Physics Letters
LETTER • OPEN ACCESS
3D-resolved targeting of photodynamic therapy
using temporal focusing
To cite this article: Christopher J Rowlands et al 2014 Laser Phys. Lett. 11 115605
View the article online for updates and enhancements.
Related content
The imaging and mapping of biological structures
G Filippidis, C Kouloumentas, D Kapsokalyvas et al.
-Study of the efficacy of 5-ALA mediated photodynamic therapy on human rhabdomyosarcoma cell line (RD) M Atif, M Fakhar-e-Alam, S Firdous et al.
-Nonlinear multiphoton processes in organic and polymeric materials J D Bhawalkar, G S He and P N Prasad
-Recent citations
Extracellular Matrix Containing in vitro Three-dimensional Tumor Models in Photodynamic Therapy-related Research Beata underlíková
-Breakthroughs in Photonics 2014: Spatiotemporal Focusing: Advances and Applications
C. G. Durfee and J. A. Squier
1 © 2014 Astro Ltd Printed in the UK
1. Introduction
It is broadly accepted that cancer is one of the most important medical challenges in the developed world. Cancer is the sec-ond most common cause of premature death in the USA after heart disease [1], and accounts for over $216.6 billion in direct and indirect costs per year [2]. One of the primary treatments, chemotherapy, is extremely taxing on the patient due to the tox-icity and low selectivity of commonly-used anticancer agents. While cancer cells are preferentially killed, a number of other biochemical systems in the body are negatively impacted, lead-ing to side-effects such as cognitive dysfunction, hair loss, and organ damage [3]. Photodynamic therapy (PDT) is a far more selective treatment option, wherein light is used to localize the antineoplastic effect and thereby avoid many of the downsides associated with more systemic treatment.
In PDT, a chromophore called a photosensitizer is illu-minated with specific wavelengths of light in order to cre-ate reactive radical species that genercre-ate downstream effects,
including apoptosis and necrosis in populations of cells. By controlling the administration of light to select regions of tis-sue, PDT can be carried out in just the tissue of interest, spar-ing critical nerves and organs, and preservspar-ing functionality where conventional surgery and chemotherapy would cause irreparable damage. In the ultimate limit, light administra-tion could be confined purely to selected cells, avoiding the surrounding tissue entirely. In this case, the photodynamic agent need only be optimized for factors like quantum yield, clearance rate and dark (un-illuminated) toxicity. Such con-trol would enable precise treatment of individual cells within intact tissue for pinpoint anti-cancer therapy, such as, for example, when tumor cells have extensively infiltrated sensi-tive organs such as the eye.
The method by which this light confinement is achieved in this paper is based on multiphoton absorption. This phenom-enon, first predicted by Maria Göppert-Mayer in 1931 [4], occurs when a chromophore absorbs two or more photons in a very short space of time. These photons ordinarily would not possess enough energy to cause an electronic transition in the molecule, but the combined energy of two or more photons is sufficient to do so. In this manner, absorption only occurs in regions where the photon flux is sufficiently high to permit multiphoton absorption, such as at the focal
Laser Physics Letters
3D-resolved targeting of photodynamic
therapy using temporal focusing
Christopher J Rowlands1, Jackie Wu1, Sebastien G M Uzel2, Oliver Klein3,
Conor L Evans3 and Peter T C So1,2
1 Department of Biological Engineering, Massachusetts Institute of Technology, Cambridge, MA, USA 2 Department of Mechanical Engineering, Massachusetts Institute of Technology, Cambridge, MA, USA 3 Wellman Center for Photomedicine, Harvard Medical School, Massachusetts General Hospital, Boston,
MA, USA
E-mail: [email protected] Received 2 June 2014
Accepted for publication 16 August 2014 Published 22 September 2014
Abstract
A method for selectively inducing apoptosis in tumor nodules is presented, with close- to-cellular level resolution, using 3D-resolved widefield temporal focusing illumination. Treatment times on the order of seconds were achieved using Verteporfin as the photosensitizer, with doses of 30 μg ml−1 and below. Results were achieved on both 2D and 3D cell cultures,
demonstrating that treatment was possible through approximately one hundred microns of dense tumor nodules.
Keywords: temporal focusing, photodynamic therapy, cancer, ultrafast amplifier (Some figures may appear in colour only in the online journal)
C J Rowlands et al Printed in the UK 115605 lPl © 2014 Astro ltd 2014 11
laser Phys. lett.
lPl
1612-2011
10.1088/1612-2011/11/11/115605
Letters
11
laser Physics letters
Astro Ltd
IOP
1612-2011/14/115605+7$33.00
doi:10.1088/1612-2011/11/11/115605 Laser Phys. Lett. 11 (2014) 115605 (7pp)
Content from this work may be used under the terms of the Creative Commons Attribution 3.0 licence. Any further distribution of this work must maintain attribution to the author(s) and the title of the work, journal citation and DOI.
C J Rowlands et al
2
point of a focused femtosecond pulsed laser. Elsewhere, the chances of two photons arriving at the same time is essen-tially negligible.
The use of multiphoton excitation for photodynamic therapy is not new; Fisher et al demonstrated two-pho-ton excitation of some psoralen derivatives in 1997 [5], and in 1999, König, Riemann and Fischer described their work on two-photon excitation of photofrin and 5-ALA labelled Chinese Hamster Ovary (CHO) cells [6]. Demonstration of two-photon absorption in Verteporfin and Photofrin in vitro was performed by Khurana et al in 2007 [7], and in the same year, two-photon occlusion of blood vessels in a chicken embryo was performed by Samkoe et al using Verteporfin [8]. Blood-vessel occlusion was demon-strated in mice by Collins et al, using a selection of different photosensitizers that were optimized for a high two-photon cross-section [9]. The use of different novel photosensi-tizers was also pursued by Starkey et al, who argued that xenograft tumors could be treated using two-photon excita-tion from a regenerative amplifier focused through approxi-mately 2 cm of tissue [10, 11].
Though this work is promising, the techniques used above all required the femtosecond laser focus to be scanned in the tissue, a serial process that is inherently slow. This paper describes a means of dramatically reducing the treat-ment time by exciting millions of points in parallel, using Temporal Focusing [12, 13]. The technique requires lasers with extremely high peak powers, but when the treatment time is dominated by the maximum power that can be tolerated in a tightly focused spot, temporal focusing can offer several orders of magnitude reduction in the time required to illumi-nate an area for either imaging or treatment.
Temporal focusing works by dispersing an ultrafast pulse using a grating or prism. According to the constraints of the time-bandwidth product, an ultrafast pulse must necessarily contain a broad bandwidth of different optical frequencies, which are separated from each other by the dispersive ele-ment. Once separated, the pulse duration of the separated components must be longer than the ultrafast pulse, due to the now-limited bandwidth of each pulse component. Since two-photon excitation is sensitive to the square of the light intensity [14], any two-photon effect is suppressed due to the longer effective pulse duration. Only once the pulse compo-nents are recombined using a lens (typically a microscope objective) does the ultrafast pulse reform, and even then, only at the focal plane of the microscope objective. Thus temporal focusing can project a 3D-resolved plane at the focal plane of a lens. As this excitation focal plane can be patterned, by patterning the light that strikes the grating, it is possible to individually illuminate several million diffraction-limited, 3D-resolved spots in parallel.
Our instrument is designed to project a temporal focus-ing plane approximately 700 μm × 700 μm onto a sample. Exposure times are on the order of 10 s to 30 s, which is approaching values that are clinically relevant. As an exam-ple, this exposure duration and illumination area could be suitable for the treatment of residual cancer cells in a resec-tion margin.
2. Methods 2.1. Microscope
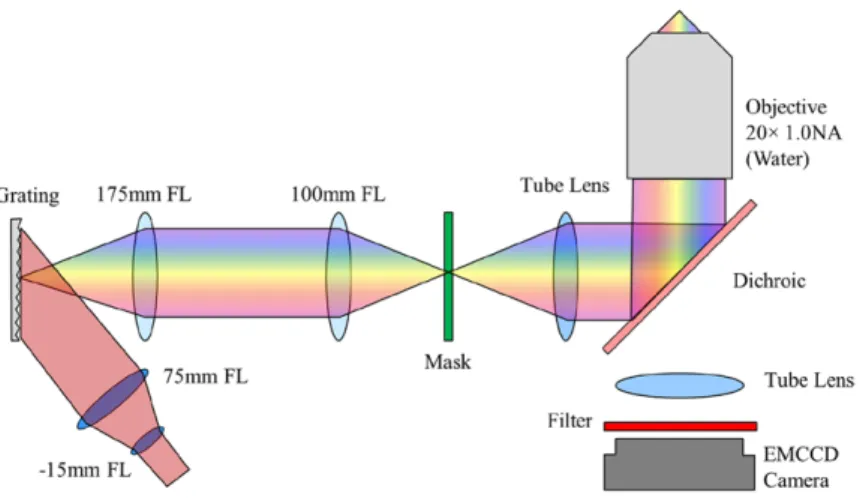
The temporal focusing system was constructed around a microscope body (Zeiss, Axiovert S100 TV) with a 20×, 1.0 NA water immersion lens (Zeiss, 421452-9880-000) mounted on a piezoelectric objective stage (Piezosystem Jena MIPOS 500 SG). The fluorescence port was modified with a tube lens (164.5 mm focal length, Zeiss, 425308-0000-000) such that the image plane lay approximately 30 mm beyond the back of the microscope. A 50 mm square 1200 lp mm−1
grat-ing (Richardson Gratgrat-ings, 53006BK02-540R) was in turn imaged onto this intermediate plane, using a 1.75 × beam reducer, consisting of 25 mm diameter 100 mm and 175 mm focal length lenses (Thorlabs, LA1050-B and LA1399-B) in a 4f configuration. A regenerative (or chirped-pulse) amplifier (Coherent, Legend Elite, seeded by a Mantis oscillator) pro-duced 130 fs pulses at 10 kHz, with a pulse energy of 0.65 mJ per pulse; power was reduced when required using a half waveplate and polarizing beamsplitter. The amplifier works by picking a single pulse from the oscillator, stretching it in time using a grating, then amplifying the pulse by several orders of magnitude in a titanium sapphire crystal located in an optical cavity. The resulting amplified pulse is then compressed back to its original pulse duration using a grating compressor.
The pulses were magnified in the vertical axis by 5 × using a Galilean cylindrical telescope consisting of a −15 mm focal length lens (Thorlabs, LK1006L1-B) and 75 mm focal length lens (Edmund Optics, 69–762), and projected onto the grating at an angle, such that the −1 order diffracted beam propagated along the optical axis of the beam reducer. The magnification ratio was chosen in order that the image on the grating was approximately circular. Total light throughput from the ampli-fier to the sample was about 10%; in order to lower the treat-ment duration as much as possible, light exposure was always performed at 550 mW average power at the sample, since this was the maximum power that could be reliably be achieved at the sample on a day-to-day basis.
The bottom port of the microscope was connected to a rotating filter holder with two filters (Semrock, FF03-525/50-25 and Semrock, FF01-630/92-FF03-525/50-25). This in turn was connected to an EMCCD (Andor, iXon 885 K) to image fluorescence from the sample. An illustration of the system can be found in figure 1.
2.2. Samples and treatment protocol
Samples consisted of OVCAR-5 ovarian cancer cells (Fox Chase Cancer Institute) either grown in 2D on a collagen-coated 35 mm glass-bottomed dish (MatTek, P35GCOL-1.5-14-C) or grown in 3D model tumor nodules [15]. Cells were cultured in T75 flasks (VWR, BD353136) in RPMI 1640 (VWR, 45000–396) with 10% fetal bovine serum (VWR, 26410-111) and 1% penicillin / streptomycin (VWR 45000– 652). Medium was exchanged every two days and cells were passaged every four days. To construct the 2D samples, 4 × 10⁴ cells were transferred into a 35 mm glass-bottomed Laser Phys. Lett. 11 (2014) 115605
C J Rowlands et al
3
dish along with 1 ml of cell-culture medium. The cells were allowed to grow, with the medium exchanged after two days. The samples were treated on day four. To construct 3D samples, the same collagen-coated dishes were covered with 100 μl of Matrigel (BD Biosciences, Growth Factor Reduced 356230) and allowed to cure at 37 °C in an incuba-tor for 30 min. Approximately 18 600 cells in 200 μl of cell culture medium were then transferred to the Matrigel surface and allowed to incubate for at least another hour to promote adhesion. Afterwards, an additional 2 ml of complete medium supplemented with 2% Matrigel was added to the dishes. Every two days the medium was exchanged for 1 ml of medium with 2% Matrigel. After 6 d, the samples had grown to approximately 100 μm in diameter, and could be treated.
Treatment with Verteporfin (Selleck Chemicals S1786) was performed in the following manner: Verteporfin powder was dissolved in dimethyl sulfoxide (Sigma Aldrich, 276855-100ML) to yield a 50 mg ml−1 stock solution. This solution
was then frozen at −20 °C until required. During treatment, the stock solution was diluted down to the required concen-tration using cell culture medium, to yield a working solu-tion. The working solution was then mixed using a vortex mixer to encourage homogeneous mixing, and placed in a sonicator for one hour to further dissolve the Verteporfin. After an hour, the working solution was placed in a water bath at 37 °C for 15 min. The medium was removed from the 35 mm dishes and replaced with 1 ml of working solution per dish. The cells were then incubated for 2 h in the case of 2D samples, and 4 h in the case of 3D samples. After incuba-tion, the working solution was replaced with 1 ml of fresh, pre-warmed medium and the dishes returned to the incubator. One at a time, the dishes were removed, and a piece of trans-parent tape affixed to the bottom of the dish to serve as a posi-tion marker. The microscope was then used to posiposi-tion the illumination plane relative to the marker, as quickly as possi-ble so as to minimize unwanted exposure of the Verteporfin to light. The samples could be accurately de-focused using the objective translation piezo-stage, and exposure duration was controlled using an automated shutter (Vincent Associates, VS25S2ZM1R3), which was, in turn, controlled using a digital I/O box (National Instruments USB-6009) and a pro-gram that was custom-written in LabVIEW 2011 (National
Instruments). After several exposures were carried out at dif-ferent positions in each sample (translating the sample sig-nificantly between exposures to avoid overlap) the dish was returned to the incubator.
2.3. Performance quantification
After approximately 8–10 h, the dishes were removed and treated with Calcein AM and Ethidium Homodimer-1 (LIVE/ DEAD stain, Molecular Probes L-3224) in pre-warmed phosphate-buffered saline (PBS) before being returned to the incubator. After a 45 min incubation period, the dishes were imaged using a conventional fluorescence microscope (Olympus IX-71, with Chroma Technology 11001v2 filter set and a Thorlabs DCC1645C camera).
Performance was quantified by automated image analy-sis. As the illumination spot was approximately Gaussian in shape, cells in the center of a given illumination field-of-view were over-exposed relative to those at the edges. As such, the diameter of the region of dead cells would provide an indi-rect metric of the degree of cell-killing. Simple cell-counting, where the number of dead (red) cells is measured versus the number of viable (green) cells was found to be inadequate for this task; 2D cell cultures had a range of surface densities, and apoptotic cells would regularly detach from the glass surface. Instead, a method was devised wherein the image was first segmented, using a Canny edge filter [16] and a watershed algorithm [17], to determine the center of all the cells present. A circle was then placed such that, to the greatest extent pos-sible, red cells were placed inside the circle and green cells placed outside. This was performed using an optimization routine written in Matlab 2011b (Mathworks). The mathemat-ical basis for the circle placement was similar to that used to determine the soft boundary in a support vector machine [18]; every cell that was on the wrong side of the boundary contrib-uted to the error metric proportional to the square of the dis-tance of the cell to the boundary. Minimizing this error metric resulted in the ‘best’ placement of the circular boundary; i.e. at the location where there was a 50% probability of a cell being alive or dead. The radius of the circle was then taken as a measure of the extent of cell-killing. An illustration of this process can be found in figure 2.
Figure 1. Illustration of the optical layout of the temporal focusing exposure and imaging system. Laser Phys. Lett. 11 (2014) 115605
C J Rowlands et al
4
3. Results and discussion
One simplistic approach to modelling PDT-induced cell death is to treat illumination light dose as a time series of accumulated damage that, once a threshold is crossed, leads to death. In this experiment, damage can assumed to be cumulative and is proportional to both Verteporfin concen-tration and total exposure duration (for a given peak power, repetition rate and wavelength). For a very simple Gaussian damage profile, derived from the incident Gaussian light intensity, and assuming Verteporfin concentration is uniform across the sample:
= − D Ae xB
2
where D is the damage, A is the value of the peak of the Gaussian function, B is a width parameter equal to twice the variance of the Gaussian function, and x is the radial distance from the peak. By rearrangement, it is possible to
determine a radius xT at which the damage D is at a
thresh-old value DT:
= − ⋅ − = ⋅
xT Bln (DT A 1) Bln (DT A) .
Since changes in exposure duration and concentration are expected, to a first approximation, to linearly affect the value of A, and since DT and B are constant for a given experiment,
the radius xT is expected to vary as the square root of the
loga-rithm of the exposure duration, Verteporfin concentration or incident light intensity.
3.1. Dose–response
Several comparisons were made in order to determine the opti-mal conditions for treatment. First of all, the effect of changing the exposure time was investigated. The 50% cell death radius was plotted as a function of exposure duration (see figure 3).
Figure 2. Illustration of the image segmentation process, showing the raw image stained using LIVE/DEAD stain (left), and the same image with the cell identification and best-fit boundary superimposed (right). Cells are segmented, and identified. Green borders indicate that the cell was classified as alive, red borders indicate that the cell was classified as dead. White borders indicate that the region was considered part of the background. The blue circle indicates the estimated boundary where cells have a 50% probability of being dead.
Figure 3. Effect of changing the duration of exposure on the 50% cell death radius. Average power at the sample was 550 mW in a Gaussian beam, and Verteporfin dose was 30 μg ml−1.
0 5 10 15 20 25 30 0 50 100 150 200 250 300 350 Exposure (s) 50% dead radius (μ m)
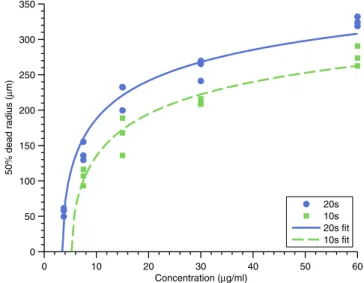
Figure 4. Effect of changing Verteporfin concentration on the 50% cell death radius for exposures of 20 s and 10 s. Average power at the sample was 550 mW. No cell killing was observed for the 10 s exposure at 3.75 μg ml−1, consistent with the line of best fit.
0 10 20 30 40 50 60 0 50 100 150 200 250 300 350 Concentration (µg/ml) 50% dead radius (µ m) 20s 10s 20s fit 10s fit
C J Rowlands et al
5
The data are broadly consistent with the fit function, despite the inaccuracy inherent in estimating the 50% cell death radius using image analysis and the simplifications inherent in the fit function itself. The data suggest that, above approximately 15 s of exposure, increases in exposure do not increase the treatable area by a large degree. Therefore, optimal exposures should be around 10 s to 20 s, if treatment speed is a concern.
A subsequent experiment characterized the dependence on Verteporfin concentration (see figure 4). Experiments were per-formed using 10 s and 20 s exposure durations. Results were consistent from experiment to experiment, with no cell killing observed for 10 s exposure and 3.75 μg ml−1 Verteporfin
concen-tration, which is consistent with the line of best fit. The intercept along the concentration axis lies at approximately 5 μg ml−1,
indicating that there should be no observable cell killing at 3.75 μg ml−1, which was observed for all three tested samples. 3.2. Patterning
Once suitable dose parameters had been established, attempts were made to characterize the axial resolution of the system, since this ultimately limits the accuracy with which cells could be killed. 2D cell cultures were treated with Verteporfin and the microscope intentionally defocused using a piezoelec-tric objective stage. The optical full-width half-maximum of the instrument, measured by translating a thin film of cent dye through the focal plane and measuring the fluores-cent intensity change for each pixel in the image, is 19 μm. The temporal focusing axial resolution can be expressed as the square-root of a Lorentz-Cauchy function [19], therefore the effect of defocusing the image is to scale the amplitude A
by a Lorentzian scale factor with a previously-measured width parameter zR: ⎛ ⎝ ⎜ ⎜ ⎜ ⎞ ⎠ ⎟ ⎟ ⎟ x B ln D A 1 1 T T z z z ( ) R 02 = ⋅ ⋅ + −
where z is the defocus distance and z0 is the
previously-measured origin. The results in figure 5 show that for short exposures, cell death due to treatment can be completely elim-inated within 25–30 μm of the focal plane; larger exposure values require a larger defocus before cell death due to treat-ment is eliminated. Care should also be taken in analyzing these results, as at the concentrations used, Verteporfin, while having a very low dark toxicity, is known to inhibit autophagy [20].Therefore in environments with increased cellular stress, the dark toxicity may change.
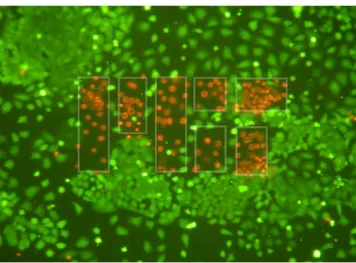
In order to demonstrate that the temporal focusing plane could be patterned, a mask was constructed by cutting holes out of aluminium foil and placed at the intermediate image plane. This pattern was then projected onto the sample. An example is given in figure 6; a mask with the MIT logo was projected onto the sample. Verteporfin concentration was 30 μg ml−1 and
exposure duration was 30 s. The increased duration was neces-sary in order to maintain the patterning fidelity at the edge of the mask, since, on account of the Gaussian intensity profile, the edges became under-exposed at shorter exposures. A ver-sion of the instrument with a uniform intensity profile in the sample plane is in development; this will eliminate the need to over-expose the center of the image in order to achieve pat-terning at the edges.
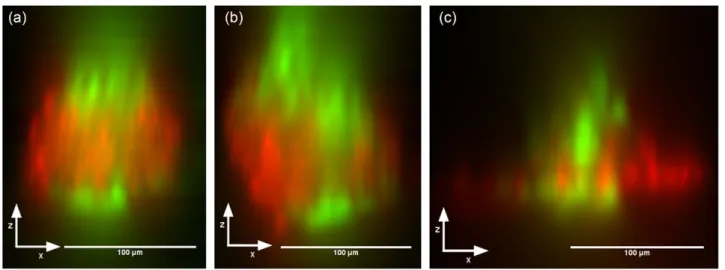
The final tests to be performed were to demonstrate that cell killing could be performed in 3D; killing a layer of cells at the center of a nodule while leaving the cells above and below the treatment plane intact. OVCAR-5 nodules were grown to a diam-eter of approximately 100 μm and then treated with Verteporfin. 3D-resolved Live/Dead stained examples of temporal focusing PDT are shown in figure 7; the images show the XZ projection of a focal stack taken along the Z axis (top to bottom in the case of the illustrated figures) using the same temporal focusing sys-tem as for treatment. The focal stack was ‘resliced’, in order to change from an XY stack to an XZ stack, and then the sum of all the pixel intensities was taken along the Y axis. The focal
Figure 5. 50% cell death radius as a function of defocus for different exposure values.
−30 −20 −10 0 10 20 30 0 50 100 150 200 250 300 Defocus (μm) 50% dead radius (μ m) 20s 15s 10s 20s fit 15s fit 10s fit
Figure 6. Demonstrating patterning of the temporal focusing plane using the MIT logo. Cells have been stained with Calcein AM and Ethidium Homodimer-1 such that cells that are alive are green, whereas cells that are undergoing apoptosis are red. White lines illustrating the mask boundary are added as a guide to the eye and are not present in the image itself.
C J Rowlands et al
6
stacks that were used to create this data are available as sup-plementary information.
The resulting images demonstrate the axial sectioning capabilities of the instrument, and may also reflect the pre-viously-known difficulty in getting Verteporfin to penetrate dense tumor nodules [15]; the edges of the tumor nodules are often very well treated, but the center is under-exposed. In addition, the Bystander effect [21, 22] will cause the apparent width of the dead layer to be larger than expected, and any subsequent movement or growth of the live cells will cause infiltration of live cells into the dead layer. The actual resolu-tion of the system is therefore likely to be better than illus-trated, and will improve even further if combined with a drug possessing better tumor-penetration characteristics.
4. Conclusion
In conclusion, 3D-resolved photodynamic therapy has been demonstrated in both 2D and 3D cell culture models. Patterning resolution is on the order of a few cells, and illumi-nation times are less than 30 s. Work is ongoing to improve the system and reduce exposure times; moving from a Gaussian spot to a top-hat beam is expected to provide considerable improvement in axial resolution, as well as more efficiently using the power from the laser. Different drugs are also being tested in order to reduce treatment times either by increas-ing the nodule penetration, the two photon cross-section, or the phototoxicity. Improving the two-photon cross-section is expected to be particularly effective, as the cross-section of current photosensitizers is poor; Verteporfin has a cross-section of approximately 50 GM (Göppert-Mayer units, 1 GM = 10−50cm4 s per photon), while potential alternatives in the
literature have cross-sections of 17 000 GM and higher [9]. Assuming the chromophores are not being saturated and that the phototoxicity of the higher cross-section photosensitiz-ers is comparable to Verteporfin, this implies a reduction in exposure time by a factor of 340, to approximately 50 ms, or similar reduction in the required photosensitizer dose. Once
treatment times are reduced below approximately 1 s, it is expected that this method will be clinically applicable, being able to selectively kill cells with extremely high precision dur-ing oncological surgery.
Acknowledgements
PTCSO acknowledges support from NIH 9P41EB015871-26A1, R01-EX017656, 5 R01 NS051320, 4R44EB012415-02, NSF CBET-0939511, the Singapore-MIT Alliance 2, the BioSym IRG of Singapore-MIT Alliance Research and Technology Center and the MIT SkolTech initiative. CJR is grateful for a Wellcome Trust MIT Postdoctoral Research Fel-lowship to carry out this research; this work was supported by the Wellcome Trust 093831/Z/10/Z. CLE and OJK were supported by an NIH Director’s New Innovator Award, grant number DP2 OD007096. Information on the New Innovator Award Program is at http://nihroadmap.nih.gov/newinnova-tor/. SGMU is funded by the National Science Foundation Science and Technology Center for Emergent Behaviors of Integrated Cellular Systems (CBET-0939511).
References
[1] Heron M 2013 Deaths: Leading Causes for 2010 (National Vital Statistics Reports vol 62)
[2] American Cancer Society 2014 Cancer Facts and Figures (Atlanta: American Cancer Society)
[3] Partridge A H, Burstein H J and Winer E P 2001 Side effects of chemotherapy and combined chemohormonal therapy in women with early-stage breast cancer JNCI Monogr. 2001 135–42
[4] Göppert-Mayer M 1931 Über Elementarakte mit zwei Quan-tensprüngen Ann. Phys. 401273–94
[5] Fisher W G, Partridge W P, Dees C and Wachter E A 1997 Simultaneous two-photon activation of type-I photody-namic therapy agents. Photochem. Photobiol. 66 141–55 [6] Koenig K, Riemann I and Fischer P 1999 Photodynamic
therapy by nonresonant two-photon excitation Proc. SPIE 359243–9
Figure 7. Sample 3D projections through the XZ plane, illustrating the axial sectioning capabilities of temporal focusing photodynamic therapy. Focal stacks were taken using the same widefield temporal focusing system as used for treatment, and were ‘resliced’ into an XZ stack. Intensities were then summed through the Y axis.
C J Rowlands et al
7 [7] Khurana M, Collins H A, Karotki A, Anderson H L, Cramb D T
and Wilson B C 2007 Quantitative in vitro demonstration of two-photon photodynamic therapy using photofrin and visudyne. Photochem. Photobiol. 83 1441–8
[8] Samkoe K S, Clancy A A, Karotki A, Wilson B C and Cramb D T 2007 Complete blood vessel occlusion in the chick chorioallantoic membrane using two-photon excita-tion photodynamic therapy: implicaexcita-tions for treatment of wet age-related macular degeneration. J. Biomed. Opt. 12 034025 [9] Collins H A et al 2008 Blood-vessel closure using
photosen-sitizers engineered for two-photon excitation Nat. Photon. 2 420–4
[10] Starkey J R, Rebane A K, Drobizhev M A, Meng F, Gong A, Elliott A, McInnerney K and Spangler C W 2008 New two-photon activated photodynamic therapy sensitizers induce xen-ograft tumor regressions after near-IR laser treatment through the body of the host mouse Clin. Cancer Res. 14 6564–73 [11] Starkey J R, Pascucci E M, Drobizhev M A, Elliott A and
Rebane A K 2013 Vascular targeting to the SST2 receptor improves the therapeutic response to near-IR two-photon activated PDT for deep-tissue cancer treatment. Biochim. Biophys. Acta 18304594–603
[12] Zhu G, van Howe J, Durst M, Zipfel W and Xu C 2005 Simultaneous spatial and temporal focusing of femtosecond pulses. Opt. Express 132153–9
[13] Oron D, Tal E and Silberberg Y 2005 Scanningless depth-resolved microscopy. Opt. Express 131468–76
[14] Svoboda K and Yasuda R 2006 Principles of two-photon excitation microscopy and its applications to neuroscience. Neuron 50823–39
[15] Evans C L, Abu-Yousif A O, Park Y J, Klein O J, Celli J P, Rizvi I, Zheng X and Hasan T 2011 Killing hypoxic cell populations in a 3D tumor model with EtNBS-PDT PLoS One 6e23434
[16] Canny J 1986 A computational approach to edge detection IEEE Trans. Pattern Anal. Mach. Intell. PAMI-8679–98 [17] Beucher S and Lantuejoul C 1979 Use of watersheds in
contour detection Proc. Int. Workshop on Image Processing pp 2.1–2.12
[18] Cortes C and Vapnik V 1995 Support-vector networks Mach. Learn. 20 273–97
[19] Dana H and Shoham S 2011 Numerical evaluation of temporal focusing characteristics in transparent and scattering media. Opt. Express 194937–48
[20] Donohue E, Tovey A, Vogl A W, Arns S, Sternberg E, Young R N and Roberge M 2011 Inhibition of autophago-some formation by the benzoporphyrin derivative verteporfin. J. Biol. Chem. 2867290–300
[21] Oleinick N L, Morris R L and Belichenko I 2002 The role of apoptosis in response to photodynamic therapy: what, where, why, and how Photochem. Photobiol. Sci. 11–21 [22] Mothersill C and Seymour C 2001 Radiation-induced
bystander effects: past history and future directions Radiat. Res. 155759–67