HAL Id: hal-02072796
https://hal.archives-ouvertes.fr/hal-02072796
Submitted on 19 Mar 2019HAL is a multi-disciplinary open access archive for the deposit and dissemination of sci-entific research documents, whether they are pub-lished or not. The documents may come from teaching and research institutions in France or abroad, or from public or private research centers.
L’archive ouverte pluridisciplinaire HAL, est destinée au dépôt et à la diffusion de documents scientifiques de niveau recherche, publiés ou non, émanant des établissements d’enseignement et de recherche français ou étrangers, des laboratoires publics ou privés.
Geochemistry of clay dunes and associated pan in the
Senegal delta, Mauritania
Abdallah Ould Mohamedou, Alain Aventurier, Raoul Caruba, Vincent Valles,
Laurent Barbiero
To cite this version:
Abdallah Ould Mohamedou, Alain Aventurier, Raoul Caruba, Vincent Valles, Laurent Barbiero. Geo-chemistry of clay dunes and associated pan in the Senegal delta, Mauritania. Arid Soil Research and Rehabilitation, Informa UK (Taylor & Francis), 1999, 13 (3), pp.265-280. �10.1080/089030699263302�. �hal-02072796�
Geochemistry of clay dunes and associated pan in the Senegal delta, Mauritania.
ABDALLAHI OULD MOHAMEDOU Faculté des Sciences et Techniques, Nouakchott, Mauritanie.
ALAIN AVENTURIER
CIRAD, Unité de Recherches et d'analyses, Montpellier, France
LAURENT BARBIERO ORSTOM, Centre de Hann, Dakar, Sénégal
RAOUL CARUBA
IRIM, Université de Nice-Sophia Antipolis, Nice, France.
VINCENT VALLES
INRA, Domaine St Paul, site Agroparc, Avignon, France
Address correspondence to Dr. Laurent BARBIERO, ORSTOM, Centre de Hann, B.P. 1386,
Dakar, Sénégal. e-mail: [email protected]
Running title: Geochemistry of Clay Dunes
ABSTRACT
Since the construction of the anti-salting Diama dam, a ressumption of aeolian deflation is observed in the Senegal delta, and particularly in the Diawling National Park. It results in the formation of many clay dunes with high salt concentrations. The soft powdery structure observed on the soil surface, affected by aeolian deflation is due to rapid salt crystallisation. In order to identify the mineralogy of the salt involved in this environment, the chemistry of soil and groundwater was studied along a transect from a pan to the associated clay dune. Equilibria computation and field and SEM observations indicated that the changes observed in the chemical facies of the solution were due to the following precipitation sequence: calcite > gypsum > halite. A progressive but significant fixing of Na+ onto the clay particles was observed. The calcite deposition in the soil was limited by exhibition of the potential acidity arising from the former mangrove site soils. It resulted in high equilibrating pCO2. This study provided to test a new extension to the Debye-Hückel law for concentrated chlorurated sodic waters. The relationship between chloride amounts and residual alkalinity concept confirmed that calcite and gypsum formation, and the exchanges between Na and Ca are the main phenomena responsible for the changes observed in the soil solution (r² = 0.99).
Keywords: Aeolian deflation, lunettes, saline soils, Senegal delta.
INTRODUCTION
In the Senegal delta, an dam was built in 1986 in Diama to prevent the sea water from flowing upstream in the valley. Since the construction of this reserve dam, clear signs of soil degradation, by increasing salinity, are observed downstream of the dam and particularly in the Diawling Park. It results of the disappearance of non-halophile vegetation, and it could induce a drastic decrease of the number of birds present seasonaly in the park. From a
pedological point of view, a massive resumption of aeolian deflation and clay dune formation is observed. This phenomenon, already noted by many authors in the region, concerns zones that continuously expand from year to year.
Aeolian deflation and clay dune formation has been studied by numerous authors in saline alluvial valleies and particularly in the deltas of West African rivers, such as Senegal and Casamance (Maymard, 1952; Tricart, 1954; Boulaine, 1954; Vieillefon, 1967; Michel, 1973; Mougenot, 1982). The phenomenon of clay dune formation was first explained by Boulaine (1954). Clay dunes develop by seasonal deflation from the pan floor at saline conditions. As the pan dries, salt concentration increases, inducing the mud to floculate to silt and sand size particles, which are then vulnerable to wind transport from the pan floor. According to Hamdi Aissa et al. (1997) this phenomenon is due to the rapid crystallisation of salt such as gypsum. The environmental conditions favouring the formation of clay dunes are very restrictive. They require a prevailing wind during the dry season, temporary saline pan conditions, and a specific clay fraction sediment. Because of these restrictive conditions, the presence of clay dune is frequently used for reconstitution of palaeoenvironment (Hills, 1952; Price, 1963; Bowler, 1973; Lancaster, 1978; Goudie and Thomas, 1984, 1985; Youg and Evans, 1986; Thomas, 1988; Thomas et al., 1993; Marker and Holmes, 1995). Bowler (1973) has identified various types of pans according to the mineralogy of salt precipitating during the concentration process. Nevertheless, although the salt has a preponderant role in this type of landscape evolution, little research has been done to determine the processes involved in the development of soil chemical characteristics. This paper is the contribution for the case of the Diawling Park.
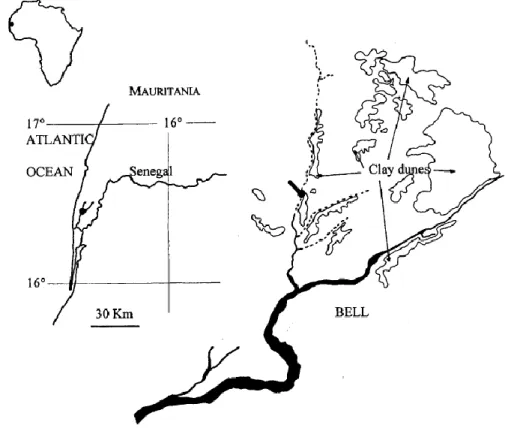
Fig. 1 - Location of the study site in southern Mauritania.
Materials and Methods Site
The study was carried out in the Diawling National Park (PND) that covers a narrow triangle between the coast and the river Senegal, in southern Mauritania (Fig.1). The park area is 16000 ha. Two permanent dunes (Birette and Ziré) and mobile dunes along the coast, from Saint-Louis in the south to the Chott-boul in the north, constitute the dominant relief in the region. The flooded area of the park is constituted by the permanently flooded Gambar basin, the OMVS (Organisation pour la Mise en Valeur du fleuve Senegal) dam reserve, the periodically flooded Bell basin whose elevation is higher than that of the Gambar, and includes an estuarian area. Fieldwork was concentrated in the Bell basin (16°20' N and 17°25' W) where the process of aeolian deflation is particularly active (Ould Mohamedou, 1998). The climate is characterized by a wet season (average annual precipitation is 170 mm) from July to September, a relatively cold dry season from October to February (19°C), and a hot dry season from March to June (37°C). Prevailing winds are from NNW during the dry season. The studied zone is lightly saline (> 7 dSm-1) and many salt efflorescences are observed. The main representative soil is Calcic Gypsic Fluvisol (FAO, et al., 1994) but many Thionic Fluvisol containing pyrite (FeS2) and jarosite [KFe3(SO4)2(OH)6] or natro-jarosite [NaFe3(SO4)2(OH)6] are observed near the remaining mangroves. The high potential acidity of these soils is observed from place to place as shown by Le Brusq et al., (1987).
The area studied is a plain generally flooded from July to September. In the beginning of the flood, the water is briny due to the salty water ascent from the creek Ncallax and salt deposition. At the end of September, the water becomes diluted with daily variations of the salinity due to the tidal influence. From November to June, salinity of water and soil increases due to the influence of intense evaporation. The wind deflation occures on dry soil and results in formation of clay dunes from the accumulation of the particles under the obstacles (mangrove gallery forests, dikes) and around the pans. This phenomenon is important because it confers gradually a singular morphology to the PND landscape.
Sampling
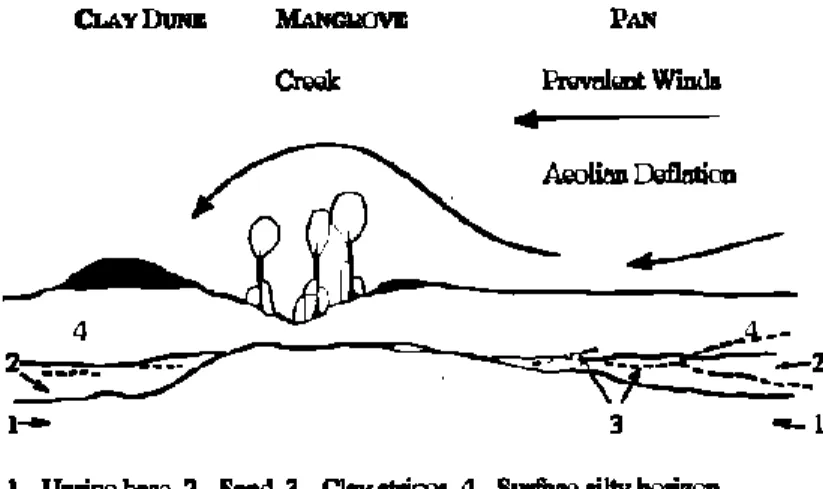
The study has been conducted on one of the clay dunes, fringing the creek Khurumbam, tributary of the creek Bell. Sampling was designed on a transect from the pan to the associated clay dune, 1.5 m high, 30 m wide and approximately 2 000 m long. The area of the pan is approximately 18 ha.
The morphology of the soil along the transect (fig. 2) has been reconstituted from 26 borings with a hand auger, and 3 pit descriptions located on lateral soil transition zones. Soil was sampled (94 samples) along this sequence, at depth ranging from 0.1 to 1.3 m. Groundwater was sampled (9 samples) in the water table.
Methods
For groundwaters, the pH, electrical conductivity and temperature were measured in the field on non-filtered samples. The samples were then filtered with 0.45 µm filter and total alkalinity was measured in the field by titrating with HCl (Gran, 1952). Solutions were extracted from the saturated pastes of soil samples in the laboratory. The extraction was performed with elevated pressure using filtration modules (Cellulose-acetate filters, 0.45 µm). The pH was measured after this filtration.
The major ions Na+, K+, Ca2+, Mg2+ and SO42- were assessed on both (groundwaters and soil extracts) using emission spectrometry (ICP) (Fassel, 1978). Automatical colorimetry with mercury II thiocyanate at 480 nm was performed for analyzing Cl- (Charlot, 1961). For saturated paste extracts, the carbonate alkalinity was derived from the chemical balance.
Salt efflorescences were collected for SEM (XL 20 Philips at 15 kV) observations, crystal indentification and analysis using fitted microprobe (LINK Analytical eXL energ y dispersive X-Ray system, Philips).
Data Analysis and Activity Coefficient Calculations.
The considerations about solution/mineral equilibrium are based on the activity calculation of chemical dissolved ions. This can be measured or estimated from analysis. Many models exist (Sposito, 1988; Schecher 1994; Vallès and De Cockeborne, 1992). Similar results are obtained for fresh or moderately concentrated solutions, but the activity calculation can be more or less erroneous in the case of brines. Two types of models are usually used to calculate the activity of ions in a solution:
Ion interaction models, which account for a large number of interactions, from short range, or distance, to long range, and thus provide accurate estimates of ion activities under strong ionic strengths ( 5). These models require many fitting parameters, which are not always available for the type of solution being studied (Pitzer, 1973, 1975; Pitzer and Kim, 1974). Ion pair models, which have the advantage of requiring no other fitting parameters than the
stability constants of the complexes considered. These models are usually built around the Debye-Hückel extension for saline solution. The Debye-Hückel law itself deals only with electrostatic interactions and gives poor results when applied to brines. Various extensions to it have been suggested. The Scatchard extention (Scatchard, 1936) is among the most commonly used. A more effective extension was recently suggested by Valles et al. (1999). It takes into account the solvent/solute interactions under strong ionic strengths. It was applied successfully to brines in southern Tunisia and Algeria (Valles et al., 1997). This model, called AQUA (Valles and De Cockborne, 1992) derived from GYPSOL (Valles and Bourgeat, 1988) was used for calculations in the present study.
Definition and Properties of the Generalized Residual Alkalinity
Alkalinity is the sum of the weak base concentrations multiplied by the number of protons each base can neutralize, minus the number of protons in the solution (Stumm and Morgan, 1970; Bourrié, 1976). In most soils, the alkalinity is generally due to carbonate species. When evaporation concentrates a solution up to calcite precipitation, two cases may arise. If the calcium equivalent is higher than the carbonate alkalinity, then the calcium molality increases and alkalinity decreases. If the calcium equivalent is less than the carbonate alkalinity, then molalities change in the opposite direction. After each mineral precipitation, the rate of concentration of the elements concerned changes. By blocking at some natural cases, i.e., when each saturation with respect to a new mineral is reached, the concentration of certain elements can decrease, increase again or simply fluctuate along the evaporation processes. The concept of residual carbonates originally derived from Eaton (1950) was later redifined in terms of residual alkalinity, and generalized to the successive precipitation of
several minerals (Beek and Breemen, 1973, Droubi et al., 1980). More recently, Valles et al. (1991) and Ribolzi et al. (1993, 1996) have shown that the generalized residual alkalinity increases propotionally to the reduction of the solution volume, as a conservative tracer.
Statistical Approach
The data underwent a principal component analysis (PCA) on the following parameters: carbonate alkalinity, K+, Na+, Ca2+, Mg2+, Cl-, SO42-. The principal component analysis was performed considering Cl- and SO42- as supplementary variables, because they are closely correlated respectively with Na+ and Mg2+.
Results and Discussion
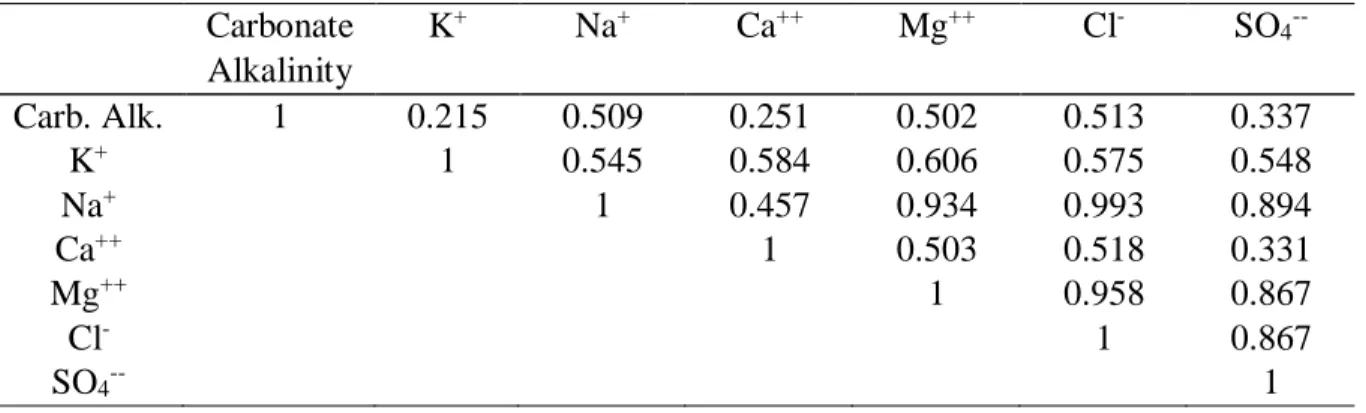
The correlation matrix (Table 1) shows a close relationship between Na+ and Cl-. They are the most concentrated elements and indicate pertinently the concentration degree of the solutions. Therefore, the main processus responsible for the chemical variability is the concentration of the dissolved elements. It indicates that all the samples belong to the same chemical family. Mg2+ is closely correlated to Na+ and Cl-, indicating that it is not strongly affected by control processes along the concentration. SO42- is less correlated to this group and could have therefore been associated to precipitation/dissolution phenomena. This hypothesis will have to be validated by the study of saturation and concentration diagrams. K+ and carbonate alkalinity are elements whose concentrations are the most controlled by physicochemical processes.
Table 1: Correlation matrix of the major ions
Carbonate Alkalinity K+ Na+ Ca++ Mg++ Cl- SO4 --Carb. Alk. 1 0.215 0.509 0.251 0.502 0.513 0.337 K+ 1 0.545 0.584 0.606 0.575 0.548 Na+ 1 0.457 0.934 0.993 0.894 Ca++ 1 0.503 0.518 0.331 Mg++ 1 0.958 0.867 Cl- 1 0.867 SO4-- 1
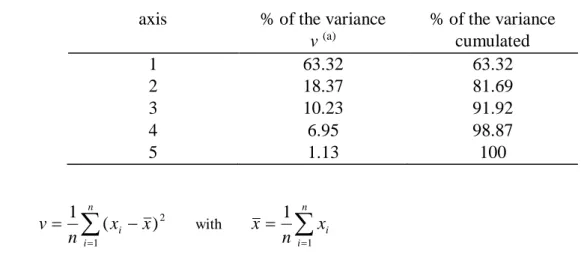
The singular values examination (Table 2) reveals that the first factorial plan is composed of axis representing 63.3% and 18.4% respectively of the variance of the scattered plot. The first axis opposes elements that are generally feebly controlled: Na+ and Cl-, possibly Mg2+, SO4 2-being equally close to this group. It indicates the global concentration of the solutions. The second axis opposes controlled elements, i.e., implied in chemical process: carbonate alkalinity and calcium. This second factor explains 18.4 % of the variance and represents the production/consumption of the alkalinity/acidity in this environment which is controlled by the sulfide oxydation studied by various authors in the Senegal delta in the Casamance valley (Le Brusq et al., 1987; Loyer, 1989). The second axis underlines the heterogeneousness of the sulfides oxidation in the sampled zone.
Table 2: Singular values of the PCA
axis % of the variance
v (a) % of the variance cumulated 1 63.32 63.32 2 18.37 81.69 3 10.23 91.92 4 6.95 98.87 5 1.13 100 (a) v n i xi x n
1 1 2 ( ) with x n i xi n
1 1 Geochemical ProcessesThe concentration of solutions varied widely. Ionic strength varied from 0.11 to 4.43. Changes in the chemical facies of the solutions were suspected as a function of the concentration factor. Salt-concentrated waters exhibited a chlorurated sodic facies whereas more salt-diluted waters exhibited a more sulfated calcic and magnesian type. The most diluted solutions had tendency to near a carbonated calcic facies. However, it appeared that the less concentrated waters could be divided into two groups, one with a chemical facies more sulphated and a little carbonated, the other with a facies less sulphated and more carbonated. This point will be discussed below with the study of the equilibrium diagrams.
Concentration Diagrams
Chloride can be used as a conservative tracer to estimate the concentration factor of each solution. This concentration factor is an underestimate if halite (NaCl) precipitates, i.e., eventually for high ionic strengh. The concentration diagrams were built under this condition, using Cl- to estimate the concentration factor.
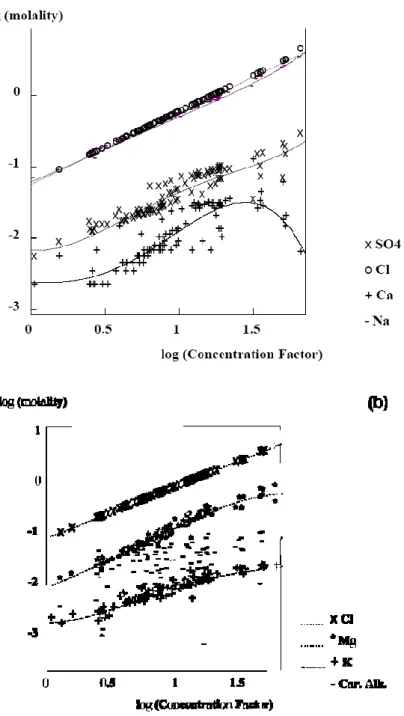
For the most salt-diluted waters, the calcium amount was higher than the carbonate alkalinity, as illustrated on the stabler diagram (Fig. 3). The calcite residual alkalinity was negative. Thus, when solutions concentrate and if calcite precipitates, the calcium molality increases, however less rapidly than that chloride ions or sodium molalities due to the calcite precipitation (Fig.4): this evolution was in agreement with the law of the residual alkalinity. However, calcite was scarcely observed in the soil excepted as shells. More investigation is necessary to estimate the part of calcite formation in the control of the carbonated alkalinity.
Fig. 4 - Concentration diagram according to Cl- as Concentration Factor.
Sulphate amount was controlled coinciding with a control in the calcium curve. It indicated gypsum precipitation. For the moderately salt-concentrated waters when the gypsum precipitated, the sum "sulfate + carbonate alkalinity" was higher than calcium amount. The calcite + gypsum residual alkalinity was positive as illustrated on Fig. 3. Thus, the sulphate molality and carbonate alkalinity increased unlike calcium, in agreement with the residual alkalinity concept.
The following precipitation stage would concern a sodic salt, chlorurated or sulfated. SEM observations on efflorescence from the pan floor or from the clay dune revealed only gypsum and halite, without sodium sulfate salt. Therefore, the following precipitation sequence, calcite>gypsum>halite was probably responsible for the main changes observed in the chemical facies.
The sodium molality appeared moderately controlled, but it increased less rapidly than Cl-. Cl->Na+ for concentrated waters, and Na+>Cl- for moderately concentrated waters. This
control of the sodium was progressive. It can be ascribed to progressive fixation of the Na+ onto clay minerals when soil solutions concentrate and become increasingly sodic. Le Brusq and Loyer (1982) and Mougenot (1982) suspected this phenomenon in the Senegal valley under similar chemical conditions. The evolution of K+ molalities along the concentration process has also to be interpretated by a fixing by the exchange complex.
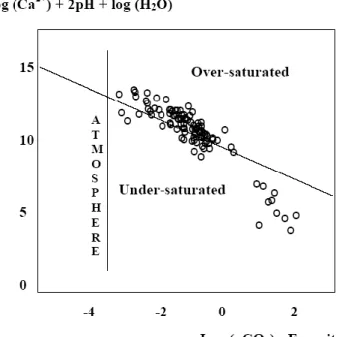
Fig. 5 - Saturation diagram with respect to calcite.
Solution/mineral Equilibrium Diagrams
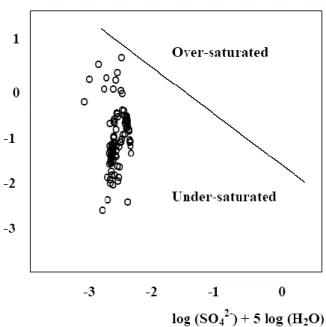
The concentration diagrams allow to interpret the changes in the chemical facies along the concentration process. These interpretations are based on the hypothesis of solution / minerals equilibrium. It is convenient to verify if these equilibria are reached. Solution saturation diagrams are shown in Figures for calcite (Fig. 5), gypsum (Fig. 6), mirabilite (Fig. 7), thenardite (Fig. 8), and halite (Fig. 9). The equilibrium with respect to calcite was reached (Fig. 5). Some samples exhibit high equilibrating pCO2, calculated from pH data and alkalinity. It can be attributed to the reaction of calcite with the potential acidity exhibited during oxidation of the soil.
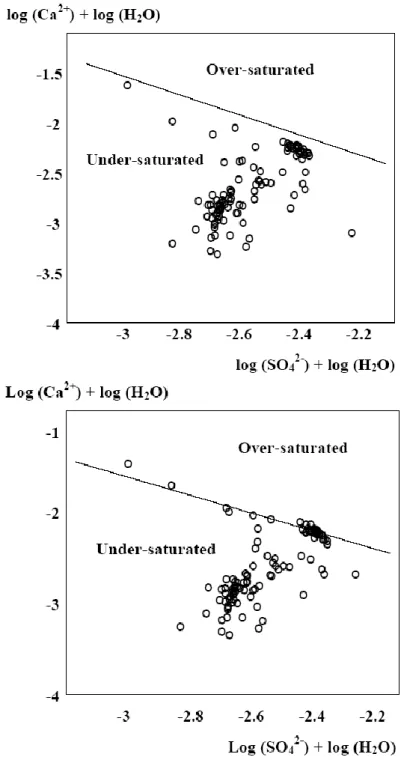
Moderately or very concentrated waters are at saturation with respect to gypsum, while diluted waters are undersaturated with respect to this mineral. The activity calculation according to the Scatchard (1936) extension for the Debye-Hückel law does not put in obviousness this equilibrium solution/gypsum (Fig. 6a). In compensation, when the solvent/solute interactions under strong ionic strengths are taken into account, using the AQUA model, the points representating moderate and very concentrated solutions are on the theoretical equilibrium (Fig. 6b). The groundwaters and soil extracts are undersaturated with respect to thenardite, mirabilite or halite (Figs. 7, 8 and 9). However, due to control of sulfate by gypsum precipitation, the equilibrium with respect to halite will probably be reached before the equilibrium with respect to sodium sulfate. It was in agreement with field and SEM observations that only revealed the presence of gypsum and halite.
Fig. 6 - Saturation diagram with respect to gypsum : a) calculation with the Scatchard extension, b) calculation with the “ Aqua ” model.
Fig. 7 - Saturation diagram with respect to thenardite.
Fig. 9 - Saturation diagram with respect to halite.
Residual Alkalinity Used as a Tracer
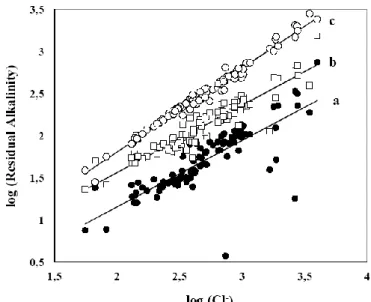
According to Ribolzi et al. (1996), the residual alkaninity (RA), derived from the identification of the different salts involved during the concentration, behaves theoretically as a tracer. In order to verify that all the precipitations responsible for the changes in the chemistry of this environment are identified, RA can be compared to amounts of chloride. A close linear relationship (RA = 1 (Cl-) + B) is expected. Fig. 10 shows the correlation between chloride amounts and RA with respect to:
a) gypsum formation,
RAgypsum = (SO42-) – (Ca2+) b) calcite + gypsum formation,
RAcalcite+gypsum = Alk. – (Ca2+) + (SO42-) c) calcite + gypsum formation + Na/Ca exchange onto the soil complex.
RAcalcite+gypsum+Na/Ca exc. = Alk. – (Ca2+) + (SO42-) + (Na+)
Fig. 10 - Relationships between residual alkalinity and chloride amounts taking in consideration : a) gypsum, b) calcite + gypsum, c) calcite + gypsum + Na/Ca exchanges.
Table 3: Relationships between Residual Alkalinity (RA) and chloride amounts Residual Alkalinity, considered components Relationship correlation Gypsum RA = 0.79 (Cl-) - 0.46 r² = 0.65 Calcite + gypsum RA = 0.80 (Cl-) - 0.04 r² = 0.86 Calcite + gypsum + Na+ / Ca++ exchanges RA = 0.996 (Cl-) - 0.18 r² = 0.99
In the first case (Fig. 10 correlation a), the relationship was fairly close (Table 3) showing that the gypsum formation was the main phenomenon responsible for the chemical variability along the concentration process. Nevertheless, some points departed from the straight correlation line. When the calcite was considered (Fig. 10 correlation b), the relationship was closer, indicating that the calcite precipitation/dissolution was involved in the chemical processes, even if the proportions were very low, in agreement with field observations. However the slope of the scattered plot differs from 1, and this value is only reached when the exchange between Na+ and Ca++ onto the soil complex are taken in consideration (Fig. 10 correlation c). In this case, the relationship between RA and Cl- amounts is closely satisfying the theoretical model. We may conclude that the processes responsible for the chemical variability in this environment have been identified.
Conclusion
In the Senegal delta, the concentration of ion solutions, under the evaporation influence, favors a resumption of the wind erosion (aeolian deflation and clay dune formation) since the construction of the Diama anti-salting dam.
Although the water of the river Senegal have a calcic-magnesian carbonated facies, the chemical evolution of the study site correspond to a neutral evolution, in agreement with the marine origin of the salt. Therefore, this type of degradation could not be related to structural effects of the alkaline facies (trona pan) but with production of sand and silt sized pelletal aggregates, induced by rapid salt crystallization, especially gypsum and halite (gypsum/halite pan, Bowler, 1973).
All the samples belonged to the same chemical family. The concentration/dilution of the dissolved elements was identified as the main process responsible for the chemical variability. The minerals precipitated in the following order: calcite > gypsum > halite. This sequence differed slightly from that described by Valles et al. (1997) in the Aures Chott Meghouane area in Algeria: calcite > gypsum > (celestite) > mirabilite > halite. A similar sequence has been described by Gueddari (1984) in the Chott El Jerid in Tunisia, in which the order was calcite > gypsum > halite > mirabilite, the latter being obtained by artificial concentration. The difference of the studied site is the calcite formation being limited by the acidity arising from the sulfide oxidation of the former mangrove sites.
References
AL DroubiA.,B.Fritz,J.Y.Gac,andY.Tardy.1980.Generalized residual alkalinity concept;
Application to prediction of the chemical evolution of natural waters by evaporation.
American Journal of Science, 280:560-572.
Boulaine, J. 1954. La sebkha de Ben Ziane et sa lunette ou bourrelet. Revue de
Geomorphologie Dynamique 5:102-123
Bourrié, G. 1976. Relations entre le pH, l’alcalinité, le pouvoir tampon et les équilibres de CO2 dans les eaux naturelles. Science du Sol 3:141-159.
Bowler, J.M. 1973. Clay dunes: their occurrence, formation and environmental significance.
Earth Science Reviews 9:315-338.
Masson, Paris.
Eaton, F.M. 1950. Signifiance of carbonates in irrigation waters. Soil Science 69:123-133 FAO, ISRIC, and ISSS. 1994. Draft World reference base for soil ressources.
Wageningen/Rome.
Fassel, V.A. 1978. Quantitative elemental analysis by plasma emission spectroscopy. Science 202, 183.
Gueddari, M. 1984. Géochimie et thermodynamique des évaporites continentales. Etude du lac Natron en Tanzanie et du Chott El Jerid en Tunisie. Mémoire des Sciences
Géologiques 76:1-143.
Goudie, A.S., and D.S.G. Thomas. 1984. Lunettes in southern Africa. Journal of Arid
Environments 10:1-12.
Goudie, A.S., and D.S.G. THOMAS. 1985. Pans in southern Africa with particular references to
south Africa and Zimbabwe. Zeitschrift für Geomorphologie 29:1-19.
Gran, G. 1952. Determination of the equivalent point in potentiometric titration. Part II.
Analyst 77, 661-671.
Hamdi Aissa, B., N. Fedoroff, and V. Valles. 1997. Short and long term soil system behaviour in hyper arid environment (a case study in the Ouargla Chott, Sahara of Algeria). International Symposium Soil System Behaviour in Time and Space, November 19-21, 1997, Vienna, Austria.
Hills, E.S. 1952. The lunette, a new landform of aeolian origin. The Australian geographer 7:1-7.
Lancaster, N. 1978. Composition and formation of southern Kalahari pan margin dunes.
Zeitschrift für Geomorphologie 22:148-169.
Le Brusq, J.Y., J.Y. Loyer, B. Mougenot, and M. Carn. 1987. Nouvelles paragenèses à sulfates d’aluminium, de fer, et de magnésium, et leur distribution dans les sols sulfatés acides du Sénégal. Science du Sol 25 3:173-184.
Le Brusq, J.Y., and J.Y. Loyer. 1982. Evolution de la salinité des sols et des eaux en relation avec la riziculture immergée dans le delta du fleuve Sénégal. ORSTOM Dakar, 45 p. Loyer, J.Y. 1989. Les sols salés de la basse vallée du fleuve Sénégal. Caractérisation,
distribution et évolution sous cultures. Etudes et Thèses ORSTOM Edt, Paris.
Marker, M.E., and P.J. Holmes. 1995. Lunettes dunes in the northeast Cape, South Africa, as geomorphic indicators of palaeoenvironmental changes. Catena 24:259-273.
Maymard,J.1952.Les sols du pseudo-delta du Sénégal. Mission d’aménagement du Sénégal, Bulletin n°5, centre ORSTOM de Dakar Hann, 58 p.
Michel, P. 1973. Les bassins des fleuves Sénégal et Gambie. Etude géomorphologique.
Mémoires ORSTOM 63, 752 p.
Mougenot, B. 1982. Etude pédologique de la cuvette de N'Thiagar, partie Nord, Delta du fleuve Sénégal. ORSTOM Dakar, 109 p.
Ould Mohamedou, A. 1998. Contribution à l’étude de l’environnement du parc national du DIAWLING (MAURITANIE). Eaux-Sols-Végétation. Ph-D Thesis, University of Nice-Sophia Antipolis, 155 p.
Pitzer, K.S. 1973. Thermodynamics of electrolytes I. Theoretical basis and general equation.
Journal of Physic Chemistry 77:268-277.
Pitzer, K.S. 1975. Thermodynamics of electrolytes V. Effects of higherorder electrostatic terms. Journal of Soil Chemistry 4:249-265.
Pitzer, K.S., and J. Kim. 1974. Thermodynamics of electrolytes IV. Activity and osmotic coefficients for 2-2 electrolytes. Journal of American Chemical Society 96:5701-5707. Price, W.A. 1963. Physicochemical and environmental factors in clay dune genesis. Journal
of Sedimentary Petrology 33:766-778.
formation de calcite en milieu méditerranéen et en milieu tropical. Arguments d'équilibre et argument de bilan. Science du Sol 31:77-95.
Ribolzi, O., V. Valles, and T. Bariac. 1996. Comparison of hydrograph deconvolutions using residual alkalinity, chloride and oxygen 18 as hydrochemical tracers. Water Research
Ressource 32:1051-1059
Scatchard, G. 1936. Concentrated solutions of strong electrolytes. Chemistry Review 19:309-327.
Schecher, W. 1994. MINEQL+: A chemical equilibium program for personal computers.
Environnemental Research Software, Hallowell, USA.
Sposito, G. 1988. SOILCHEM: A computer program for the calculation of chemical speciation in soils. Kearney Foundation of Soil Sciences. Univ. of Calif., USA.
Stumm, W., and J.J. Morgan. 1970. Aquatic chemistry - An introduction emphasing chemical equilibria in natural waters. Wiley Interscience, New York, 583 p.
Thomas, D.S.G. 1988. The nature and depositional setting of arid and semi arid Kalahari sediments, southern Africa. Journal of Arid Environments 14:17-26.
Thomas, D.S.G., P.A. Nash, P.A. Shaw, and C. Van der Post. 1993. Present Day Lunette Sediment Cycling at Witpan in the arid Southwestern Kalahari desert., Catena 20:515-527.
Tricart, J. 1954. Influence des sols salés sur la déflation éolienne en basse mauritanie et dans le delta du Sénégal. Revue de Geomorphologie Dynamique 5:124-132.
Vallès, V., and F. Bourgeat. 1988. Geochemical determination of the gypsum requirement of cultivated sodic soils I Development of the thermodynamic model “gypsol” simulating the irrigation water-soil chemical interactions. Arid Soil Research and Rehabilitation 2:165-177.
Valles, V., Y.A. Pachepsky, and A.A. Ponizovsky. 1991. Invariant criteria for irrigation water quality assesment in arid and semi arid regions. in Genesis and control of fertility of salt affected soils. ISSS Subcommission on salt affected soils Science, USSR, V.V. DOKUCHAEV Soil Institute, Moscow. pp. 330-333.
Vallès, V., and A.M. De Cockeborne. 1992. Elaboration d'un logiciel de géochimie appliqué à l'étude de la qualité des eaux. Colloque "altération et restauration de la qualité des eaux continentales", Port Leucate, 1 et 2 Oct. 1992, pp.27-30.
Vallès, V., M. Rezagui, L. Auque, A. Semadi, L. Roger, and H. Zouggari. 1997. Geochemistry of saline soils in two arid zones of the mediterranean basin. I. Geochemistry of the Chott Melghir-Mehrouane watershed in Algeria. Arid Soil
Research and Rehabilitation 11:71-84.
Valles, V., L. Auque, and P. Lopez. 1999. Proposal to extend Debye-Hückel's law to hyper-concentrated solutions, with application to the brines of the Chott El Jerid (Tunisia) and the salties playas of Aragon (Spain). Submitted for publication Chemical Geology. Van Beek, C.G.E., and N. Van Breemen. 1973. The alkalinity of alkali soils. Journal of Soil
Science 24:129-136.
Vieillefon, J. 1967. Sur l'existence de bourrelets éoliens ou lunettes dans les mangroves de casamance. in Actes
congrès panafricain de préhistoire, Dakar, 6eme session. Chambery, 436-441.
Young, J.A., and R.A. Evans. 1986. Erosion and deposition of fine sediments from playas.