HAL Id: hal-02946638
https://hal.archives-ouvertes.fr/hal-02946638
Submitted on 16 Apr 2021
HAL is a multi-disciplinary open access archive for the deposit and dissemination of sci-entific research documents, whether they are pub-lished or not. The documents may come from teaching and research institutions in France or abroad, or from public or private research centers.
L’archive ouverte pluridisciplinaire HAL, est destinée au dépôt et à la diffusion de documents scientifiques de niveau recherche, publiés ou non, émanant des établissements d’enseignement et de recherche français ou étrangers, des laboratoires publics ou privés.
Truss vs solid modeling of tendons in prestressed
concrete structures: Consequences on mechanical
capacity of a Representative Structural Volume
Ludovic Jason, Shahrokh Ghavamian, Alexis Courtois
To cite this version:
Ludovic Jason, Shahrokh Ghavamian, Alexis Courtois. Truss vs solid modeling of tendons in pre-stressed concrete structures: Consequences on mechanical capacity of a Representative Structural Vol-ume. Engineering Structures, Elsevier, 2010, 32 (6), pp.1779-1790. �10.1016/j.engstruct.2010.02.029�. �hal-02946638�
Truss vs Solid modeling of tendons in prestressed concrete structures: Consequences on mechanical capacity of a Representative Structural Volume
Ludovic JASON1*, Shahrokh GHAVAMIAN2, Alexis COURTOIS3 1 CEA, DEN, DM2S, SEMT, LM2S, F-91191 Gif-sur-Yvette, France.
2 Numerical Engineering and Consulting Services (NECS), 196 rue Houdan, 92330 Sceaux,
France.
3 Electricité de France (EDF), SEPTEN, 12-14 avenue Dutriévoz, 69628 Villeurbanne,
France.
ABSTRACT :
A comparative study is carried out on the mechanical behavior of a Representative Structural Volume of a prestressed concrete structure, using the state of the art of the numerical tools for engineers (and not the most recent developments of the academic research). The structural effect due to the presence of the tendons is carefully studied by comparing a classical truss finite element computation with a more sophisticated approach where the tendons are explicitly represented using a solid meshing. The classical approach based on truss elements appears to be poor to reliably represent the failure mode of concrete. Therefore, in some cases, it is essential to take into account both material (difference between steel and concrete stiffness) and geometrical heterogeneities through the effect of the inclusions. The well-known mesh dependency problem is also studied in this paper. For the truss simulations, contrary to the usual conclusions on bending beams for example, the mesh dependency does not only affect the position of the localized bands but also the global failure mode, questioning once again, for this particular application, the representativity of local simulations with truss elements. Finally, nonlocal calculations are carried out using the integral approach. Contrary to the well documented simulations on bending beams, the value of the characteristic length does not only affect the width of the localized bands but also the global failure mode.
1 Introduction
The validity of the models (damage and/or plasticity, fracture, … (Mazars, 1984), (Jason et al., 2006), (Ngo and Scordelis, 1967) among others) and more generally the methodology for non-linear calculations developed to capture the mechanical behavior of concrete structures must be obtained by comparing their performances with experimental results (benchmarking (Ghavamian and Delaplace, 2003) for example). The validation is generally obtained from simple tests on a small size specimen, where elementary features of models are tested(uniaxial tension or compression test for example (Gopalaratnam et Shah, 1985)). Once the model has achieved a good result in these initial evolutions, more complex structural applications can be imagined to determine its capacity to be applied on more realistic and industrially representative tests. This paper focuses on this particular subject.
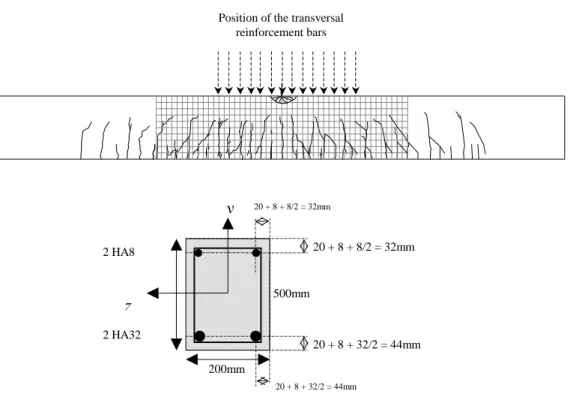
Real structural applications are generally reinforced concrete structures containing reinforcement rebars but also in some cases prestressed cables. Concrete is generally considered as a 3D brittle material while steel is included as 1D truss element with fictitious sections. This simplification eases the meshing process and decreases the computational cost. But it lacks the geometrical heterogeneity represented by the steel inclusions. The effect that this modeling choice has on the failure mode of concrete structures has rarely been investigated but experimental evidence seems to show that it may have an important role. For example, Figure 1 represents experimental results from (ECN, 2000). In this three point bending test, the crack distribution follows the repartition of the transversal steel reinforcement that plays the role of weak points. Simulations considering 1D bar elements for steel were performed on this structure but they all failed to capture this effect (Ghavamian and Delaplace, 2003) (crack spacing generally two times higher than the experimental one).
5,4 m 2,4 m 0, 5 m maille 5*5 cm2 Cycle de chargement N° 5 (0 - 90 KN) Cycle de chargement N° 6 (0 - 150 KN) Cycle de chargement N° 7 (0 - 285 KN)
Relevé de fissurations
Position of the transversal reinforcement bars 500mm 200mm 20 + 8 + 32/2 = 44mm 2 HA8 2 HA32 20 + 8 + 8/2 = 32mm z y 20 + 8 + 8/2 = 32mm 20 + 8 + 32/2 = 44mm
Figure 1. Three point bending beam. Crack distribution on the top and description of the steel distribution (on the bottom) (ECN, 2000)
To evaluate this effect, a Representative Structural Volume (RSV) has been designed. First created to validate the models developed for the simulation of mechanical behavior of containment structures (Part 1) (Jason et al, 2007), it gives the opportunity to investigate the role of steel by comparing 1D and 3D cable modeling. The idea is to quantify the influence on the global and local responses of the explicit introduction of the geometrical heterogeneity (parts 3 and 4).
Computations using softening law also exhibit a mesh dependency effect. This is a well known problem for softening model which is due to “strain localization” as mentioned in (Askes, 2000) or (Peerlings et al, 1996) among others. After microcracks processes have taken place in the first part of the inelastic behavior of concrete, a macroscopic mechanism develops in the form of a damage band. The strains tend to localize in a specific area of finite dimension. The stress response of a material point cannot be described locally but has also to
consider its surroundings in order to take into account microcracks spatial interaction. In every case, the principle of non local techniques is to include a spatial information, generally in the form of a characteristic length lc. If the experience of such techniques on some
“classical” applications is well-known and well documented (bending beam for the majority of the cases), the extension to more unusual structures is much less discussed. The Representative Structural Volume will give the opportunity to approach this point.
For example, Figure 2shows the results of local and non local simulations of a three point bending beam. In this case, even if the local simulations are mesh dependant (as expected), the failure mode remains globally the same with several cracks located at the same place. The focus of the paper (Part 5) is to investigate the influence of cable modeling (1D and 3D) on the mesh dependency and to evaluate if the same failure mode is represented despite the mesh dependency (same conclusions that have been reached for beam bending).
Local simulations Non local simulations
Figure 2. Local and nonlocal simulations for a three point bending beam (half length of the beam is represented). Dark zones correspond to the most damaged concrete elements
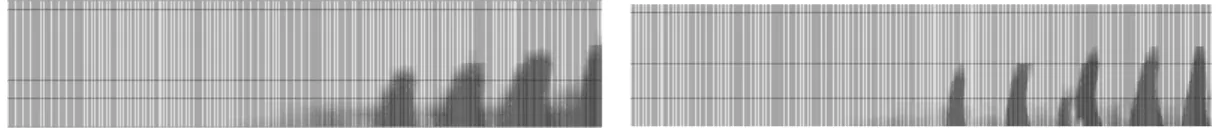
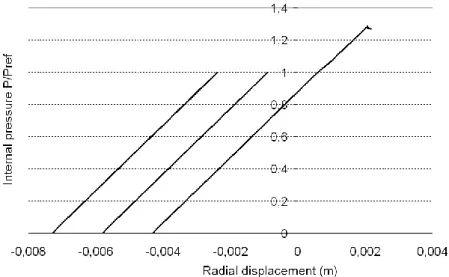
Figure 3 represents two non local simulations on beam bending considering two values of the characteristic length using the integral approach developed by (Pijaudier-Cabot et Bazant, 1987). If the length of the localized bands is different between the two simulations (as
expected as lc determines the averaging zone), the failure mode remains qualitatively the same
without any critical influence of lc . The idea is to see if for a more unusual application, the
same conclusions are still valid. This a very interesting point as no many studies have been carried out on this point and the technique to calibrate the characteristic length is not standard and generally depends on the experience of each simulation team (experimental calibration (Le Bellego et al, 2003), determination from the maximum aggregate size, or more “empirical” techniques). In part 5, the influence of the characteristic length on the failure mode of the RSV will thus be investigated.
Figure 3. Nonlocal simulations for the three point bending beam using lc = 5 cm (left) and lc = 2 cm (right). Only
half of the beam span is presented. Black zones correspond to the most damaged ones
An application where the prediction of local damage is of great importance is the case of PCCV (Prestress Pressure Containment Vessels). For these structures the study of leakage tightness and local degradation of concrete is an essential ingredient since the increase of fluid flow is strongly related to the number of cracks and their openings that can be modeled in different ways (damage permeability relation, (Picandet et al, 2001) for example). That is why it is important to make sure that computation results are capable of correctly estimating local damages which may initiate around steel rebars and tendons. The aim of this contribution is thus to investigate this mechanism in the case of a Structural Representative Volume. It is to be noted that the simulations provided in this contribution reflect the state of the art of the numerical tools for engineers but do not take into account the most recent developments of the
2 Numerical model
2.1 Presentation of the test
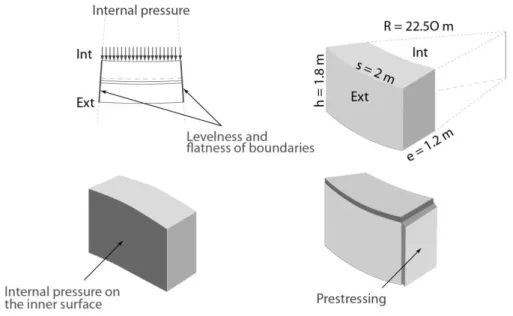
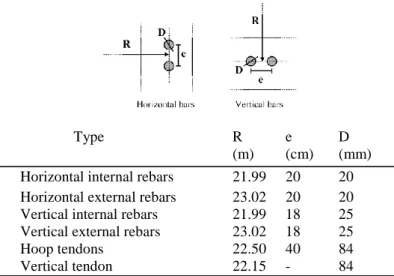
The model of the Representative Structural Volume (RSV) was initially designed to incorporate all components of real containment structures of nuclear power plants (NPP): concrete, vertical and horizontal reinforcement bars and tendons in horizontal and vertical directions. It was created to represent an experiment designed by EDF, to include only 9 horizontal and 11 vertical reinforcement bars (on both internal and external faces), 4 horizontal and 1 vertical tendons. Every steel component is modeled in this part using 1D elements. The geometry of the problem is given in Figure 4. Table 1 provides information about the steel distribution and dimensions. The cables experimentally correspond to 37T15 cables with a steel cross section of 5550 mm². It has thus been modeled with an equivalent circular steel cable of 84 mm diameter.
Type R e D
(m) (cm) (mm)
Horizontal internal rebars 21.99 20 20
Horizontal external rebars 23.02 20 20
Vertical internal rebars 21.99 18 25
Vertical external rebars 23.02 18 25
Hoop tendons 22.50 40 84
Vertical tendon 22.15 - 84
Table 1. Properties of steel rebars and prestressed tendons.
Figure 5. Definition of the finite element model indicating the boundary surfaces SG, SD, SH, SB, SE and SI.
The following boundary conditions are chosen for the simulation: face SB (bottom face) is blocked along the vertical direction and no rotations are allowed for faces SG and SD to keep the angular distance constant (Figure 5). In order to model the effect of the horizontal prestress, truss elements are anchored to faces SG and SD, then prestressed using internal forces. They are restrained to surrounding concrete elements in order to represent the prestressing technology generally applied in French structures. It is to be noted that the vertical tendon is only cast, in this particular application, to maintain the global rigidity of the structure but will not be pretensioned in order to follow the conditions of the experiment that is going to be carried out on the same system. Finally, a compressive homogeneous pressure of 1MPa is applied on SH (top face).
r
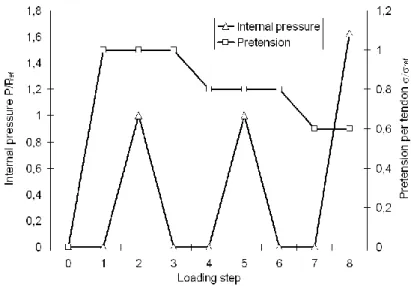
The loading is represented by a radial pressure on the internal face SI. To simplify things, the effect of gravity is not represented. Boundary conditions and loading are summarized in Figure 6. Different loadings are considered with a decrease in the initial pretension (from 100% to 60% of the initial value ref). Figure 7 illustrates the evolution of the prestress and of
the internal pressure during the simulation. The last loading consists of an increasing internal pressure until the collapse of the Representative Structural Volume.
PSH PSH
CS
Boundary conditions in stress
PSH : horizontal prestress CS : compressive stress ND ND NV Boundary conditions in displacement
ND : zero normal displacement on SG and SD
NV : zero vertical displacement on SB IP Loading IP : internal pressure z z r PSH PSH CS
Boundary conditions in stress
PSH : horizontal prestress CS : compressive stress PSH PSH CS PSH PSH CS
Boundary conditions in stress
PSH : horizontal prestress CS : compressive stress ND ND NV Boundary conditions in displacement
ND : zero normal displacement on SG and SD
NV : zero vertical displacement on SB IP Loading IP : internal pressure z z r ND ND NV Boundary conditions in displacement
ND : zero normal displacement on SG and SD
NV : zero vertical displacement on SB ND ND NV ND ND NV Boundary conditions in displacement
ND : zero normal displacement on SG and SD
NV : zero vertical displacement on SB IP Loading IP : internal pressure IP IP Loading IP : internal pressure z z z r z r
Figure 6. Boundary conditions and loading of the Representative Structural Volume
2.2 Presentation of the constitutive law
The simulations are carried out using the elastic damage law developed in its initial form by Mazars (1984) to describe the mechanical behaviour of concrete, using the finite element code Cast3m that was developed in CEA (Cast3M, 2008). It describes the constitutive behaviour of concrete by introducing a scalar variable D that quantifies the influence of microcracking. It results in a degradation of the elastic stiffness:
(1 )
ij D Cijkl kl
where ij and kl are respectively the stress and strain components, Cijkl is the fourth order
elastic tensor and D is the damage variable.
For the description of the damage growth, an equivalent strain is introduced from the local strain tensor: 3 2 1 ( ) eq i i
where <i>+ are the positive principal strains.
The loading surface g is defined by: ( , ) ( )
g d d D
where the damage variable D is also the history variable which takes the maximum value reached by d during the history of loading, D = Max/t(d, 0).
d is defined by an evolution law that distinguishes the mechanical responses of the material
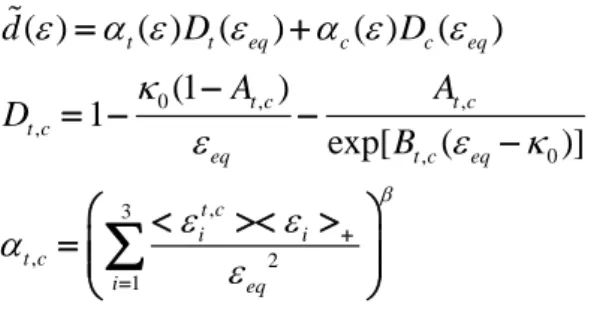
0 , , , , 0 , 3 , 2 1 ( ) ( ) ( ) ( ) ( ) (1 ) 1 exp[ ( )] t t eq c c eq t c t c t c eq t c eq t c i i t c i eq d D D A A D B
o is a parameter of the model and represents the initial threshold from which damage
grows. Dt and Dc are the tensile and compressive parts of the damage. At,c , Bt,c are four
parameters of the model. The weights t and c are computed from the strain tensor . They
are defined as functions of the principal values of the strains ijt and ijc due to positive and
negative stresses. In uniaxial tension, t = 1 and c = 0. In uniaxial compression, c = 1, t =
0. The exponent reduces the effect of damage on the response of the material under shear compared to tension.
The evolution of damage is determined by the Khun – Tucker conditions :
0, 0, 0
g d gd
For the simulations, the parameters have been chosen using the values given in Table 2. Values of 38 MPa and 3.5 MPa are obtained for the uniaxial compressive and tensile strengths respectively. To avoid the effect of the parameter “beta” in Mazars’ model, its value is kept equal to one. Parameter Young modulus (GPa) Poisson ratio o At Ac Bt Bc Value 34 0.26 1.05 10-4 0.8 1.5 10000 1390 1
3 Reference solution
The reference solution (which means the state of the art of the engineering practice consisting in using models with truss elements to represent rebars and tendons) is presented in this part. From the simulation choices presented in section 2, Figure 8 provides the internal pressure applied on the inner surface (SI) of the RSV as a function of the radial displacement of a point located at the junction between surfaces SI-SB-SD. Due to symmetry conditions, only one fourth of the RSV is modeled using linear cubic elements (Figure 9). The initial negative displacements are due to the hoop prestressing that contracts the structure to the center as a result of the boundary conditions (fixed orientation of SG and SD sides (see Figure 10)). The lower the prestress, the lower the contraction. As the internal pressure increases, the contraction gets cancelled and the structure is stretched outwards. During the last inner pressure loading, we can see that the response curve can be divided in three sections. The initial state corresponds to the application of the prestress as already mentioned. A linear behavior follows where the contraction is reduced and the structure returns to its initial rest position and expands linearly outwards. Finally, a partial unloading appears, due to heavy cracking of the structure, for which the computation has been stopped.
Figure 9. Mesh for the Representative Structural Volume. Only one fourth of the structure has been meshed
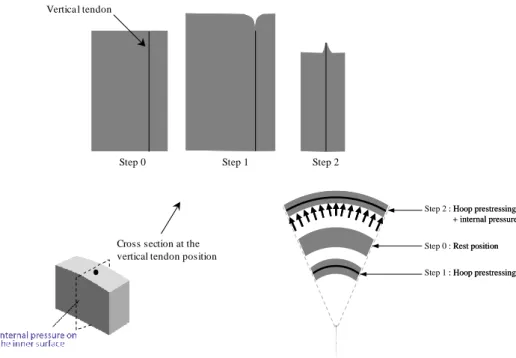
Figure 10. Radial deflection of the Representative Structural Volume through different steps (schematic). View from the top of the volume.
Very little damage appears during the application of the hoop prestressing (only in the area surrounding anchorages), and the following two sequences of pressure loading do not create any further non-linearity. Through the last loading step, localized damage bands appear on the top face (SH). Figure 11 shows the concrete damage evolution during the last sequence of the load with a rise of internal pressure. By observing the evolution of the results, it appears that the damage, initiated on the top, propagates along the vertical tendon towards the bottom of the structure. An explanation of the damage initiation can be the pinching that occurs at the top surface of the wall (SH) where the vertical tendon is anchored. In fact, even though there was no vertical prestressing in the vertical tendon, hoop prestressing and pressure loading induce vertical displacements (contraction during prestressing and dilation during pressure application). The differences between steel and concrete stiffness produce a pinching that could account for the damage initiation (see Figure 12). Damage propagation then continues along the vertical tendon as the internal pressure is increased. This could be explained by the triaxial state of the stress in the concrete surrounding the vertical tendon that brings concrete to its threshold, sooner than in the rest of the model.
Cross section at the vertical tendon position
Step 0 Step 1 Step 2
Step 0 : Rest position
Step 1 : Hoop prestressing Step 2 : Hoop prestressing + internal pressure
Step 0 : Rest position
Step 1 : Hoop prestressing Step 2 : Hoop prestressing + internal pressure
Vertica l tendon
Figure 12. Pinching at the top anchorage of the vertical tendon
4 Refined solution
4.1 Principle
As the tendon plays a key role in the initiation and propagation of damage , a new mesh is created where each tendon (horizontal and vertical directions) is geometrically represented using solid elements. The idea is to compare this approach with the one developed in section 3 in order to see if the geometrical heterogeneity, captured by this refined approach, has also an influence on the failure mode of the RSV.
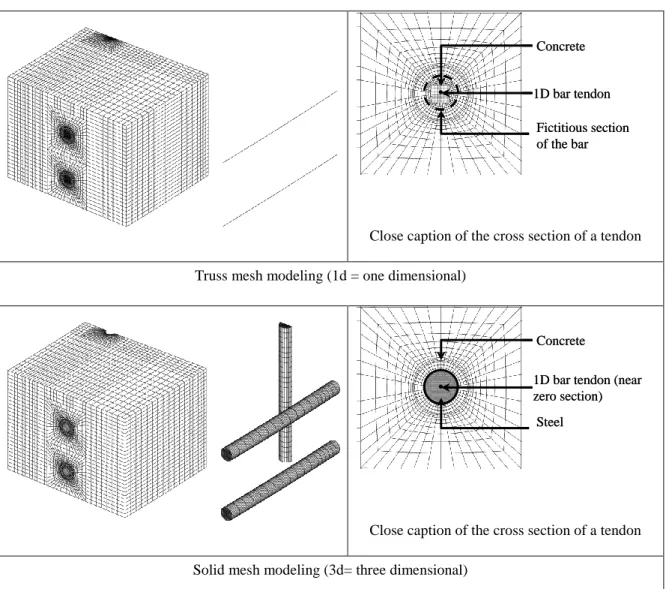
For the “truss” model (1d) presented in section 3, tendons were modeled using truss elements located at the exact center of the cross section of each cable. The surrounding mesh that geometrically represents each cable’s shape was considered to be made of concrete. In the case of “solid” model (3d) it is considered to be made of steel. The steel tendons in both horizontal and vertical directions are thus explicitly meshed. Truss elements are still present in the horizontal direction to bring prestressing but their stiffness is null (see Figure 13). In
both cases, tendons and concrete are considered perfectly bonded. This is represented in the model with nodes in common between the two materials (concrete and tendons).
1D bar tendon Concrete Fictitious section of the bar 1D bar tendon Concrete Fictitious section of the bar
Close caption of the cross section of a tendon Truss mesh modeling (1d = one dimensional)
1D bar tendon (near zero section)
Concrete
Steel
1D bar tendon (near zero section)
Concrete
Steel
Close caption of the cross section of a tendon Solid mesh modeling (3d= three dimensional)
Figure 13. Description of “truss” and “solid” models.
It has to be noted that for classical industrial applications such as silos or NPP containment vessels, the usual approach corresponds to the “truss” modeling depicted in section 3. The cost for a more refined model involving a solid representation of cables is not realistic with the current capacities of software and computers, and the skill necessary to create the mesh. In our study this was only possible because of the size of the RSV specimen.
4.2 Results of the simulations
In order to evaluate the influence on the results of how tendons are modeled, figure 17 compares the global response obtained from truss and solid analysis. This plot shows the evolution of the pressure as a function of the radial displacement, as shown in Figure 8.
Figure 14. Pressure – radial displacement curve. Comparison between 1D “truss” and 3D “solid” modeling of tendons.
No significant differences can be noticed on the global behavior (the two curves are almost the same) and the choice of the tendon modeling does not seem to have any impact on the evolution. The levels of initial radial displacements due to the prestressing are the same, as well as other characteristics of the curves, with the most important one concerning the maximum pressure of the RSV.
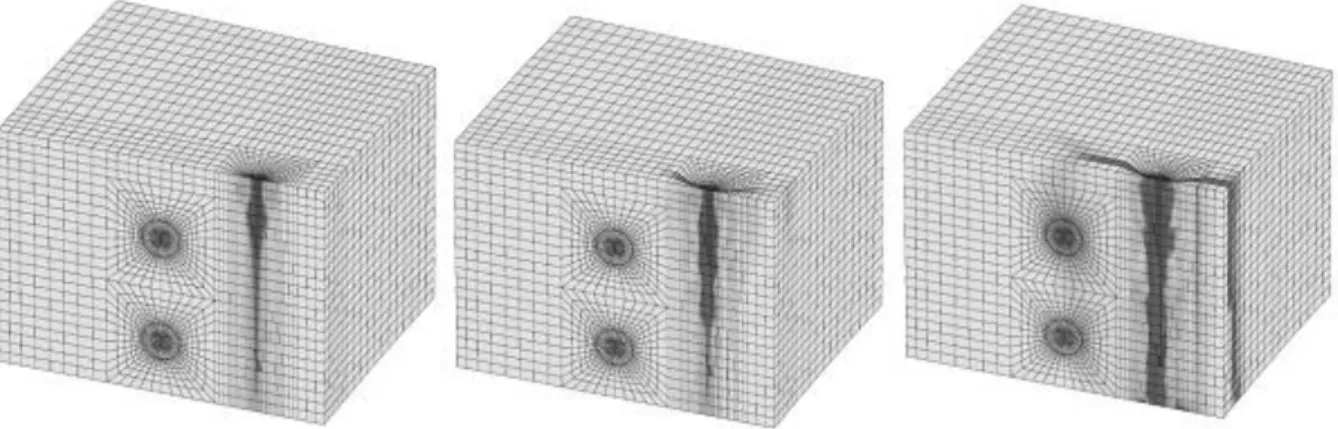
Figure 15 illustrates the damage distribution for the solid model at different loading levels. Damage first develops along the vertical tendon and then propagates in the wall following two different patterns: localized bands on the top face and development of a heavy damaged zone on the internal surface near the vertical cable. Some interactions between the vertical and
hoop tendons can also be noticed at the end of the loading. Figure 16 compares truss and solid damage distributions, where, contrary to the global behavior, clear differences can be noticed. If damage appears in both cases along the vertical cable (which plays the role of a rigid body in concrete) and propagates on the upper face along localized bands, their distribution at the end of the loading appears to be different. The damage is essentially concentrated around the vertical tendon in the truss case, whereas more complex effects appear in the other case, with damage localization on the inner surface of the wall. A certain degree of interaction with the damage developed around one of the hoop tendons is also noticed. It is important to recall that the most significant difference between these two models is the way tendons are meshed. In structural analysis where mechanical damage is important to be evaluated properly, it is essential to take into account the geometrical effect of tendons. The same conclusions were reached using an elastic plastic damage law for concrete (Jason et al, 2006), showing that these conclusions do not depend on the constitutive law.
Figure 15. “Solid” modeling: evolution of the damage at three different loading steps. Dark zones are the most damaged ones.
Truss modeling Solid modeling
Figure 16. Damage distributions for the two modeling at the end of the computation. Dark zones are the most damaged ones.
4.3 Impact of the boundary conditions
The boundary conditions used in the previous sections could correspond to an RSV near the anchorage of vertical tendons where there is no constrain on the displacement over the top face. In order to try to study the behavior of a portion of the wall which is far from all boundaries, a uniform vertical displacement condition on the top face SH needs to be applied(see Figure 5).
As previously shown, we can compare global and local results between a “truss” and a “solid” modeling.
Figure 17 shows the pressure – displacement curve for both simulations. Contrary to the previous situation, a clear difference appears in the global behavior. While the result from the “solid” modeling shows more or less the same behavior, in the “truss” modeling the evolution looks more ductile with a progressive increase of the pressure up to its failure. This difference can be explained by the evolution of the mechanical degradation (damage) illustrated in Figure 18.
Figure 17. Pressure – Displacement curve for the simulations including the uniform displacement on the top face of the RSV. Comparison between “truss” (1d) and “solid” (3D) models.
“Truss” modeling “Solid” modeling
Figure 18. Damage distributions in the RSV with uniform displacement condition on the top face. Comparison between the 1D and the 3D modeling of the tendons (respectively on the top and on the bottom). Dark zones are
With the “truss” modeling of the tendons, thanks to the uniform displacement condition, the pinching that appeared previously caused by the differences in the stiffness of the material is avoided (the vertical displacements of steel and concrete on the top face are the same). Damage thus appears to be quite homogeneously distributed on the model. On the other hand, with the “solid” modeling and the induced geometrical heterogeneity, even if the material heterogeneity is avoided (as for the “truss” approach), the distribution is variable in space and less affected by the change in boundary conditions.
It is clear from this comparison, that depending on the boundary conditions, taking into account explicitly the cables by a 3D meshing can lead to significant differences in the simulated failure mode compared to classical truss simulations. From these results, it seems that the 3D approach enables us to capture more reliable effects on this particular structure.
5 Mesh dependency and regularization
5.1 Presentation
As presented previously in the introduction, mesh dependency is a common problem which is known to be caused by the use of a softening law that produces some localization in strains and damage. This problem was well documented on classical applications like bending beams or ties but its effect is less quantified for unusual structures.
For beams, even if some regularization techniques are necessary to avoid the mesh dependency, the global failure remains qualitatively the same even if the mesh is reasonably changed (see Figure 2 for example). The idea here is to see if similar conclusions can be reached for the RSV. We decided to investigate this effect by using three different meshes with different degree of refinement (see Figure 19). This was made possible thanks to a
Gibiane script (Charras, 2000) prepared to create the meshes of this structure. These three models contain 19,845; 42,463 and 57,726 elements (respectively 171,904; 362,880 and 461,808degrees of freedom). The conditions of the simulation are those described in section 3.
Coarse Medium Fine
Figure 19. Parametric studies using three different meshes. From left to right: Coarse, Medium and Fine meshes.
5.2 Mesh dependency for truss approach
First, we investigate the mesh effect on the classical “truss” approach. The results obtained from these three non-linear analyses indicate that the global pressure-deflection response of the model remains unchanged (see Figure 20). Only very slight differences can be seen with a zoom on the very last loading step where models are quite damaged but the three curves are almost the same. Things are different if we consider local results such as the damage distributions (Figure 21). A cross examination between the results indicate that in all cases damage initiates from the top surface and propagates downwards along the middle plane containing the vertical tendon. But the distributions vary more or less significantly with the mesh discretization:
- Coarse mesh: damage values are less intense but cover a wider area.
- Fine mesh: quite similar to medium, with a wider spreading close to the lower hoop tendon.
The conclusion is that because of the well – known localization problem of softening material law there is a clear mesh dependency Nevertheless, and contrary to the behavior of beams on which the mesh dependency is generally studied, this effect also induces a difference in the global failure mode of the structure.
Figure 20. Pressure – displacement curves for the three mesh densities
5.3 Mesh dependency for solid modeling
If one considers that a solid meshing of tendons provides more reliable results, we can then carry out the same mesh sensitivity analysis. As in the case of “truss” modeling, the global mechanical behavior is not influenced by the mesh (same level of initial prestress and similar maximum value of the peak pressure).
Figure 22 shows the damage distributions for the three meshes. The results indicate mesh dependency especially for the localized bands on the top face but contrary to the “truss” approach, we can notice that the failure mode remains quite the same regardless the mesh. Differences observed between medium and fine meshes (see Figure 2) are mainly due to the fact that results for such high nonlinear state do not exactly correspond to the same loading time step. Some mesh dependency is also observed, and can be explained by the softening feature of the concrete constitutive law.
In conclusion, contrary to the “truss” modeling using solid elements for tendons allows us to avoid strong failure mode sensitivity to mesh discretization. In this way, the 3D modeling of tendons seams to provide more reliable results in predicting the failure mode.
Figure 22. Damage distribution at the end of the loading for solid modeling (Dark zones correspond to the most damaged elements). This figure highlights the mesh dependency.
5.4 Non local simulation
To further investigate the study about mesh dependency a non-local approach has been used since the mesh of the RSV is fine enough.. The technique is based on the work proposed in (Pijaudier-Cabot and Bazant, 1987). It consists on replacing the local equivalent strain eq
used in the isotropic damage model described in section 2.2. by its non-local counterpart eqnl. This is classically defined by the following equations:
1 ( ) ( ) ( ) ( ) nl eq eq r x W x s s ds V x
( ) ( ) r V x W x s ds
2 2 ( ) exp( ) c x s W x s l where lc is the characteristic length and corresponds schematically to the length on which the
local equivalent strain is averaged.
This technique can be used in this contribution because the mesh around the tendons is fine enough to allow three elements to be included in the characteristic length (lc is generally equal
to a couple of centimeters). It is not the case for most classical industrial applications for which the mesh is too coarse to imagine using such an approach.
The idea of these calculations is to see if the choice of the characteristic length only changes the length of the localized bands but does not affect the global failure mode, as observed for a bending beam. This point is significant as no standard method is used to determine the appropriate value of this variable.
Figure 23 shows the damage distributions for different values of the internal length, considering the medium mesh with 3D elements for the tendons. A great influence of the value of lc can be noticed.
lc= 0.01 cm lc= 2.5 cm lc= 5 cm
Figure 23. Damage distributions for non-local simulations for different characteristic lengths (“solid” modeling).
As expected, if the internal length approaches small values the results correspond to the local computations. Higher values for the internal length will force the algorithm to spread the damage over a wider volume of concrete . As a result the damage is no more localized on the width of an element but on a zone whose size depends on the value of lc. If this technique is
known to avoid mesh dependency, it is also responsible for a change in the failure mode. For example, for lc equal to 5 cm, which is quite an appropriate value for concrete, the damage is
almost homogenized on the whole volume and a fast increase in the mechanical degradation is observed compared to the local calculations. Even for a value of 2.5 cm, damage develops in a very different way with a zone of heavy damage that propagates almost symmetrically between the two parts of the vertical tendons. It should be noticed that the change in the internal length also affects the value of the peak position in pressure: from 0 to 2.5 cm the
result changes by 4.8% and from 0 to 5 cm the results changes by 6.7% The higher the internal length the more homogeneous is the spreading of damage.
Contrary to the conclusions on bending beam or ties for example, the value of the internal length has a great impact on the failure mode of the structure.. It seems thus that a characterization technique of the variable (or of its evolution, (Pijaudier-Cabot et al, 2004)) from usual material or structural properties (aggregate size but also probably structural sizes like the diameter of the bars) should be proposed to avoid a dependency of the failure mode of unusual structures.
6 Conclusions
A comparative study was performed on a Representative Structural Volume in order to evaluate the influence of the 1D truss modeling of tendons on the failure mode of the structure. It showed that taking into account both material and geometrical heterogeneity through an explicit 3D modeling of the bars it’s essential in some cases if a representative failure mode wants to be captured, depending on the choice of the boundary conditions. The classical 1D “truss” approach may thus be insufficient and may lead to an incorrect distribution of the mechanical degradation. This point is clearly underlined when the effect of the difference in the material stiffness vanishes due to the choice of the boundary conditions (uniform vertical displacement on the top face for our case).
The well-known problem of the mesh dependency was also investigated in the case of our RSV. Classical and well-documented conclusions on bending beams (mesh dependency of the width of the localization bands but no dependence of the global failure mode) were not reproduced in this study if the “truss” modeling is chosen : the global failure of the structure is also dependant on the mesh, questioning the representativity of the local calculations, even to
meshing of the cables enables in our case to limit this effect and to reproduce a failure mode which globally remains the same independently from the mesh.
The conclusions of the first part of this study show that a 3D modeling of the tendons leads to more reliable results. It focuses on the necessity of modeling the reinforcement and prestressed elements carefully if a misevaluation of the failure mode wants to be avoided. Nevertheless, as the 3D explicit modeling is not adapted with industrial applications (computational costs and meshing efforts), the use of “multi-scale” approaches should be investigated.
Concerning the regularization techniques (integral method for this paper), and once again contrary to the classical conclusions reached on bending beams, the failure mode is heavily dependant on the value of the characteristic length, even in the range of values which is usually accepted (from 2 to 5 centimeters). lc does not only influence the width of the
localization bands (as for bending beams for example) but also, in our case, changes the global failure mode. Once again, if a correct distribution of the mechanical degradation wants to be achieved , particular care must be given to the calibration of this parameter. It is a point of importance as, up to now, no standard method is used to choose the value of lc.
Both points should be taken into account, especially in situations where the local degradation of concrete is an essential ingredient to evaluate the capacity of a structure. It is the case for PCCVs for example where the leakage could be directly influenced by the damage through a damage – permeability relation: a poor description of the damage variable could lead to a wrong evaluation of the weakest zones (Figure 24)
Wide area of highly damaged concrete Strongly localized damaged concrete
Consequences on the leakage
tightness of the wall ? K3D108K1D
On this zone :
0 0
log(K) with and K K the intrinsic and intial permeability
K 1D 3D + changes in the leakage mode
Figure 24. Illustrations of the influence of the mechanical damage on the permeability using truss (K1D) or solid
(K3D) elements. The damage – permeability relation is an exponential law as described in (Jason et al, 2007)
7 Acknowledgments
The authors would like to thank Dr. Lucian ILIE for his help in the design of the first mesh that was used in the preliminary computations on the Representative Structural Volume. The first author also thanks Prof. G. Pijaudier-Cabot for the helpful discussions concerning the first part of this paper. Partial financial support from EDF is also gratefully acknowledged.
8 References
Askes H., Advanced spatial discretisation strategies for localized failure. Mesh adaptivity and meshless methods, PhD Thesis, Delft University of technology, 2000
ECN, Experimental Report on a three point bending beam, Ecole Centrale de Nantes, 2000 Jason, L., Huerta, A., Pijaudier-Cabot, G., Ghavamian, S., An elastic plastic damage
formulation for concrete: application to elementary tests and comparison with an isotropic damage model. Computer Methods in applied Mechanics and Engineering, Vol. 195, 52, pp. 7077-7092, 2006
Jason, L., Pijaudier-Cabot, G., Ghavamian, S., Huerta, A., Hydraulic behaviour of a Representative Structural Volume for containment buildings, Nuclear Engineering and Design, Vol. 237, 12-13, pp. 1259-1274, 2007
Ghavamian, S., Delaplace, A., Modèles de fissuration de béton – Projet MECA, Revue Française de Génie Civil, Vol. 7, 2003
Gopalaratnam V.S., Shah S.P., Softening response of plain concrete in direct tension, ACI Journal, 1985, pp. 310-323
Le Bellego C., Dubé J.F, Pijaudier-Cabot G., Gérard B., Calibration of nonlocal damage model from size effect tests, European Journal of Mechanics A/Solids, 22, 2003, pp.33-46 Mazars, J., Application de la mécanique de l’endommagement au comportement non linéaire
et à la rupture du béton de structure, PhD thesis, Paris VI University, 1984
Ngo, D., Scordelis, A.C., Finite element analysis of reinforced concrete beams, Journal of the American Concrete Institute, Vol. 64, 1967, pp 152-163
Peerlings, R.H.J., De Borst, R., Brekelmans, W.A.M., de Vree, J.H.P., Gradient enhanced damage for quasi brittle materials, International journal for numerical methods in engineering , Vol. 39, 1996, pp. 3391-3403
Picandet, V., Khelidj, A., Bastian, G., Effect of axial compressive damage on gas permeability of ordinary and high performance concrete, Cement and Concrete Research, Vol. 31, 2001, pp. 1525-1532
Pijaudier-Cabot, G., Bazant, Z.P., Nonlocal damage theory, Journal of Engineering Mechanics, Vol. 113, 1987, pp. 1512-1533
Pijaudier-Cabot G., Haidar K., Dubé J.F, Nonlocal damage model with evolving internal length, International Journal of numerical and analytical methods in geomechanics, 28, 2004, pp.633-652