HAL Id: hal-02339296
https://hal.archives-ouvertes.fr/hal-02339296
Submitted on 30 Oct 2019
HAL is a multi-disciplinary open access
archive for the deposit and dissemination of
sci-entific research documents, whether they are
pub-lished or not. The documents may come from
teaching and research institutions in France or
abroad, or from public or private research centers.
L’archive ouverte pluridisciplinaire HAL, est
destinée au dépôt et à la diffusion de documents
scientifiques de niveau recherche, publiés ou non,
émanant des établissements d’enseignement et de
recherche français ou étrangers, des laboratoires
publics ou privés.
Identifying and visualizing variability in object-oriented
variability-rich systems
Xhevahire Tërnava, Johann Mortara, Philippe Collet
To cite this version:
Xhevahire Tërnava, Johann Mortara, Philippe Collet. Identifying and visualizing variability in
object-oriented variability-rich systems. the 23rd International Systems and Software Product Line
Confer-ence, Sep 2019, Paris, France. pp.231-243, �10.1145/3336294.3336311�. �hal-02339296�
Identifying and Visualizing Variability in Object-Oriented
Variability-Rich Systems
Xhevahire Tërnava
[email protected] Sorbonne Université, UPMC, LIP6,Paris, France
Johann Mortara
johann.mortara@univ- cotedazur.frUniversité Côte d’Azur, CNRS, I3S, Sophia Antipolis, France
Philippe Collet
philippe.collet@univ- cotedazur.fr Université Côte d’Azur, CNRS, I3S,Sophia Antipolis, France
ABSTRACT
In many variability-intensive systems, variability is implemented in code units provided by a host language, such as classes or functions, which do not align well with the domain features. Annotating or creating an orthogonal decomposition of code in terms of features implies extra effort, as well as massive and cumbersome refactoring activities. In this paper, we introduce an approach for identifying and visualizing the variability implementation places within the main decomposition structure of object-oriented code assets in a single variability-rich system. First, we propose to use symmetry, as a common property of some main implementation techniques, such as inheritance or overloading, to identify uniformly these places. We study symmetry in different constructs (e.g., classes), techniques (e.g., subtyping, overloading) and design patterns (e.g., strategy, factory), and we also show how we can use such symme-tries to find variation points with variants. We then report on the implementation and application of a toolchain,symfinder, which automatically identifies and visualizes places with symmetry. The publicly available application to several large open-source systems shows thatsymfinder can help in characterizing code bases that are variability-rich or not, as well as in discerning zones of interest w.r.t. variability.
CCS CONCEPTS
•Software and its engineering → Software product lines; Ob-ject oriented development; Reusability.
KEYWORDS
Identifying software variability, visualizing software variability, object-oriented variability-rich systems, tool support for under-standing software variability, software product line engineering
1
INTRODUCTION
Variability-intensive software systems are now the usual demand in many industry sectors. To manage their variability within a spe-cific domain, software product line (SPL) engineering is the usual methodological process for developing them together. At the do-main level, the variability of these products is commonly described in terms of their common and variable features, as reusable units, in a feature model [28]. Further, in a forward engineering approach, their features are realized in different software assets, including reusable code assets at the implementation level.
In many variability-rich software systems, which do not follow a complete SPL approach, variability is implemented with different traditional techniques, such as inheritance, parameters, overload-ing, or design patterns [9, 22, 56]. By these techniques, variability
is implemented in code units provided by a host language, such as classes or functions, which do not align well with domain features. Therefore, occasionally and orthogonal to this main decomposition, some approaches are used for annotating (e.g., using preproces-sors in C [37]) or putting into separate modules (e.g., with feature modules [6]) all lines of code that belong to each specific domain feature [7, 53]. But, while annotations in the form of conditional compilations have received significant attention, their use is often criticized for the code pollution due to#ifdef-s [35, 54] and for the occurrence of syntactic and semantic errors during the prod-uct derivation [31]. Feature modularization being considered as desirable, it still implies massive refactoring activities and cannot handle the fact that many variability dimensions become natu-rally cross-cutting concerns in code [29, 57]. Currently, it is thus acknowledged that there is still no satisfactory approach to well structure the implementation of variability in code assets [6, 42].
Our work thus takes the assumption that, in many variability-rich systems, one can keep unchanged the main decomposition of code and still be able to map the domain features to the variability implementation places in code assets. We consider that these vari-ability places can be centers of attention in terms of design, with several implementation techniques used together. They can also be abstracted in terms of variation points (vp-s) with variants1[6], but a proper identification of the variability implementation places is then needed. There are studies on how to address variability by traditional techniques [11, 22, 46, 56], or on how to partially locate and identify domain features, mainly at the code level [8, 16, 50]. Nevertheless, there is a complete lack of approaches to identify variation points and variants [39] implemented with different tech-niques in a single variability-rich system. This could be due to the fact that each traditional technique differently supports the imple-mentation ofvp-s with variants [39, 58]. Therefore, from a reverse perspective, it indicates that eachvp requires its own way to be identified in code assets, depending on the used technique.
Herein, our contribution is threefold. First, we reuse the property of symmetry (Section 2.2), which has been previously explored in software [12, 24, 65–67]. From an interdisciplinary combination of software and civil engineering, it is used to describe some relevant and heavily used object-oriented techniques, as well as software design patterns (Section 3.1). Then, by using their property of sym-metry, we propose an approach to identify the implementation of different kinds ofvp-s and variants in a unified way (Section 3). Thirdly, we presentsymfinder, a tool support for automatic identi-fication and visualization of the described symmetries, so that the determination ofvp-s with variants is facilitated (Section 4).
1
1 /* Class level variation point, vp_Shape */ 2 public abstract classShape{
3 public abstractdouble area();
4 public abstractdouble perimeter();/*...*/ 5 }
6 /* First variant, v_Rectangle, of vp_Shape */ 7 public classRectangleextendsShape { 8 private finaldoublewidth,length; 9 // Constructor omitted
10 publicdouble area() { 11 return width*length; 12 }
13 publicdouble perimeter() { 14 return 2 * (width+ length); 15 }
16 /* Method level variation point, vp_Draw */ 17 /* First variant of vp_Draw */
18 publicvoiddraw(intx,inty) { 19 // rectangle at (x, y, width, length) 20 }
21 /* Second variant of vp_Draw */
22 publicvoiddraw(Point p) {// Point defined 23 // rectangle at (p.x, p.y, width, length) 24 }
25 }
26 /* Second variant, v_Rectangle, of vp_Shape */ 27 public classCircle extendsShape{
28 private finaldoubleradius; 29 // Constructor omitted 30 publicdouble area() {
31 return Math.PI* Math.pow(radius, 2); 32 }
33 publicdouble perimeter() { 34 return 2 *Math.PI* radius; 35 }
36 }
Listing 1: Example of variability implementations. The high-lighted class and methods with a yellow color represent two vp-s, at the class and method level, respectively
We applied our tooled approach in eight real open-source variability-rich software systems (Section 5)2. We report on the identified symmetries and their relatedvp-s and variants, showing that the toolchain, with its visualization support, helps in finding relevant patterns of implemented variability. We also gain more insight into the studied systems by using two metrics on the density and number ofvp-s. Finally, we discuss threats to validity, limitations (Section 6), related work (Section 7), and conclude the paper by evoking future work (Section 8).
2
BACKGROUND
2.1
Variability in reusable code assets
Let us consider an illustrative example with a Java implementa-tion of a family of geometric shapes, such as rectangles and circles (cf. Listing 1). What is common from Rectangle and Circle is factorized into the abstract classShape using inheritance as a vari-ability implementation technique. Besides, overloading is used to implement the two ways for drawing the shapes, namely thedraw()
2
The links to thesymfinder experimental results (screenshots, explanations, online demo) and thesymfinder public source code are given in Appendix A
method inRectangle, lines 17–20 and 21–24. Despite its small size, we consider this example as representative of reusable code assets in which several techniques are used together, such as inheritance, overloading, or design patterns.
Regardless of the programming paradigm (e.g., object-oriented or functional), these reusable code assets consist of three parts: core, commonalities, and variabilities [11]. The core part is what remains of the system in the absence of any particular feature, namely the assets that are included in any software product within an SPL [61]. Commonality is a common part of the related variant parts, which are used to distinguish the software products within an SPL. After the commonality is factorized from the variability and implemented, it becomes part of the core [61], except when it represents some optional variability [59]. Such commonalities and variabilities are usually abstracted in terms of variation points (vp-s) with variants, respectively, which are related to concrete elements in reusable code assets.
By definition, a variation point identifies one or more locations at which the variation will occur, while the way that a variation point is going to vary is expressed by its variants [27]. In Listing 1, classShape is common, thus a variation point, for two variants Rectangle and Circle.
2.2
Local symmetry and centers
Symmetry is recognized as one of the ideas by which people through the ages have tried to comprehend and create order, beauty, and the perfection of forms [25]. In physics, and generally in natural sci-ences, the symmetry of an object is defined as a transformation (e.g., reflection, rotation, translation) that leaves the object seemingly unchanged [55], or it isthe immunity to a possible change [48, 49]. For example, let us consider a square of definite size and orientation as in Figure 1a. The square will remain the same according to eight symmetries, if it is rotated in the plan, about the center, for 0°, 90°, 180°, and 270°, or reflected by a mirror on the shown four axes.
a b c
Figure 1: a: The eight symmetries of the square. Two ver-sions of an 11x15 array of 69 black and 96 white square blocks - b: a random one and c: a Seljuk pattern [1, p68].
Whenever an overall symmetry is broken, it just creates other local symmetries in the sense that the symmetry is reduced or redistributed, which is different from a total loss of symmetry [48]. For example, ideally, a bilaterally symmetric aircraft should fly straight ahead, but it actually flights in a zigzag way because the flow of air past the aircraft is not bilaterally symmetric. In such way, it must break the symmetry to maintain its stability [55].
According to Alexander’s theory of centers [2], the order, co-herence, and beauty of any structure in nature and human made
artifacts is strongly related to local symmetries. Theirgeometrical coherence makes us feel the presence of order, and it can be de-scribed in terms ofcenters as building blocks. In this theory, a center is not a point, not a perceived center of gravity, it is defined asa field of organized force in an object or part of an object which makes that object or part exhibit centrality. For example, in Figure 1b is shown a random arrangement of 69 black and 96 white squares. Because of its incoherence, it is hard even to describe it. Whereas, in Figure 1c these squares have an organized arrangement, known as the Seljuk pattern, which appeared in an old carpet, considered beautiful [1]. Its form of coherence makes it one of the centers in the wholeness of that carpet, which is easy to remember and describe [2, 51].
In the theory of centers, there are around fifteen recurring struc-tural properties that make centers more coherent structures [2, Ch.5]. From those properties, such as levels of scale, boundaries, or alternating repetition, a center is commonly formed by alocal symmetry [1, pg. 42]. Specifically, the Seljuk pattern in Figure 1c is a center and its coherence is formed by other local centers recursively. Moreover, white squares, which may appear as the background with black ones, have their own (local) symmetries. Centers have been experienced in spatial structures, in nature, buildings, works of art, physics, or psychology [1–3].
Following some other works relating centers, symmetries, and software, discussed in the next section, our contribution makes the main assumption that variation points (vp-s) with variants are a kind ofcenters of attention and activity in software design. We thus base our approach on the property of local symmetry for identifying and visualizing potential variability at the implementation level.
3
IDENTIFYING VARIABILITY
As stated in the introduction, there are many approaches for detect-ing variability concepts, especially those for identifydetect-ing features in code [8, 16, 50], but there is no automated means for identifying vp-s with variants in our context of object-oriented techniques [39]. The diversity of these techniques is analysed in different frame-works, taxonomies, and catalogs, by comparing them on different criteria [6, 20, 22, 46, 56]. For instance, in a recent catalog, 16 tradi-tional techniques are compared and classified based on 24 proper-ties [58]. But, despite these comparative schemas, we are not aware that any common property of these techniques exists, and could be used to identify the different kinds ofvp-s in a uniform way. For example, in Listing 1, thevp Shape has a class level granularity and is resolved at runtime, whereas thevp draw has a method level granularity and is resolved at compile time, during product derivation [58]. Both of them resemble two different kinds ofvp, but with four different properties.
Towards a unified approach for identifyingvp-s, the majority of traditional language constructs have been shown to be describable in terms of symmetry [12, 66, 67]. In the following we study the property of symmetry in object-oriented techniques, show how it can be interpreted as a local symmetry in reusable code assets, and how this single property can be used to identify all different kinds ofvp-s.
3.1
Symmetry in software constructs
Symmetry and symmetry breaking have been explored in software, with symmetry in the format of programs, software development life cycles, or search algorithms. Besides, inspired by Alexander’s theory of centers [2], symmetry has been identified in different programming language constructs, as well as in software design patterns [12, 24, 65–67]. In the following, we revisit the symmetry in classes, class subtyping, and several design patterns3.
Symmetry in classes. In object-oriented programming, a class is an extensible code template for creating objects, providing some structure and behavior [64]. At its execution or object instantiation, the definition of its structure and behavior remains unchanged, whereas it enables changes over its instantiated objects. This de-notes the symmetry of a class, which can be illustrated on the class Circle in Listing 1 by:
• the possibility of changes among all potential circle objects c1,c2,..., cnwith different areas and perimeters, and • the defined computations of area and perimeter in the class
Circle thatremain unchanged for all these objects. In addition, these objects can be mapped from one another, such as fromc1toc2toc3, which represents a substitution as a symmetry transformation. Therefore, a class defines asubstitution symmetry for its objects.
Symmetry in subtyping. In class subtyping, when inheritance is viewed as classification of classes [44, pg.822], all classes of a type path may change, but they must preserve and conform to a common behavior. For example, in Listing 1:
• the possibility of a change in the abstract class Shape materi-alizes in its potential different subtypes, such asRectangle andCircle. Their shown change regards the way the area and perimeter are computed. Whereas,
• the immunity to change maps to these subtypes preserving the behavior of their supertypeShape.
Thus, a class subtyping also defines asubstitution symmetry for its subtypes, which can be substituted as they have the same supertype. Class subtyping is only one of the ten well-known forms of inheritance [44, pg.822]. According to a coming study, the other forms of inheritance also exhibit the property of symmetry and can be described similarly [13].
Symmetry in overloading and overriding. Symmetry appears also in software constructs at method or function level. For instance, method or function overloading lets you define multiple functions of the same name, but with different implementations. For example, for each overloaded methoddraw() of Rectangle in Listing 1:
• the number of the taken parameters have changed (cf. lines 17-20 and 21-24), whereas
• the name and the return type have remained the same, un-changed.
This denotes the symmetry in overloading, where the name of an overloaded function remains unchanged while its arity or types of its parameters change. Thus, overloading also defines asubstitution
3
symmetry for the overloaded methods, which can be substituted from one to another.
Further, as another construct, method overriding is used to change the behavior of classes under inheritance and it also has a form of symmetry. Specifically, the method overriding name, pa-rameters, and return type, as its signature, remain unchanged while its implementation changes in the subclass by overriding the im-plementation in the superclass. Thus, method overloading makes somehow possible symmetry in subtyping.
Symmetry in software design patterns. For illustration, we now describe the symmetry in three common software design patterns, strategy, factory, and decorator.
Like in most design patterns, strategy uses inheritance [19]. In the strategy pattern, the decision about which algorithm to use is deferred until runtime. It defines asubstitution symmetry, where the interface for selecting an algorithm remainsunchanged, whereas the algorithms that enable different behaviors at runtime can be substituted, meaning that they canchange.
The factory pattern defines an interface with a factory method for creating objects, but lets subclasses decide which class to instan-tiate. Specifically, concrete creators implement the factory method and create products. We can define it as a specific form of sym-metry, namelyfactory symmetry, where the abstract creator and abstract product remainunchanged, whereas the concrete creators and products vary.
In the decorator pattern, a set of concrete decorators wrap con-crete components, as a means to change their behavior, while their interfaces are preserved. This resembles acomposition symmetry, where the abstract component and abstract decorator remain un-changed, whereas the behavior of concrete components varies, thus change, with the concrete decorators.
Such property of symmetry is also evident for most of the other software design patterns, such as the template or observer patterns. Thus, for most of the other language constructs, it has been shown that under a certain transformation, such as substitution in class, behavior, or template symmetry, a specific property of the system is preserved, such as structure, behavior, regularity, similarity, fa-miliarity, or uniformity [65]. This indicates that any of them can be described in terms of symmetry.
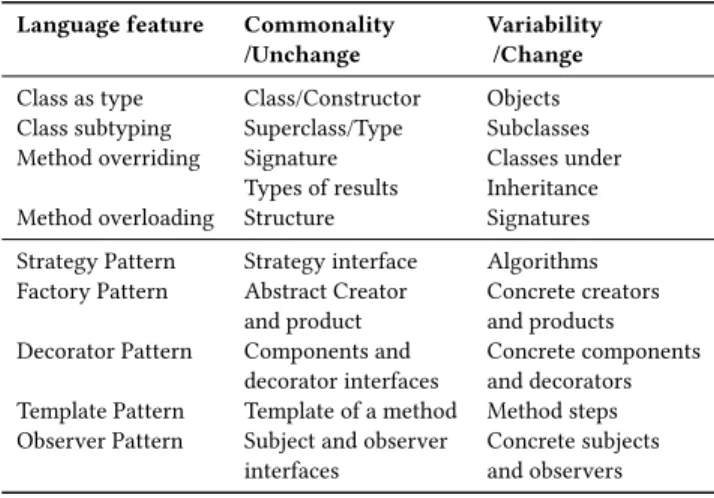
In Table 1 we give nine common language features and their elements of symmetries, which are important for automating their identification. They are based on existing studies and the way to interpret symmetry on language features [12, 65–67]. This could be easily extended to include symmetry in other language constructs and design patterns.
3.2
Identifying variation points with variants
In code reuse, using only classes brings too much symmetry in code, which is perceived as a way to lead to inflexible and rigid programs [65]. Therefore, specifically in object-orientation, the symmetry of programs organized in classes is usually broken by introducing interfaces, abstract classes, and the rise of software design patterns can be seen as a reaction to this problem [12, 65]. Wherever these other mechanisms or techniques are applied, some local symmetries will emerge in code. Therefore, we can infer that the usage of any of them for implementing variability, such as class
Table 1: Nine language features and their symmetries
Language feature Commonality Variability /Unchange /Change Class as type Class/Constructor Objects Class subtyping Superclass/Type Subclasses Method overriding Signature Classes under
Types of results Inheritance Method overloading Structure Signatures
Strategy Pattern Strategy interface Algorithms Factory Pattern Abstract Creator Concrete creators
and product and products Decorator Pattern Components and Concrete components
decorator interfaces and decorators Template Pattern Template of a method Method steps Observer Pattern Subject and observer Concrete subjects
interfaces and observers
subtyping, overloading, or design patterns, denotes the existence of a local symmetry in the wholeness of reusable code assets.
We thus build an approach to identify variability by(i) using the fact that each implementation technique is commonly abstracted in terms of a variation point (vp) with its variants [58], and then, based on Sections 2.1 and 3.1,(ii) we deduce that a vp with variants can be interpreted by the property of local symmetry. Specifically, whilevp-s resemble the unchanged parts in the design of code assets, variants resemble their changed parts. Hence, asvp-s with variants become much more than places where some variability happens, we propose a new definition.
Definition 1. Variation points with variants represent the un-changed and un-changed parts in software design, are realized by an implementation technique, and abstract the structure ( a.k.a., design) and the functionality of the implemented variability. Moreover, they mark the local symmetries in reusable code assets, which resemble centers in Alexander’s meaning.
Based on this definition, to identify variability in terms of vp-s with variants, we have to determine the local symmetries in the structure of reusable code assets. For example, the variability in Listing 1 has two local symmetries that can be abstracted as: vp_Shape (lines 1–5) with variants v_Rectangle (lines 6–25) and v_Circle (lines 26–36), and vp_Draw (lines 16–24) with variants v_drawCoordinates (lines 17–20) and v_drawPoint (21–24). The firstvp resembles the symmetry in inheritance, while the second one the symmetry in overloading. This shows how the different kinds ofvp-s can be identified by simply identifying the local symmetries in reusable code assets.
In addition tovp-s, identifying the variants of a vp is impor-tant, as they may have nested variability. For example, the class Rectangle is a variant of vp_Shape but has a nestedvp draw, which has two other variants. Moreover, all nine language features in Table 1 has a symmetry at the class or method level, indicating that any identifiedvp or variant in these techniques will have a class or method level granularity.
3.3
Density of variation points
According to Alexander’s theory, the number of local symmetries is crucial for measuring the coherence of a structure [4]. For example, by counting the number of local symmetries it is shown that the Seljuk pattern in Figure 1c has far more local symmetries than the random pattern in Figure 1b [1]. This is then identified as the reason that makes the Seljuk pattern much more coherent, thus easy to recognize, describe, and remember.
Similarly, we propose to use the density ofvp-s within a code unit (class or file), as a means for locating and describing the most intense places with variability in reusable code assets. First, this is feasible because of the nested nature ofvp-s, which corresponds to the recursive nature of centers in Alexander’s meaning. For example, in Listing 1, thevp_Draw is a nestedvp of the vp_Shape, by being within one of its variants. This indicates that a larger amount of variability is concentrated in this place. Therefore, we define the density of implemented variability within a code unit as the sum of itvp-s, their nested vp-s, and the vp-s external to the unit that any of itsvp-s depends on. This density can be simplified and discerned directly from a visualization form ofvp-s. For example, the density at the class level in Listing 1 has onevp Shape and one variant Rectangle, which shows in minimum one nestedvp. In this case, the density of Listing 1 is two.
4
AUTOMATIC IDENTIFICATION AND
VISUALIZATION OF SYMMETRIES
To show the feasibility of our variability identification approach, we developed thesymfinder toolchain. It enables the automatic identifi-cation and visualization of different local symmetries, as described in the previous sections, so that one is helped in determiningvp-s with variants in a variability-rich system, in visualizing them, and in discerning any pattern of variability by analysis of the density ofvp-s and variants among different systems.
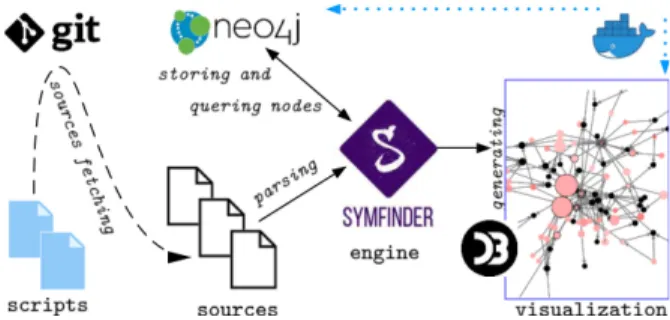
Figure 2 depicts the whole dockerized toolchain, which consists of three parts,(i) sources fetching from several software projects that are going to be studied,(ii) symmetry identification in the code within thesymfinder engine, and (iii) visualization through a web browser. The toolchain uses scripts, an engine implemented in Java, and a graph database (Neo4j4). It is also deployed within a Docker5 container so to increase its portability and facilitate its usage.
Figure 2: The dockerized symfinder toolchain
4
https://neo4j.com/
5
https://www.docker.com/
The source fetching part of the toolkit mainly aims at automating experiments. From a configuration file, the toolchain runsbash and python scripts in order to fetch sources and checkout the desired tags or commits from some git repositories (cf. Figure 2). This enablessymfinder to work easily over any software system that is publicly available (e.g., on GitHub). Moreover, the main internal project structure ofsymfinder, with some usage guidelines, is given in Appendix A.
4.1
Identification
At the center of the toolchain is thesymfinder engine (cf. Figure 2), the main purpose of which is to automatically analyse the source code and to build a representation of all potentialvp-s, (i.e., classes). This process is realized in two main steps. First, the classes of the targeted system are parsed. Targeting in its first version Java-based systems, we reused the Eclipse JDT parser to analyse Java classes. Then, the local symmetries are identified and stored into the Neo4j graph database.
Local symmetries are identified according to the defined sym-metry in each language construct, technique, and design pattern given in Table 1. Specifically, each interface, abstract class, extended class, overloaded constructor, and overloaded method is identified. All together, they actually represent the potentialvp-s. Then, the classes that implement or extend them, including the concrete over-loaded constructors and methods are also identified, which should represent respective variants. For example, after parsing the classes in Listing 1,symfinder will identify the local symmetry in inheri-tance among thevp Shape and its two variant classes Rectangle andCircle. For each of them, the engine adds a class node and keeps their relationship within the database.
For implementing the previous operations and the following ones, the engine relies on the graph query language of the Neo4j database to identify symmetries. This language, named Cypher6, enables the creation and easy querying over nodes, relationships, and properties with patterns covering complex traversals and paths. For example, queries are used to identify the symmetry in the overloaded constructors and methods within each class, as well as to add their number as a property of the class node. In our example, the symmetry in the overloadeddraw method will be identified within the classRectangle and a value of one will be added to its class node. In addition, the information for the types of class nodes is also saved, whether it was an interface, abstract class, or concrete class. Finally, thesymfinder engine also identifies the local symmetry in two common software design patterns, strategy and factory. A strategy is identified by its name and by analyzing the structural relationship of classes. The second pattern is identified by its name and by analyzing the return types of methods, a detected factory is a class that contains a method returning an object whose type is a subtype of the declared method return type.
4.2
Visualization
After identifying and storing potentialvp-s with variants into a graph database, we need to provide some means to get more in-sight regarding the variability aspect of the analysed system. To do
6
Node types Parameters Visualization Concrete class (vp), Node with black outline
Concrete class (Vari-ant with innervp-s)
Node without an outline
Abstract class (vp) Node with dotted outline Interface (vp) Black node
Constructors (vp) Node with shades of red Overloading (vp) Node of different size
Strategy pattern (vp) Node with symbolS S
Factory pattern (vp) Node with symbolF F
Inheritance Edge
Table 2: The eight kinds of nodes and their relationships used for the visualization of vp-s with variants graph
so, thesymfinder toolchain provides the capability to generate an interactive visualization of the elements in the graph (cf. Figure 2). Instead of visualizing the identified graph ofvp-s with variants by plain nodes and edges, we considered that it is important to also visualize information regarding the used language constructs, tech-niques, or design patterns for implementing variability. As in many software and code artifacts visualizations [33, 34, 60, 62, 63], we rely on the visual principles of preattentive perception [15], using some of the seven parameters that can vary in visualization in order to represent data, namely position, size, shape, value (lightness), color hue, orientation, and texture. The six kinds of nodes that we use insymfinder for the visualization of the kinds of potential vp-s with variants are shown in Table 2.
The D3.js7library is used as the visualization support in the symfinder toolchain. Although we considered using the visualiza-tion capabilities of Neo4j and other visualizavisualiza-tion forms used in SPL engineering [38], we decided for D3.js as it allows to visualize not only graphs but also a plethora of chart types. We were able to con-sider them before devising the current form of visualization, and this could also help for future evolutions of the toolchain. Besides, as D3.js visualizations are written in JavaScript, only a web browser is needed, and forsymfinder, a configuration JavaScript file is only used in a template for the web page that will display the graph.
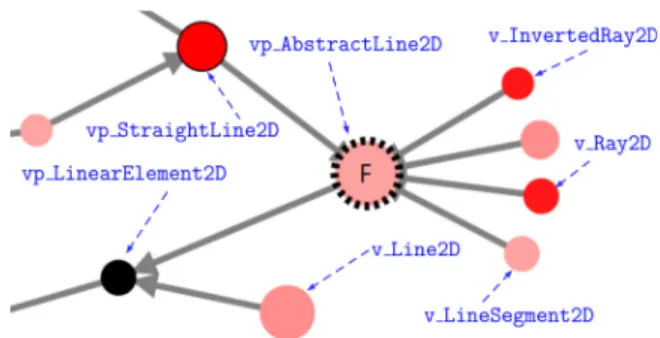
As an example, Figure 3 shows a visualization excerpt of the identified symmetries in the JavaGeom library [14], a variability-rich system among the ones we used in our experiments (cf. Sec-tion 5). It shows the variaSec-tion pointvp_AbstractLine2D and vari-antv_Ray2D, which forms a comparable variability to thevp-s and variants in Listing 1. Specifically, eachvp node is represented by a circle. A red node with a black outline visualizes a concrete class that is avp (e.g., vp_StraightLine2D). A red node without an outline is a concrete class that is a variant with variability at the method level (e.g., the v_Line2D). A red node with a dotted outline visualizes an abstract class, whereas a black node an interface (e.g., vp_LinearElement2D). Multiple shades of red nodes are used to visualize the number of constructor overloads for each class or interface. The more overloaded constructors are present, the more intense is the node’s color. Next, the size of the node is in func-tion of the number of overloaded methods. For instance, the node
7
https://d3js.org/
Figure 3: Excerpt of a visualization from the identified sym-metries in the JavaGeom library. Annotations in blue are not part of the visualization, they show potential vp-s and vari-ant names that are displayed when hovering a node. vp_StraightLine2D has a more intense red color and bigger size, thus indicating that it has potential variability at both the construc-tor and method levels. Further, the first letter of a design pattern is used to mark a node that represents that pattern, for example, letterF is used for the factory pattern in vp_AbstractLine2D and its dotted outline denotes its relation to an abstract class. Then, depending on whether nodes are related in design, a directed edge is used to express their relationships, such as in the case of class extension or interface implementation in the current version of the visualization.
With this visualization support, we expect to easily discern, in an analysed system, some zones of interestw.r.t. variability.
5
VALIDATION
In order to check whether our tooled approach satisfies the identi-fication and visualization of variability, we applied thesymfinder toolchain on eight object-oriented variability-rich systems. In the following, we present the selected case studies and the obtained results.
5.1
Validation case studies
For selecting validation case studies, we considered several criteria, their implementation in Java, the open-source nature of the project, their availability on a git repository, and the fact that they could contain some implemented variabilities.
Geometry related and charting capabilities being typical of some variability to be handled, we first selected JavaGeom, a library for manipulating and processing several families of geometric shapes, already used in other studies [59], JFreeChart, a charting library, and the AWT part of the Java Development Kit. We then selected two projects from the Apache consortium, CXF, a fully featured Web services framework, which could contain variability in its implementation, and Maven, the build automation tool, which ar-chitecture is strongly based on plug-ins. We added JUnit 4, as its architecture is based on many design patterns, at least in its pre-vious version 3, and the Java-backend of JHispter, an application generator for web applications and microservices, as it has been already used as a variability case study [23]. Similarly, we also se-lected ArgoUML, a UML diagramming application, used in different studies on SPL engineering [40].
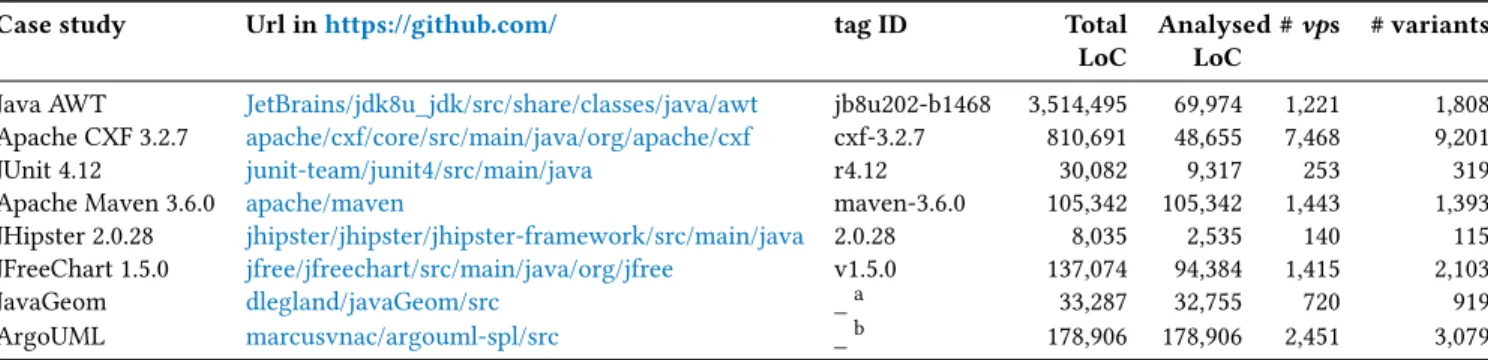
Table 3: The eight variability-rich systems and their respective analysed tag or commit ID
Case study Url inhttps://github.com/ tag ID Total
LoC
Analysed LoC
# vps # variants
Java AWT JetBrains/jdk8u_jdk/src/share/classes/java/awt jb8u202-b1468 3,514,495 69,974 1,221 1,808 Apache CXF 3.2.7 apache/cxf/core/src/main/java/org/apache/cxf cxf-3.2.7 810,691 48,655 7,468 9,201
JUnit 4.12 junit-team/junit4/src/main/java r4.12 30,082 9,317 253 319
Apache Maven 3.6.0 apache/maven maven-3.6.0 105,342 105,342 1,443 1,393
JHipster 2.0.28 jhipster/jhipster/jhipster-framework/src/main/java 2.0.28 8,035 2,535 140 115 JFreeChart 1.5.0 jfree/jfreechart/src/main/java/org/jfree v1.5.0 137,074 94,384 1,415 2,103 JavaGeom dlegland/javaGeom/src _a 33,287 32,755 720 919 ArgoUML marcusvnac/argouml-spl/src _b 178,906 178,906 2,451 3,079 commit ID: a 7e5ee60ea9febe2acbadb75557d9659d7fafdd28 bbcae37308b13b7ee62da0867a77d21a0141a0f18
5.2
Conducted experiments
We applied thesymfinder toolchain to analyse and understand the variability of each case study. Details and metrics on the eight case studies are presented in Table 3, with the URL to their public repos-itory, the analysed source package, their analysed tag or commit ID, its total size in lines of code (LoC)8, and the size of their analysed source package.
Among the case studies, we experimented with different configu-rations ofsymfinder. At first, we sought to show that our toolchain can be used to analyse a whole software system or only a desired part of it. For this reason, in some case studies we aimed to identify the variability of the whole software system, such as in Apache Maven 3.6.0, and in some others, of only a single source package, such as the AWT library in the JDK 8 (cf. Table 3). Depending on the system, we used commit IDs or tags to grab one specific version, which we have used to tailor the visualization which is presented in this paper. To validate the interoperability of our tool, we made suc-cessfully the same experiments in three operating systems, Linux, Mac, and Windows. All the conducted experiments included in this paper are available from https://deathstar3.github.io/symfinder-demo/, with extracted screenshots, more explanations on each case, and a deployed online demonstration of the visualization.
5.3
Results
When conducting the experiments, we could successfully visualize the potential variability of each case study and relate it to the used software constructs. For example, in Figure 4 is shown an excerpt from the identified variability in JFreeChart 1.5.0. To ease the read-ing, the visualization itself can be zoomed in and out, as in Figure 5, and its class name appears when hovering a node. The usage of the visualization also enables us to improve its functionality, as discussed in the following paragraphs.
5.3.1 Filtering the out of scope vp-s. Through the analysis of the ob-tained visualization in each case study, we observed that the larger number ofvp-s and variants may hinder the analysis of a system variability from its visualization. Therefore, we decided to add a filtering capability insymfinder. Currently, filtering is available in the visualization and supports to filter out all the solitaryvp-s, at once, and also any other individualvp, by giving its class name. In
8
For counting the the lines of code we usedgocloc: https://github.com/hhatto/gocloc/
Figure 4: An excerpt of the JFreeChart 1.5.0 vi-sualization after removing the out of scope vp-s org.jfree.chart.event, org.jfree.data.general, and org.jfree.chart.util.PublicCloneable
Figure 5: The vp-s with variants for the selected zone of in-terest in Figure 4
Figure 4, filtering is available from the menu "Show project infor-mation". This property helped us to analyse and identify several interesting patterns of variability among the targeted systems.
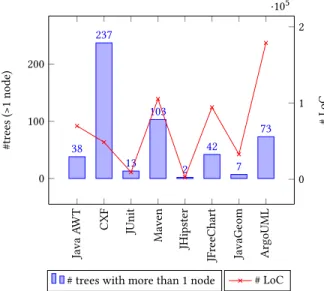
Java A W T CXF JUnit Mav en JHipster JFr e eChart JavaGe om ArgoUML 0 100 200 38 237 13 103 2 42 7 73 #tr e es ( >1 no de)
# trees with more than 1 node
0 1 2 ·105 # LoC # LoC
Figure 6: The number of places with a higher density of vp-s and variants at the class level with the # LoC per case study 5.3.2 Understanding the identified variability. The visualization of variability is mainly a forest-like structure. Therefore, to understand variability, in each case study we focus the analysis on a tree ofvp-s and variants with method levelvp-s. In all cases, the visualization helped us in finding as interesting places the trees with a higher density ofvp-s and variants at the class level (cf. Section 3.3). With the appropriate filtering, it was always easy to discern these places. For example, in JFreeChart, we decided to focus the study in the identifiedvp-s within the blue rectangle in Figure 4. A magnified view of this excerpt of variability is given in Figure 5. Here, the vp_Plot has several variants with method level vp-s, such as v_PolarPlot, v_MeterPlot, or v_SpiderWebPlot, which make possible to draw different types of plots in JFreeChart. Then, through a manual trace in code, we observed that thevp_Plot has abstracted the Plot class, which is a local symmetry in the strategy pattern.
In the same way, we selected a node in the tree to analyse its method level variability. For example, we observed that the bigger size of the node vp_CategoryPlot corresponds to a large number of symmetries in method overloading in class CategoryPlot, which has 29 places with method overloading. Then, thev_SpiderWebPlot has a darker red color as the class SpiderWebPlot has a symmetry in constructor overloading with 3 overloaded ones.
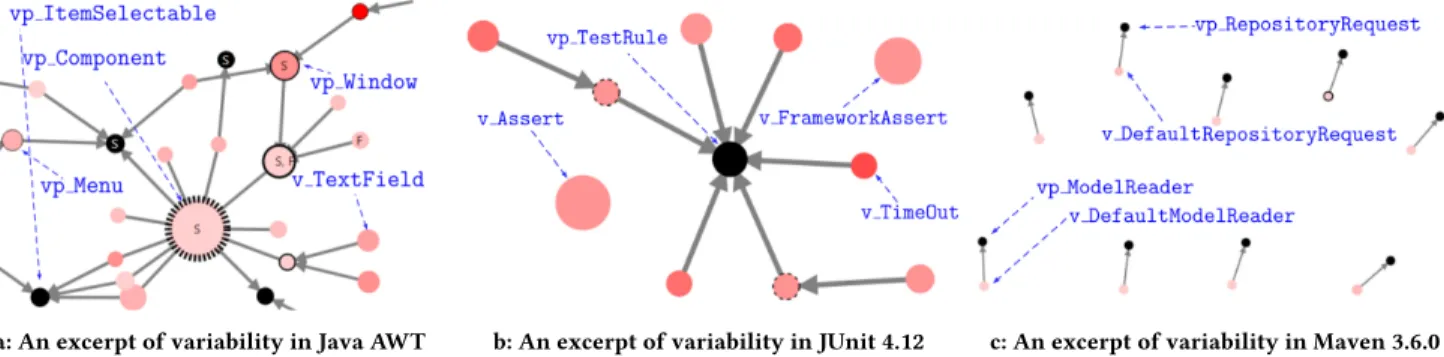
We could also easily discern places with the largest or the small-est amount of the factorized commonality and of the constructor level variability. For example, Figure 9a shows an excerpt of the iden-tified variability in the Java 8 AWT library. The nodevp_Component has a bigger size than the nodesvp_Menu or vp_ItemSelectable, indicating that thevp_Component has a larger amount of common-ality for its variants. But, the node vp_Window has a darker red color, indicating that it supports more variability at the constructor level than thevp_Component. Similarly, we analysed each desired vp regarding its provided functionality.
Java A W T CXF JUnit Mav en JHipster JFr e eChart JavaGe om ArgoUML 0 1 2 ·105 # LoC 0 2,000 4,000 6,000 8,000 # vps # LoC # vps
Figure 7: The correlation of # vp-s with the # LoC per case study
To have an overview of variability in each case study, we give in Figure 6 their respective total number of trees. They correspond to the number of places with a density higher than onevp or variant at the class level, meaning that the solitaryvp-s or variants at the class level are excluded from the calculation. For example, JFreeChart contains 42 places with a higher density ofvp-s and variants with method level variability. Visually, these are the trees with more than a single node in Figure 4. Such a case is the given tree in Figure 5 with 23 nodes. In addition, Figure 6 shows the relationship between the number of trees with higher density and lines of code in each case study.
5.3.3 The identified number of vp-s with variants. In order to give more insight into the variability of a targeted system, we decided to calculate its identified number ofvp-s with variants. Interestingly a recent literature review on metrics in SPL engineering shows that the number ofvp-s is a useful metric for analyzing variability and its implementation in code [18]. It is used to measure the total number of#ifdef-blocks when preprocessors are used to implement the variability. Similarly, we used this metric to reason on the size of the implemented variability of our targeted systems. But, in contrast to the existing usage, and in accordance with the ourvp definition (cf. Definition 1), the number of vp-s now represents the number of local symmetries in reusable code assets, which is complemented with the number of their variants.
The calculation of this metric is automated within thesymfinder toolchain and is available during the visualization of variability. In Table 3 we give the total number of identifiedvp-s and variants in each case study. Figure 7 shows the correlation between the number of thesevp-s and the lines of code (LoC) per case study. Further, we give details for the number ofvp-s and variants at the class and method levels, including the number ofvp-s and variants at the method and class constructor levels. As thevp-s that are related to design patterns overlap with somevp-s at class level (cf. Section 3.1), we take care to consider them only once during the calculation.
0 1,000 2,000 3,000 4,000 5,000 6,000 variant method variant class vp method vp class #vp-s / # variants
Figure 8: The total number of vp-s and variants at the class and method level for the eight case studies
In Figure 8 are summarized the four values ofvp-s and vari-ants for the eight case studies. We can deduce from them some interesting findings regarding the granularity level of reuse in the observed object-oriented code. There are slightly morevp-s at the class level than at the method level, and in the meantime, there are over twice more variants at the method level than at the class level. More globally it seems that both techniques at class and method levels are equally used to implement variability, but we also need to extend the implementation techniques we are able to identify to draw more general conclusions on this.
5.4
Three discerned patterns of variability
From the resulted visualizations, we discerned three patterns of variability that emerge from the different case studies.
As a first pattern, we observed that the bigger size nodes and the darker red nodes appear usually in large trees. For example, thevp_XYPlot in JFreeChart and the vp_Component in Java AWT are two big nodes. Then, thev_TimeOut is a darker red node in JUnit. They are all part of larger trees shown in Figures 5, 9a and 9b, respectively. This indicates that the places with a higher density of variability at the method level have a higher density at the class level, but not conversely. Thus, the cases like in Figure 9b were rare, wherev_Assert and v_FrameworkAssert in JUnit 4.12 are two solitary nodes which have a lot of variability at the method level. For this reason, if needed, the single node trees could be filtered out from the visualization.
A second pattern is a way that we can group the eight case stud-ies into (1) those that have a smaller number of trees but a higher density of variability, and (2) those that have a larger number of trees but a lower density of variability. From Figure 6, most of the case studies belong to the first group except the Apache CXF 3.2.7 and Apache Maven 3.6.0 that belong to the second group. These two systems have almost the largest number of trees with more than a single node, but the majority of them are trees with only two or three nodes. For example, Figure 9c shows an excerpt of variability from Maven. Although this system is highly variable through its plug-in system, nothing is visible in its main project except the inter-faces with a single implementation. Specifically, over 90% of its trees have only onevp with one or two vp-s or variants. For instance, the vp_RepositoryRequest with the v_DefaultRepositoryRequest.
Therefore, we used this second pattern to characterize code bases that are more variability-rich, group (1), or less, group (2). As for Maven, it could be interesting to include code from some of its plugins to observe whether some relevant variability zones appear. The last pattern is revealed in Figure 7. With a single variation in Apache CXF, it shows that the total number of the identifiedvp-s at class and method level seems highly correlated with the number of LoC of a software system. For example, JHipster 2.0.28 and JUnit 4.12 have the smallest number of analysed LoC and the smallest number ofvp-s. Similarly, ArgoUML is the largest analysed system and has the largest number ofvp-s.
6
DISCUSSIONS
6.1
Scope of our study
In this study we only considered ten common variability imple-mentation techniques, while variability can be implemented by other language features or paradigms, such as functional program-ming. Then, some software systems may also vary at the statement level [58], where no technique is really used. However, we decided to consider only the most common variability implementation tech-niques at the class and method level, which are evident in every object-oriented variability-rich system, and we believe the observed results are sufficient to show the feasibility of the approach. More-over, we believe that our approach and toolchain can be extended to other used techniques, and at the statement level by using the geometry of code [10, 21], for example with line indentation [45].
6.2
Threats to validity
The validity threats we face are related to thesymfinder toolchain capabilities, and the interpretation of results.
A first threat to validity is on the selected case studies. While the set of case studies is not very large, we have shown it is suffi-cient to validate the current state of the tooled approach on diverse Java-based software projects. The identification and visualization of symmetries is effective. With a larger set of analysed systems, more or less variability-rich, we believe the obtained results will be simi-lar. Still, we believe that additional systems might highlight some additional variability patterns. This calls for larger experiments as the toolchain itself is extended, as mentioned in the previous paragraph. This is completely in line with our future work plan.
The second threat is on the interpretation of results. First, we explicitly decided to omit the solitary nodes based on the main assertion in the center’s theory, where the number of local sym-metries resembles the important places in design. But, including them might highlight some additional patterns of variability, some of which can be specific to the domain of the targeted system. For example, 73% and 95% of the trees in JUnit 4.12 and JHipster 2.0.28, respectively, are solitary nodes. We expect that the future enhance-ments in the approach and toolchain will enable to get more insight on this. Secondly, our experiments show identification of symme-tries, and concrete relations between them and some variability implementations, but we did not have any complete definition of all present symmetries and variability implementations in the studied code that could have acted as ground truth. Consequently, we only stay at the level of a feasibility demonstration with the current con-tribution. A first solution would be to examine the whole code of
a: An excerpt of variability in Java AWT b: An excerpt of variability in JUnit 4.12 c: An excerpt of variability in Maven 3.6.0
Figure 9: Example of a: one vp with a lot of commonality, b: small trees with high method level variability, and c: large number of nodes with low vp-s and variants density
some projects, and it looks feasible for JavaGeom as a starting point. Another one is to find the information in the domain features. Cur-rently, we did not experiment any mapping from existing domain features to identifiedvp-s with variants at the code level. As the ArgoUML case study already has a defined feature model, it could be used for further work on mapping and some measurements on the realizability and usefulness properties [43].
6.3
Limitations
Beside the limitations related to the threats discussed above, we see two other limitations in our tooled approach.
First, we currently only analyse Java based systems. Even if it is a widely used object-oriented language, we also observed that some variability can be present in systems or subsystems that are written in JavaScript. This is, for example, the case with JHispter, where we could only analyse the Java backend, which deals only with the generation capabilities. Being able to analyse both languages would enable to study more systems, but also projects architected with different languages, for example, with JavaScript for the frontend, and Java for the backend.
A second limitation is the absence of navigation fromvp-s or variants into their implementation in code. This can be solved by integrating our toolchain within a development environment, such as Eclipse or IntelliJ, but this is a significant amount of work in implementation and maintenance.
Finally, according to Figure 7, highly variable software systems are likely to have a high number of LoC. Therefore, scalability is an important concern as our toolchain has to be able to analyse large projects. Actually, the analysis of JFreeChart 1.5.0 lasts approxima-tively 25 minutes. In the near future, we will aim at improving the toolchain in order to reduce analysis time, for example, by storing more information in the graph database to reduce the number of analysis passes over the source code.
7
RELATED WORK
In reengineering ofclone-and-own and legacy software systems into SPL, there is a large body of work on feature location and feature identification approaches [8]. Feature location is an activity for recovering the traceability of some pre-existing features to the reusable code assets in an SPL [16, 50]. Whereas, feature identifica-tion is an activity for identifying the common and varying units, as
potential features, among some related software systems [41, 68]. In both cases, a set of clone-and-own or legacy systems are analysed. In contrast, we consider the class of single variability-rich systems that represent a family of systems but within a single code base. Then, instead of identifying the domain features, for example by do-ing an intersection of the abstract syntax tree elements of different systems, we identifyvp-s with variants, as two variability concepts that are closer to the code and abstract the implementation tech-niques or the reusable design of code assets. Regarding the classifi-cation of migration SPL engineering approaches [32], our variability identification process belongs more to the reactive or incremental approaches. Even if we validate it by studying pre-existing systems, we believe that as thesymfinder toolchain visualizes the identified variability implementations, it can be used to understand and then refactor or incrementally extend the variability of a system under development. Future work with the integration of our toolchain in an IDE would help in exploring this usage.
Approaches for analyzing the variability of preprocessor-based systems seem more closely related to our work [26, 36, 37]. Similarly, we consider a family of systems within a single code base, and study real software. Both approaches are likely to cover a large set of the most used variability implementation techniques in industrial settings. However these works aim at comprehending the usage of C/C++ preprocessor directives for implementing variability, as a single technique, or at extracting them as features into a feature model. On our side, we provide some tool support for understanding the variability of a software system implemented by a set of object-oriented techniques, including design patterns.
Regarding the visualization, a recent mapping study shows that there are several approaches and tools for information visualization in SPL engineering [38]. The most common visualized artifacts are feature models, which use trees or graphs. But, there are very few approaches for visualizing the variability at the code level. The existing ones use colors [30] or bar diagrams [17]. Some visual-izations for feature-file tracing have been also proposed [5], but they are very specific. In general, excluding the configuration pro-cess [47, 52], it is well recognized that the majority of the tools in SPL engineering use ad hoc visualization techniques or use the available functionalities inside Eclipse [38]. In contrast, our visual-ization tends to display, after filtering, trees – which are actually disconnected graphs – conform to the nature ofvp-s, variants, and
their relationships. Displaying classes, inheritance links and some additional metrics, this visualization can be seen as related to the ones for understanding large set of classes, such as polymetric views [33, 34]. However the information we used is just focusing on local symmetries and on the potential implemented variability, but relating other software metrics (e.g. quality metrics) to our set of information is clearly an interesting research topic. Toward that, relations and coupling can be studied with several advanced visual-ization techniques that are now used for software understanding, such as visualizing large codes as cities [62, 63], as hotspot maps, or as social networks [60].
8
CONCLUSION
Many object-oriented variability-rich systems are developed to represent a family of systems but within a single code base. They are also likely to use many different variability implementation techniques (e.g., inheritance, overloading, design patterns), which create in the code assets different kinds of variation points with variants. In this paper, we proposed an identification and visual-ization method that uses the property of symmetry in software to highlight and abstract different kinds of variation points with variants in a unified way. We relied and extended previous work on software symmetry to systematically map nine object-oriented language features to variability abstractions. Then, we used our prototyped toolchain to identify the corresponding variation points with variants on eight real Java-based systems and provided the first form of visualization to enable software architects to spot zones of interest w.r.t. variability. In addition, we used the density and the number of variation points, as two metrics, to gain more insights for the variability domain of each analysed system. As a result, we discerned three first patterns of variability that characterize the eight variability-rich systems.
We expect this contribution to be a concrete step towards better understanding of variability implementation with traditional tech-niques, and also to resume the discussion on how to implement the variability within the main decomposition of code. In the fu-ture, we first plan to improve the scope of the toolchain regarding the identification of symmetry in other language features, being object-oriented or functional. Then, we plan to integrate with a development environment that will help to automate the naviga-tion from the visualizanaviga-tion to code and also map domain features to the identified variability in code. We also plan to analyse and visualize the evolution of the variability implementation patterns in large projects over time and discern new ones. For this reason, we aim at exploiting other software metrics [18]. We also expect to study other properties than symmetry that come from Alexander’s theory of centers, aiming to better identify how they could help in understanding large software projects and their variability, such as using the property of good shape to identify the symmetry at the statement level.
A
APPENDIX
Current public release. The latest publicly released source code of thesymfinder tool, tagged splc2019-artifact, is available for down-load athttps://github.com/DeathStar3/symfinder.
symfinder usage guidelines. In Figure 10 is shown the main project structure ofsymfinder. The numbers on the right side show the sequence of steps to reproduce any of the presented experiments. / d3 index.html ...⑥ experiments ...① experiments.yaml src main resources ..⑤ junit-r4.12 ... build.sh...② run.sh...③ visualization.sh...④ README.md
Figure 10: The project structure in symfinder
TheREADME.md file contains a detailed guide on the technical re-quirements, how to set up an ex-periment, to run it, and how to vi-sualize the resulting data for anal-ysis. This guide is valid for three operating systems, GNU/Linux, macOS Sierra 10.12 or newer, and Windows 10 64-bit (Pro, Enter-prise or Education). The main re-quirements for the toolchain are Docker9and Docker Compose10, so to facilitate the overall porta-bility.
Theexperiments.yaml file in ① is used to set up an experiment. It requires thegit repository url of the targeted system with its tag ID or commit ID, for instance, the url of JUnit with tag r4.12, given in Table 3. The provided file con-tains a default configuration that corresponds to all eight analysed systems in Table 3. Still, one can change the configuration to analyse another set of systems.
In② and ③, build.sh and run.sh are the main scripts to build and run an experiment. Basically,run.sh downloads the sources of the targeted system and starts a Docker Compose environment, whereasvisualization.sh in④ generates the visualization data. The downloaded copy of a system is saved locally in theresources folder, such as thejunit-r4.12 subfolder in⑤. Then, index.html is used to access the generated visualization of the identified vari-ability for a targeted system (⑥). It can be opened locally using a web browser, through http://localhost:8181.
TheREADME.md file also contains a visualization example, which is annotated to explain the different elements of visualization.
symfinder demonstration website. The generated visualizations of the identified variability for the eight analysed systems are avail-able athttps://deathstar3.github.io/symfinder- demo/. This site also contains a larger set of examples, enriched with explanations, from the identified variability in each analysed variability-rich system.
REFERENCES
[1] Christopher Alexander. 1993.A Foreshadowing of 21st Century Art: The Color and Geometry of Very Early Turkish Carpets (Center for Environmental Structure, Vol 7). New York: Oxford University Press.
[2] Christopher Alexander. 2002.The nature of order: an essay on the art of build-ing and the nature of the universe. Book 1, The phenomenon of life. Center for Environmental Structure.
[3] Christopher Alexander. 2002. The process of creating life: Nature of order, Book 2: An essay on the art of building and the nature of the universe.Berkeley: Center for Environmental Structure (2002).
[4] Christopher Alexander and Susan Carey. 1968.Subsymmetries. Perception & Psychophysics 4, 2 (1968), 73–77.
9
https://www.docker.com/
10
[5] Berima Andam, Andreas Burger, Thorsten Berger, and Michel RV Chaudron. 2017. Florida: Feature location dashboard for extracting and visualizing feature traces. InProceedings of the Eleventh International Workshop on Variability Modelling of Software-intensive Systems. ACM, 100–107.
[6] Sven Apel, Don Batory, Christian Kästner, and Gunter Saake. 2013. Feature-Oriented Software Product Lines. Springer.
[7] Sven Apel and Dirk Beyer. 2011. Feature cohesion in software product lines: an exploratory study. InSoftware Engineering (ICSE), 2011 33rd International Conference on. IEEE, 421–430.
[8] Wesley KG Assunção, Roberto E Lopez-Herrejon, Lukas Linsbauer, Silvia R Vergilio, and Alexander Egyed. 2017.Reengineering legacy applications into software product lines: a systematic mapping.Empirical Software Engineering 22, 6 (2017), 2972–3016.
[9] Rafael Capilla, Jan Bosch, and Kyo-Chul Kang. 2013. Systems and Software Variability Management. Springer.
[10] J Coplien. 1998. Space: the final frontier.C++ Report 10, 3 (1998), 11–17. [11] James O Coplien. 1999.Multi-paradigm design for C++. Vol. 53. Addison-Wesley
Reading, MA.
[12] James O Coplien and Liping Zhao. 2000. Symmetry breaking in software pat-terns. InInternational Symposium on Generative and Component-Based Software Engineering. Springer, 37–54.
[13] James O. Coplien and Liping Zhao. 2019.Toward a general formal foundation of design. Symmetry and broken symmetry. Technical Report. A VUB Lecture Series Publication.Working draft.
[14] David Legland. 2019. JavaGeom - Geometry library for Java. https://github.com/ dlegland/javaGeom/tree/master/src [Online].
[15] Stephan Diehl. 2007.Software visualization: visualizing the structure, behaviour, and evolution of software. Springer Science & Business Media.
[16] Bogdan Dit, Meghan Revelle, Malcom Gethers, and Denys Poshyvanyk. 2013. Feature location in source code: a taxonomy and survey.Journal of software: Evolution and Process 25, 1 (2013), 53–95.
[17] Slawomir Duszynski and Martin Becker. 2012. Recovering variability information from the source code of similar software products. In2012 Third International Workshop on Product LinE Approaches in Software Engineering (PLEASE). IEEE, 37–40.
[18] Sascha El-Sharkawy, Nozomi Yamagishi-Eichler, and Klaus Schmid. 2018. Metrics for analyzing variability and its implementation in software product lines: A systematic literature review.Information and Software Technology (2018). [19] Eric Freeman, Elisabeth Robson, Bert Bates, and Kathy Sierra. 2004.Head first
design patterns. " O’Reilly Media, Inc.".
[20] Claudia Fritsch, Andreas Lehn, and Thomas Strohm. 2002. Evaluating variability implementation mechanisms. InProceedings of International Workshop on Product Line Engineering (PLEES). sn, 59–64.
[21] Richard P Gabriel. 1996.Patterns of software. Vol. 62. Oxford University Press New York.
[22] Critina Gacek and Michalis Anastasopoules. 2001. Implementing product line variabilities. InACM SIGSOFT Software Engineering Notes, Vol. 26. ACM, 109–117. [23] Axel Halin, Alexandre Nuttinck, Mathieu Acher, Xavier Devroey, Gilles Perrouin,
and Patrick Heymans. 2017. Yo variability! JHipster: a playground for web-apps analyses. InProceedings of the Eleventh International Workshop on Variability Modelling of Software-intensive Systems. ACM, 44–51.
[24] Kevlin Henney. 2003. The Good, the Bad, and the Koyaanisqatsi. In Proceed-ings of the Second Nordic Pattern Languages of Programs Conference, VikingPLoP, Vol. 2003.
[25] Weyl Hermann. 1952.Symmetry. Princeton University Press.
[26] Claus Hunsen, Bo Zhang, Janet Siegmund, Christian Kästner, Olaf Leßenich, Martin Becker, and Sven Apel. 2016. Preprocessor-based variability in open-source and industrial software systems: An empirical study.Empirical Software Engineering 21, 2 (2016), 449–482.
[27] Ivar Jacobson, Martin Griss, and Patrik Jonsson. 1997.Software reuse: architec-ture, process and organization for business success. ACM Press/Addison-Wesley Publishing Co.
[28] Kyo C Kang, Sholom G Cohen, James A Hess, William E Novak, and A Spencer Pe-terson. 1990.Feature-oriented domain analysis (FODA) feasibility study. Technical Report. Carnegie-Mellon Univ Pittsburgh Pa Software Engineering Inst. [29] Christian Kästner, Klaus Ostermann, and Sebastian Erdweg. 2012. A
variability-aware module system. InACM SIGPLAN Notices, Vol. 47. ACM, 773–792. [30] Christian Kästner, Salvador Trujillo, and Sven Apel. 2008. Visualizing Software
Product Line Variabilities in Source Code.. InSPLC (2). 303–312.
[31] Maren Krone and Gregor Snelting. 1994. On the inference of configuration structures from source code. InProceedings of 16th International Conference on Software Engineering. IEEE, 49–57.
[32] CharlesW Krueger. 2001. Easing the transition to software mass customization. InInternational Workshop on Software Product-Family Engineering. Springer, 282– 293.
[33] Michele Lanza and Stéphane Ducasse. 2003. Polymetric views-a lightweight visual approach to reverse engineering.IEEE Transactions on Software Engineering 29, 9 (2003), 782–795.
[34] Michele Lanza, Stéphane Ducasse, Harald Gall, and Martin Pinzger. 2005. Code-crawler: an information visualization tool for program comprehension. In Proceed-ings of the 27th international conference on Software engineering. ACM, 672–673. [35] Duc Le, Eric Walkingshaw, and Martin Erwig. 2011. # ifdef confirmed harmful:
Promoting understandable software variation. In2011 IEEE Symposium on Visual Languages and Human-Centric Computing (VL/HCC). IEEE, 143–150. [36] Duc Minh Le, Hyesun Lee, Kyo Chul Kang, and Lee Keun. 2013. Validating
consistency between a feature model and its implementation. InInternational Conference on Software Reuse. Springer, 1–16.
[37] Jörg Liebig, Sven Apel, Christian Lengauer, Christian Kästner, and Michael Schulze. 2010. An analysis of the variability in forty preprocessor-based software product lines. InProceedings of the 32nd ACM/IEEE International Conference on Software Engineering-Volume 1. ACM, 105–114.
[38] Roberto Erick Lopez-Herrejon, Sheny Illescas, and Alexander Egyed. 2018.A systematic mapping study of information visualization for software product line engineering.Journal of Software: Evolution and Process 30, 2 (2018), e1912. [39] Angela Lozano. 2011. An overview of techniques for detecting software variability
concepts in source code. InInternational Conference on Conceptual Modeling. Springer, 141–150.
[40] Jabier Martinez, Nicolas Ordoñez, Xhevahire Tërnava, Tewfik Ziadi, Jairo Aponte, Eduardo Figueiredo, and Marco Tulio Valente. 2018. Feature location benchmark with argoUML SPL. InProceeedings of the 22nd International Conference on Systems and Software Product Line-Volume 1. ACM, 257–263.
[41] Jabier Martinez, Tewfik Ziadi, Tegawendé F Bissyandé, Jacques Klein, and Yves Le Traon. 2017. Bottom-up technologies for reuse: automated extractive adoption of software product lines. InProceedings of the 39th International Conference on Software Engineering Companion. IEEE Press, 67–70.
[42] Andreas Metzger and Klaus Pohl. 2014. Software product line engineering and variability management: achievements and challenges. InProceedings of the on Future of Software Engineering. ACM, 70–84.
[43] Andreas Metzger, Klaus Pohl, Patrick Heymans, Pierre-Yves Schobbens, and Germain Saval. 2007. Disambiguating the documentation of variability in software product lines: A separation of concerns, formalization and automated analysis. In Requirements Engineering Conference, 2007. RE’07. 15th IEEE International. IEEE, 243–253.
[44] Bertrand Meyer. 1988.Object-oriented software construction. Vol. 2. Prentice hall New York.
[45] Richard J Miara, Joyce A Musselman, Juan A Navarro, and Ben Shneiderman. 1983. Program indentation and comprehensibility.Commun. ACM 26, 11 (1983), 861–867.
[46] Thomas Patzke and D. Muthig. 2002.Product line implementation technologies. Programming language view. Technical Report 057.02/E. Fraunhofer IESE. [47] Andreas Pleuss and Goetz Botterweck. 2012.Visualization of variability and
configuration options. International Journal on Software Tools for Technology Transfer 14, 5 (2012), 497–510.
[48] Joe Rosen. 1995.Symmetry in science. Springer.
[49] Joseph Rosen. 2008. Symmetry rules: How science and nature are founded on symmetry. Springer Science & Business Media.
[50] Julia Rubin and Marsha Chechik. 2013. A survey of feature location techniques. InDomain Engineering. Springer, 29–58.
[51] Nikos Salingaros. 2014. Complexity in architecture and design.Oz 36, 1 (2014), 4.
[52] Denny Schneeweiss and Goetz Botterweck. 2010. Using Flow Maps to Visualize Product Attributes during Feature Configuration.. InSPLC Workshops. 219–228. [53] Stefan Sobernig, Sven Apel, Sergiy Kolesnikov, and Norbert Siegmund. 2016.
Quantifying structural attributes of system decompositions in 28 feature-oriented software product lines.Empirical Software Engineering 21, 4 (2016), 1670–1705. [54] Henry Spencer and Geoff Collyer. 1992. # ifdef considered harmful, or portability
experience with C News. (1992).
[55] Ian Stewart and Martin Golubitsky. 2010.Fearful symmetry: is God a geometer? Courier Corporation.
[56] Mikael Svahnberg, Jilles Van Gurp, and Jan Bosch. 2005. A taxonomy of variability realization techniques.Software: Practice and Experience 35, 8 (2005), 705–754. [57] Peri Tarr, Harold Ossher, William Harrison, and Stanley M Sutton. 1999. N degrees
of separation: multi-dimensional separation of concerns. InProceedings of the 1999 International Conference on Software Engineering (IEEE Cat. No. 99CB37002). IEEE, 107–119.
[58] Xhevahire Tërnava and Philippe Collet. 2017. On the Diversity of Capturing Variability at the Implementation Level. InProceedings of the 21st International Systems and Software Product Line Conference-Volume B. ACM, 81–88. [59] Xhevahire Tërnava and Philippe Collet. 2017. Tracing Imperfectly Modular
Variability in Software Product Line Implementation. InThe 16th International Conference on Software Reuse.
[60] Adam Tornhill. 2015.Your code as a crime scene: use forensic techniques to arrest defects, bottlenecks, and bad design in your programs. Pragmatic Bookshelf. [61] C Reid Turner, Alfonso Fuggetta, Luigi Lavazza, and Alexander L Wolf. 1999. A
conceptual basis for feature engineering.Journal of Systems and Software 49, 1 (1999), 3–15.
[62] Richard Wettel and Michele Lanza. 2007. Visualizing software systems as cities. In2007 4th IEEE International Workshop on Visualizing Software for Understanding and Analysis. IEEE, 92–99.
[63] Richard Wettel and Michele Lanza. 2008. Visual exploration of large-scale system evolution. In2008 15th Working Conference on Reverse Engineering. IEEE, 219–228. [64] Wikipedia contributors. 2019. Class (computer programming) — Wikipedia,
The Free Encyclopedia. https://en.wikipedia.org/w/index.php?title=Class_ (computer_programming)&oldid=884947448 [Online; accessed 26-February-2019].
[65] Liping Zhao. 2008. Patterns, symmetry, and symmetry breaking.Commun. ACM 51, 3 (2008), 40–46.
[66] Liping Zhao and James Coplien. 2003. Understanding symmetry in object-oriented languages.Journal of Object Technology 2, 5 (2003), 123–134. [67] Liping Zhao and James O Coplien. 2002. Symmetry in class and type hierarchy.
InProceedings of the Fortieth International Conference on Tools Pacific: Objects for internet, mobile and embedded applications. Australian Computer Society, Inc., 181–189.
[68] Tewfik Ziadi, Luz Frias, Marcos Aurélio Almeida da Silva, and Mikal Ziane. 2012. Feature identification from the source code of product variants. In2012 16th European Conference on Software Maintenance and Reengineering. IEEE, 417–422.
![Figure 1: a: The eight symmetries of the square. Two ver- ver-sions of an 11x15 array of 69 black and 96 white square blocks - b: a random one and c: a Seljuk pattern [1, p68].](https://thumb-eu.123doks.com/thumbv2/123doknet/13303588.398082/3.918.74.445.125.623/figure-symmetries-square-square-blocks-random-seljuk-pattern.webp)