HAL Id: hal-00781765
https://hal.inria.fr/hal-00781765
Submitted on 28 Jan 2013
HAL is a multi-disciplinary open access
archive for the deposit and dissemination of
sci-entific research documents, whether they are
pub-lished or not. The documents may come from
teaching and research institutions in France or
abroad, or from public or private research centers.
L’archive ouverte pluridisciplinaire HAL, est
destinée au dépôt et à la diffusion de documents
scientifiques de niveau recherche, publiés ou non,
émanant des établissements d’enseignement et de
recherche français ou étrangers, des laboratoires
publics ou privés.
Forest fire detection based on Gaussian field analysis
Florent Lafarge, Xavier Descombes, Josiane Zerubia
To cite this version:
Florent Lafarge, Xavier Descombes, Josiane Zerubia. Forest fire detection based on Gaussian field
anal-ysis. European Signal Processing Conference (EUSIPCO), Sep 2007, Poznan, Poland. �hal-00781765�
FOREST FIRE DETECTION BASED ON GAUSSIAN FIELD ANALYSIS
Florent Lafarge, Xavier Descombes, Josiane Zerubia
Ariana Reseach Group - INRIA 2004, routes des Lucioles, BP93 06902 Sophia Antipolis, Cedex France
ABSTRACT
The Thermical InfraRed (TIR) channel contains wave lengths sensitive to the emission of heat. The forest fires can be char-acterized by intensity peaks on TIR images. We present a fully automatic method of forest fire detection from TIR satel-lite images based on the random field theory. First, prepro-cessing is used to model the image as a realization of a Gaus-sian field which presents interesting properties. The fire ar-eas which are supposed to be a minority are considered as anomalies of that field. We present a statistical analysis of Gaussian field to determine a degree of belonging of a clus-ter to the image background (i.e. a realization of a Gaussian field). We then extend this application to the estimation of the fire propagation direction.
1. INTRODUCTION
The forest fires cause a lot of damage and participate to the deterioration of the Earth ecosystem, especially to the global warming. One of the main issues is to quickly locate them in an automatic way. With the recent progress in the spa-tial domain, this detection problem can nowadays be tackled through satellite images.
In this domain, various methods have been proposed. Most of them are based on radiometric analysis from Thermical InfraRed (TIR) images as the work of Flannigan and Vonder Haar [3]. Such algorithms allow to estimate the ground tem-perature and efficiently detect fires using thresholding tech-niques. Hybrid approaches have also been developed such as [7] where TIR data are coupled with varied kinds of in-formation. Other works such as [6] try to detect the forest fires through the emitted smokes by using learning methods. However, most of these methods need either training sets or a priori knowledge concerning the used sensors or the ob-served areas.
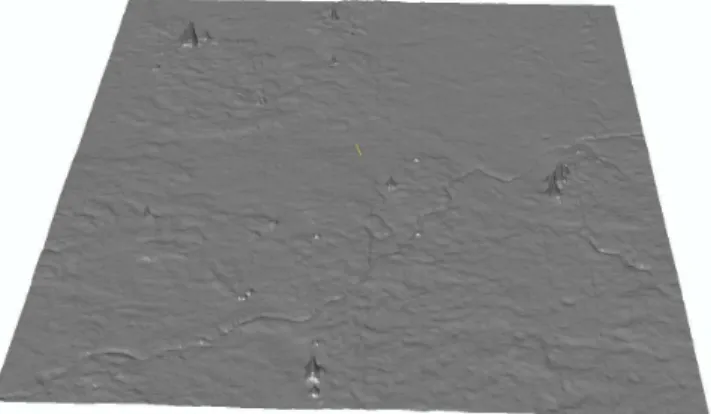
We present a new method which does not use this kind of information. The proposed approach allows to automatically detect the forest fires from TIR satellite images. TIR chan-nel contains wave lengths sensitive to the emission of heat. It means that forest fires can be characterized by intensity peaks on this kind of images. However, all intensity peaks of a TIR image are not necessary forest fires. The main dif-ficulty, as we can see on Figure 1, consists in making the distinction between peaks due to fire and other peaks of the image background which can correspond to industrial activ-ities for example. An anomaly detection method is proposed to achieve this distinction. Such an approach is particularly efficient to extract image irregularities, as it can be seen in [2].
The proposed method is especially adapted to the extraction of anomalies specified by intensity peaks in remote
sens-ing data. The idea consists in modelsens-ing the image as a re-alization of a Gaussian field and determining a degree of belonging of the peaks to the field with respect to both ra-diometric and spatial characteristics. Such a principle has been used in functional MRI by Worsley, Friston and Poline. The proposed approach is based on their works, especially on [4, 9, 10].
Figure 1: Height-map of a piece of TIR image First, definitions and interesting properties concerning the Gaussian fields are mentioned. Then, a preprocessing is set up in order to consider the image as a realization of a Gaus-sian field. A statistical analysis allowing to detect the forest fires is presented in a third part. We then propose an exten-sion to the estimation of the fire propagation direction. Fi-nally, results are shown.
The proposed method is tested on TIR satellite images (BIRD satellite - 300 meter resolution) representing Portu-gal in May 2003.
2. GAUSSIAN FIELDS
In this section, definitions and properties related to the Gaus-sian field theory are presented. More details are available in [1] and [5].
Definition 1 Let(Ω,F ,P) be a complete probability space and T ⊂ RN
a topological space. A N-dimensional real val-ued random field is a measurable mapping X: Ω → RT. X is homogeneous if ∀τ,t1, ...,tk ∈ RN, the vector (X(t1), ..., X(tk)) follows the same distribution that the vector (X(t1+τ), ..., X(tk+τ)).
The collection of measures Ft1,...,tn defined by Ft1,...,tn(B) =
R) is called the family of the Fd(finite dimensional) distri-butions.
Definition 2 A random field is Gaussian if its Fd
distribu-tions are Gaussian vectors.
Definition 3 Let F(t) : RN
→ R be a function. ∀u ∈ R and S⊂ RN, the excursion set of F in S over the threshold u is
defined by :
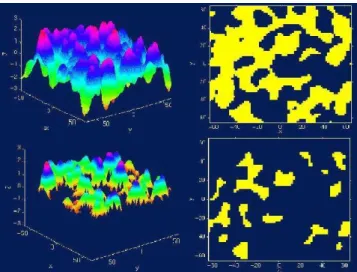
Au(F, S) = {t ∈ S : F(t) ≥ u} (1) In imagery, Aurepresents the set of clusters of an image F at the threshold u (see Figure 2). Adler [1] proposes an
estima-Figure 2: A realization of a 2-dimensional random field (left) associated with 2 excursion sets at different thresholds (right) tion of the number muof clusters in the excursion set Au. For a 2-dimensional homogeneous Gaussian field (centered and reduced), the expectation of muis given by:
E[mu] = S(2π) 3 2|Λ| 1 2exp−u 2 2 (2)
where S represent the volume of the field (i.e the number of pixels in the image) and Λ, the covariance matrix of the field derivatives. This matrix allows to characterize the smooth-ness of the field.
This equation is a key point in the proposed method. How-ever, in order to be able to use it in the imagery domain, the image must verify some hypothesis. In particular, the image must be modeled as a realization of a homogeneous Gaus-sian field. To do so, we approximate a GausGaus-sian field by considering its Fd distributions as Gaussian. It represents an acceptable approximation since the covariance matrix Λ has a minor importance in the algorithm that we propose. In other words, the pixel distribution of the image must, by ap-proximation, be Gaussian (i.e. the image histogram must be Gaussian).
3. PREPROCESSING
Preprocessing must be applied on the image in order to sat-isfy equation (2). The image must be modeled as a realiza-tion of an homogeneous Gaussian field, which imposes that
at least the pixel distribution must be well approximated by a Gaussian law.
To do so, the first step consists in separating the various im-age modes (ground, clouds, sea,...) and in keeping the mode which have the highest intensity mean (i.e. the ”ground” mode which is the closest to pixels representing forest fires). An iterated ”2-means” algorithm, detailed in [5], is used to extract the mode of interest. The obtained sub-image has a unimodal distribution which includes potential forest fires. The forest fires are supposed to be rare events which means that their surface is negligible with respect to the surface as-sociated with the considered mode. This hypothesis, which is necessary to obtain a correct separation of the modes, is acceptable since the complete TIR images represent vast ar-eas of countries such as Portugal.
Then, the obtained class is regularized by using mathematical morphology. This regularization allows to delete the isolated elements of the class and ”to fill in the holes”.
Finally, the last stage consists in normalizing the resulting distribution by a histogram specification. The obtained sub-image has a pixel distribution which is Gaussian. So, This sub-image can be considered, by approximation, as a real-ization of an homogeneous Gaussian field.
These three stages are illustrated in Figure 3 where both the histogram of the image and a piece of the image are shown for each preprocessing steps.
Figure 3: Preprocessing steps - (a): initial histogram of the complete image (top) associated with a piece of the image (bottom) - (b): extraction of the mode of interest - (c): regu-larization of the extracted mode (d): histogram specification by a Gaussian distribution
4. STATISTICAL ANALYSIS
The forest fires correspond to intensity peaks in the sub-image obtained in the previous section. The idea consists in considering this sub-image as a background (which is rep-resented by a realization of a Gaussian field) where some anomalies (i.e. intensity peaks which represent forest fires) can exist. In this context, results concerning the Gaussian field theory, especially the equation (2), can allow to esti-mate whether a cluster belongs to the realization of a Gaus-sian field (i.e. the background). To do so, both radiometric and spatial information related to the cluster are used to de-fine probabilities of belonging.
4.1 Radiometric information
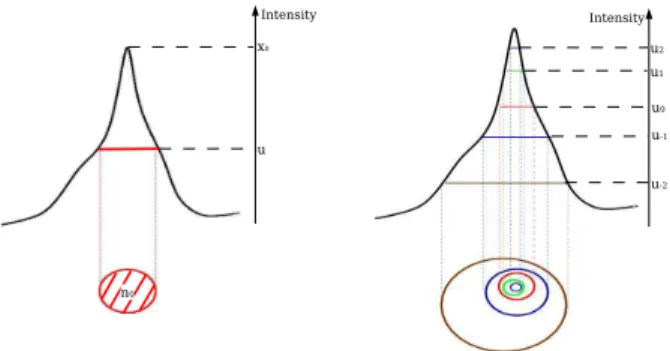
The belonging of a cluster to the background can be esti-mated in function of the maximal intensity of this cluster. Let us consider Cx0
u , a cluster at the threshold u having a maximal intensity x0(see Figure 4 - (left)). In the following, a cluster
established at the threshold u is called a u-cluster. The prob-ability that Cx0
u belongs to the realization of a Gaussian field (noted B as background) is given through the equation (2) by the expectation of the number of x0-clusters to the
expec-tation of the number of u-clusters ratio: P(Cx0 u ∈ B) = E[mx0] E[mu] =xo u exp u2− x2 0 2 (3) This probability is noted PH. The behavior of PHin function of u is particularly interesting: it has an unique minima which allows to fix a reference threshold u0. In the following, this
threshold allows to extract all the clusters which correspond to potential forest fires. More details about the computation of u0are available in [5].
4.2 Spatial information
The spatial characteristics of a cluster and more precisely its surface can also allow to estimate whether the cluster belongs to the background.
Let Nube the number of pixels with an intensity superior to
u, mube the number of u-clusters , and nube the surface (i.e. the number of pixels) of a u-cluster. Nosko [8] has estab-lished that nufollows an exponential distribution. We aim at estimating the parameter of this exponential distribution, i.e. the inverse of the expectation of nu. These variables are linked by the following expression [4]:
E[nu] =
E[Nu]
E[mu]
(4) The pixel distribution is Gaussian, so the expectation of Nu is given by: E[Nu] = S Z ∞ u (2π)−12e−x 2 2dx= S Φ(−u) (5)
The equation (2) allows to estimate the expectation of mu. Then, the expectation of nucan be expressed by the following equation: E[nu] = E[Nu] E[mu] = Φ(−u) (2π)32|Λ| 1 2exp−u 2 2 (6) Let us consider Cn0
u , a u-cluster having a surface n0(see
Fig-ure 4 - (left)). The probability that Cn0
u belongs to the back-ground corresponds to the probability that nuis superior to
n0: P(Cn0 u ∈ B) = P(nu≥ n0) = e− n0 E[nu] = e (2π) 3 2 |Λ| 1 2 n0exp− u22 Φ(−u) (7)
This probability is noted PS. In practice, Λ is computed using the empirical estimators of the variances and co-variances of the field derivatives.
Figure 4: Left: Scheme of a u-cluster having a maximal in-tensity x0and a surface n0(profile and top views of the
inten-sity peak) - Right: Family of sub-clusters and sup-clusters related to the threshold family U
4.3 Algorithm
The probabilities PH and PSallow to estimate the belonging of a cluster to the background using two different characteris-tics of this cluster (i.e. its maximal intensity and its surface). We aim at defining a decision law taking into account both probabilities.
This decision law consists in considering the cluster as for-eigner to the background if:
min(PH,PS) <α (8) whereαis the limit probability, i.e. a confidence coefficient
on the result which acts as a ”P-value”. In practice,αis close
to 10−2. This decision law mainly relies on the probability
PH(i.e. on the radiometric characteristic of the cluster). The probability PSis tested only if the test on PHis rejected. The decision law allows to locally analyze a cluster. We aim at defining a global algorithm dealing with the complete image. First, we extract all the clusters at the threshold u0
(defined in section 4.1) which correspond to potential for-est fires. Then, each detected cluster is extended to a fam-ily of sub-clusters with respect to the famfam-ily of thresholds U= (u−k, ...,u0, ...,uk). This extension allows to have a bet-ter precision concerning the location of forest fires. In prac-tice, we take k= 2 (see Figure 4 - (right)). Finally, the de-cision law is applied to all these clusters. This algorithm is summed-up as follows:
Algorithm 1 .
1. Fix the limit probabilityα, 2. Extract the set of u0-clusters,
3. For each detected cluster,
- Establish the family of clusters w.r.t. the threshold set U ,
- For each element of this family, compute PSand PH,
4. Keep the cluster accepted by the decision law (equation (8)).
5. ESTIMATION OF THE FIRE PROPAGATION DIRECTION
The detected areas can provide additional information by studying the topography of their intensity peaks. Figure 5 represents the typical topography of an intensity peak
corresponding to a forest fire. This peak is composed of two parts. The first one represents the pixels of very high intensity (right side) which present high discontinuities with the neighboring pixels: it corresponds to the fire fronts. The second part (left side) represents lower intensity pixels which refers to the burned area. By considering the alignment of these two areas, the fire propagation direction can be estimated. It provides interesting information related to the evolution of the fires, which can be useful for firebrigades for instance. 0 5 10 15 20 25 0 5 10 15 20 25 0 10 20 30 40 50 60 70
Figure 5: Typical topography of an intensity peak corre-sponding to a forest fire
In order to estimate the fire propagation direction, we pro-pose a very simple but efficient process which consists in comparing the intensity weighted center to the spatial center of the cluster. Let C be the spatial center of a cluster and M, its intensity weighted center (i.e. M=∑ss×xs
∑sxs where the s and xs are respectively the pixels and the pixel intensities of the cluster). The fire propagation direction bθis estimated by the
following expression: b
θ= arg(CM−→) (9) where arg is the argument of a 2D-vector. The value of the modulus ofCM−→can be seen as a confidence coefficient on the estimated orientation. Figure 7 shows results obtained on different clusters. We remark that neighboring clusters have similar orientations. It can be explained by the local influence of the wind in the propagation of the forest fires.
6. RESULTS
The proposed approach has been tested on TIR satellite images (BIRD satellite - 300 meter resolution - 1000× 4000 pixels) representing Portugal acquired at various dates of May 2003.
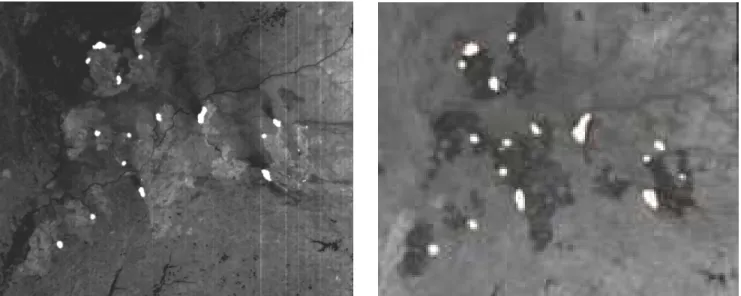
Figure 8 shows a result on a piece of image associated with the ground truth. On the ground truth (which has a lower quality), the white clusters (corresponding to forest fires) have been voluntarily enlarged in order to make a better distinction. 16 forest fires are present on the ground truth. We detect 15 of the 16 forest fires with a confidence coefficientα= 0.05. One false alarm is located.
This result is convincing compared to results obtained by [3].
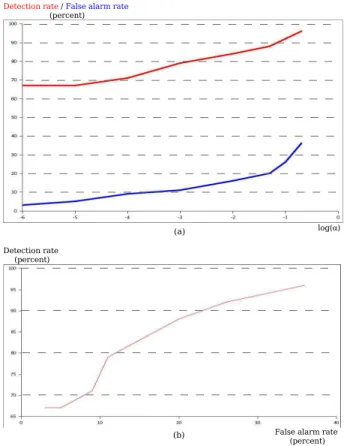
Figure 6: (top): Detection rate (red) and false alarm rate (blue) vs the confidence coefficientα - (bottom): the
corre-sponding ROC curve
Figure 7: Various clusters detected as forest fires (red to yel-low : intensity value) associated with the estimation of their propagation direction (black arrow)
Generally speaking, Figure 6 presents the detection rate and false alarm rate (in term of number of clusters) in function of the confidence coefficient. This figure also shows the ROC (Receiver-Operator Characteristics) curve. The optimal performances are obtained for a confidence coefficient con-tained between 0.05 and 0.01. For instance,α= 0.01 allows
Figure 8: (left): Extract of the result obtained on a TIR image (BIRD c DLR), white clusters represent the detected forest fires - (right): ground truth provided by Alcatel Alenia Space
However, the choice ofαmainly depends on the
applica-tion. For example, firemen will prefer a low confidence co-efficient (i.e. detecting as many forest fires as possible even if many false alarms are located).
The computing time is acceptable: two minutes are neces-sary to detect the forest fires using a 2Ghz processor on a 1000× 4000 image (i.e. an area corresponding to the surface of Portugal).
7. CONCLUSION
The proposed method allows to automatically extract the for-est fires from TIR satellite images. The results only depend onα which acts as a confidence coefficient. Both detection
rate and false alarm rate provide convincing values. Interest-ing information, related to the evolution of the fires, can also be obtained through the estimation of fire propagation direc-tion.
However, the radiometric and spatial information, which al-low to define the decision law, are set up independently. It could be interesting to introduce the probability P(Cx0,n0
u ∈ B) (i.e. the probability that a u-cluster having both a maxi-mal intensity x0and a surface n0belongs to the background)
in the decision law in order to get a more robust method. In the future, we should work on this point.
8. ACKNOWLEDGMENTS
The authors thank the German Aerospace Center (DLR) and Alcatel Alenia Space for respectively providing the data and the ground truth.
REFERENCES
[1] R.J. Adler. The Geometry of Random Fields. Wiley, 1981.
[2] M.J. Carlotto. A cluster-based approach for detect-ing man-made objects and changes in imagery. IEEE
Trans. on Geoscience and Remote Sensing, 43(2):374– 387, 2005.
[3] M. Flannigan and T. Vonder Haar. ”Forest fire monitor-ing usmonitor-ing NOAA satellite AVHRR”. Canadian Journal of Forest Research, 16:975–982, 1986.
[4] K.J. Friston, K.J. Worsley, R.S.J Frackowiak, J.C Mazziotta, and A.C. Evans. ”Assessing the significance of focal activations using their spatial extent”. Hum. Brain Map., 1:214–220, 1994.
[5] F. Lafarge, X. Descombes, and J. Zerubia. D´etection de feux de forˆet par analyse statistique de la radiom´etrie d’images satellitaires. Research Report 5369, INRIA, France, December 2004.
[6] F. Lafarge, X. Descombes, and J. Zerubia. Textural ker-nel for SVM classification in remote sensing : Applica-tion to forest fire detecApplica-tion and urban area extracApplica-tion. In Proc. IEEE International Conference on Image Pro-cessing, Genoa, Italy, September 2005.
[7] Y. Li, A. Vodacek, R.L. Kremens, A.E. Ononye, and C. Tang. A hybrid contextual approach to wildland fire detection using multispectral imagery. IEEE Trans. on Geoscience and Remote Sensing, 43(9):2115–2126, 2005.
[8] V.P. Nosko. ”Local structure of Gaussian random fields in the vicinity of high level shines”. Soviet Mathematics : Doklady, 10:1481–1484, 1969.
[9] J-B. Poline, K.J. Worsley, A.C. Evans, and K.J. Friston. ”combining spatial extent and peak intensity to test for activations in functional imaging”. NeuroImage, 5:83– 96, 1997.
[10] K.J. Worsley, S. Marrett, P. Neelin, and A.C. Evans. A three-dimensional statistical analysis for CBF activa-tion studies in human brain. Journal of Cerebral Blood Flow and Metabolism, 12:900–918, 1992.