Can the Economic Impacts of Infrastructure Projects be Predicted? Economic Development Projects in the Appalachian Mountain Region
by
Jinevra R. Howard
Submitted to the Department of Urban Studies and Planning in Partial Fulfillment of the Requirements for the Degrees of
Master in City Planning and
Bachelor of Science at the
Massachusetts Institute of Technology June 2000
@ 2000 Jinevra R. Howard All rights reserved
The author hereby grants to MIT permission to reproduce publicly paper and electronic copies of this thesis document
Signature of Author ...
and to distribute in whole or in part.
... II..- . '. . - . - - -. .s . . . . . . .
Departr6lent of Urban Studies and Planning February 14, 2000
Certified by ... ... .-. . . . ... ..
KarenhR. Polenske Professor of Regional Political Economy and Planning
Thesis Supervisor
A cce p te d b y . . .. . . . . Paul Smoke Head of the MCP Committee Associate Professor of the Practice of Development Planning
MASSACHUSETTS INSTITUTE OF TECHNOLOGY
MAR 0 3 2000
Can the Economic Impacts of Infrastructure Projects be Predicted? Economic Development Projects in the Appalachian Mountain Region
by
Jinevra R. Howard
Submitted to the Department of Urban Studies and Planning in Partial Fulfillment of the Requirements for the Degrees of
Master of City Planning and Bachelor of Science
ABSTRACT
I carried out a study of infrastructure projects in support of local economic development in a number of counties in the Appalachian Region of the United States in order to identify factors that influence the outcomes of such projects. Such information would help funding agencies decide how best to allocate their funding from the point of view of maximizing the economic impacts of the projects they fund. I compared 52 projects in terms of project type, economic impacts and efficiency of public funding, selected characteristics expected to be associated with successful
projects, and population and employment growth in project areas. For the purposes of this analysis, I defined successful projects to be those with high job creation and retention impacts within each of three "scale groups" composed of projects with similar public-funding levels. I compared projects in terms of their scale groups, within each scale group in terms of their job
impacts, and overall in terms of job impacts. The results indicate that water/sewer projects may tend to have higher job impacts than access-road projects, that projects that target high economic development potential areas and that remove bottlenecks to growth may tend to be successful, and that successful projects often take place in areas with positive rates of population and employment growth. The results also show significant differences in the efficiency of public spending between high- and low-success projects. This emphasizes the need for further efforts at identifying factors associated with project success.
Thesis Supervisor: Karen R. Polenske, Professor of Regional Political Economy and Planning
ABSTRACT
Acknowledgements CHAPTER ONE
Local Economic Development Coverage of the Study
Infrastructure Economic Development Projects Funding for Local Economic Development Projects Expected Findings
CHAPTER TWO
Purpose of Evaluations Shortcomings of Evaluations
Recent Evaluations of Infrastructure and Public Works Programs Role of This Study
CHAPTER THREE
Methodology
Exclusion of Projects From Original Database Assignment of Scale Levels
Determination of Success Levels Analysis
Areas of Interest Project Types
Economic Impacts and Efficiency of Public Funding Selected Characteristics Associated with Project Success Population and Employment Trends in Project Areas Limitations of the Data
Summary
CHAPTERFOUR
Project Performance Overview
Small Projects 39 Medium-Scale Projects 41 Large Projects 42 Project Types 43 Small Projects 43 Medium-Scale Projects 45 Large Projects 46
Comparing Scale Groups 47
Characteristics of Successful Projects 54
Targeting Specific Firms 55
Removing Constraints to Growth and Servicing High-Potential Areas 61
Project Area Characteristics: Population and Employment Trends 67
Small-Project Areas 67
Medium-Scale-Project Areas 68
Large-Project Areas 69
Comparison of Population and Employment Trends by Scale Groups 70
Comparison of Population and Employment Trends by Success Level 71
Summary 72
CHAPTER FIVE 74
APPENDIX A 82
APPENDIX B 88
TABLES
Table 3.1: Frequency of Projects by Scale Group and Success Level Table 4.1 Range and Average Funding Levels and Impacts of Small,
Medium-Scale, and Large Projects
Table 4.2 Efficiency of Public Funding for Large, Medium-Scale, and Small Projects
Table 4.3 Selected Project Impacts of Small Projects
Table 4.4 Average Project Impacts and Efficiency of Public Funding of Small Projects
Table 4.5 Selected Project Impacts of Medium-Scale Projects
Table 4.6 Average Project Impacts and Efficiency of Public Funding of Medium-Scale Projects
Table 4.7 Selected Project Impacts of Large Projects
Table 4.8 Average Project Impacts and Efficiency of Public Funding of Large Projects
Table 4.9 Infrastructure Improvements of High-, Medium-, and Low-Success Small Projects
Table 4.10 Infrastructure Improvements of High-, Medium-, and Low-Success Medium-Scale Projects
Table 4.11 Infrastructure Improvements of High-, Medium-, and Low-Success Large Projects
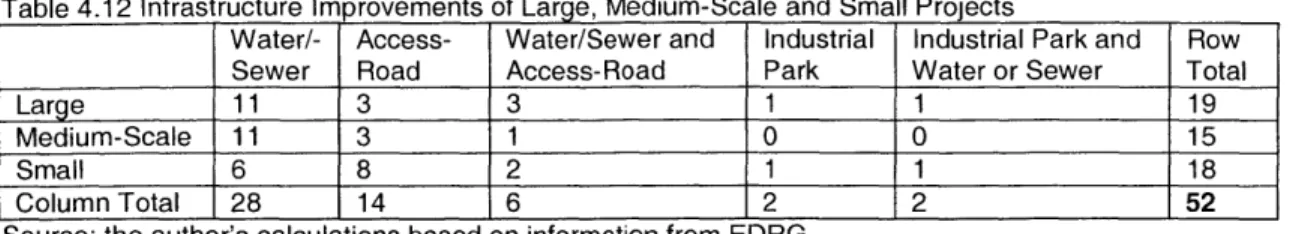
Table 4.12 Infrastructure Improvements of Large, Medium-Scale and Small Projects
Table 4.13 Infrastructure Improvements of High-, Medium-, and Low-Success Projects for All Projects
Table 4.14 Percent of Projects with Selected Characteristics - by Scale Group and Success Level
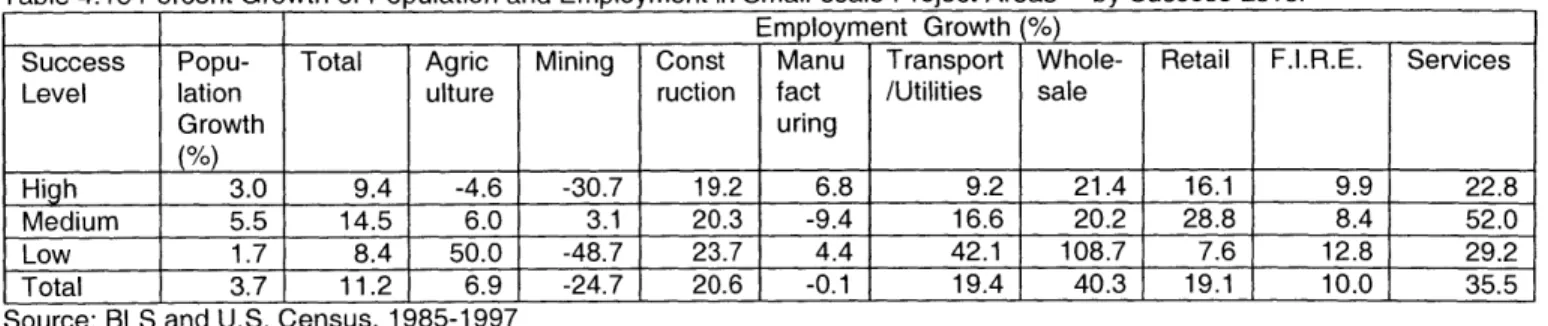
Table 4.15 Percent Growth of Population and Employment in Small-scale Project
Table 4.16 Percent Growth of Population and Employment in Medium-Scale
Project Areas - by Success Level
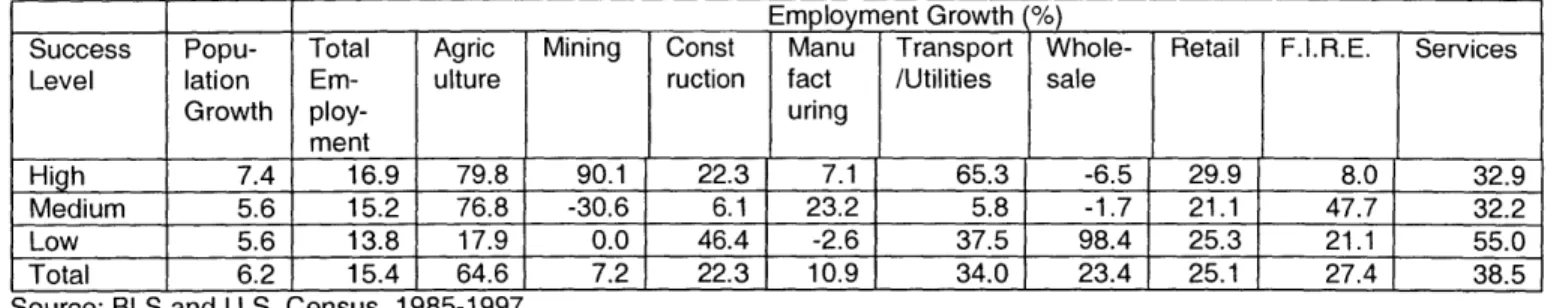
Table 4.17 Percent Growth of Population and Employment in Large-scale Project
Areas - by Success Level
Table 4.18 Average Percent Change in Population and Employment by Scale Group
Table 4.19 Average Percent Growth in Population and Employment
Table 5.1 Average Public Funding by Source - Small, Medium-Scale, and Large Projects
Acknowledgements
I would like to thank Karen R. Polenske and Karl Seidman for their help in reading and commenting on this paper during its many stages. Their help was invaluable.
I would also like to thank Carlos Quintero for his suggestions and Michael Howard for his support and encouragement.
Chapter One Introduction
The purpose of this paper is to evaluate local economic development projects consisting of infrastructure improvements with the goal of identifying factors that influence the outcomes of such projects.
Local Economic Development
Since the 1970s, local officials have responded to changes in the
organization of the economy by targeting several strategies to promote economic development in their communities. The most general goal of local economic development efforts is to increase the local economy's capacity to create wealth for local residents, where wealth may refer to income from jobs, private and
public goods and services (including the fiscal resources to pay for public goods and services), and quality-of-life factors. Common strategies of local economic
development include attracting businesses, retaining and supporting the
expansion of existing businesses, diversifying the local economy, and revitalizing or redeveloping older areas.
Local areas may face a number of underlying weaknesses that prevent economic growth, such as poor infrastructure, weak human capital, sectoral imbalances, lack of entrepreneurial activity, distance from large markets and production and service centers, weak institutions and social capital, and poor public-sector capacity to implement local development solutions. Depending on the conditions present in a particular local area, various underlying weaknesses present challenges with which local officials pursuing economic development must grapple.
The goal of local economic development projects is to overcome these challenges and to fulfill the community's economic development needs. In many cases local resources are insufficient to pursue the projects that are needed to forward economic development goals. Local officials can take advantage of regional, state, national, and private funding to supplement local resources. This funding comes from state and federal government and non-government
agencies.
Most of agencies that contribute to economic development projects ultimately want to help generate sustainable economic development at the local level. To be sustainable, the future economic development of the area must not require a continual input of outside funding. Economic development therefore must stimulate sustainable private-sector activity, whether by attracting a new business that is likely to stay in the area, encouraging existing businesses to stay and expand in the area, or stimulating the growth and development of new
businesses. Thus, many projects are focused on trying to attract new
businesses to the area, encourage the growth of existing businesses, or foster the growth of new businesses. Infrastructure improvements are one way that
local officials try to make the area more attractive for new and existing businesses.
Coverage of the Study
In this paper, I focus on economic development projects involving
improvements in an area's stock of physical infrastructure. My goal is to identify factors that are associated with, and perhaps causally related to, the outcomes of
infrastructure projects. One of the important applications of this information would be to assist funding agencies in making allocation decisions about which projects to fund. It is important to consider this question of what makes
infrastructure projects succeed or not succeed: a comparison of high- and low-success projects (discussed later in the paper) shows that, depending on the level of funding received by the project, successful projects can be up to 75 times as efficient as unsuccessful projects in their use of public funding. The goal of public funding is to improve society as much as possible while spending as few public dollars as possible, and the ability to predict project outcomes would allow funding agencies to generate more economic impact per dollar spent.
The projects that I discuss in this paper involve transportation, water, and wastewater infrastructure, as well as some site development for industrial parks. These types of infrastructure fall into Hansen's (1965) category of "economic") overhead and deal with what is sometimes called "economic infrastructure" (Currea and Polenske, 1985). In contrast to "social infrastructure" such as schools and hospitals, "economic infrastructure" directly supports private-sector economic activities.
Hirschman (1958) distinguished social overhead capital (SOC), generally provided and operated by the public sector, from directly productive activity (DPA) generated by the private sector. SOC delivers basic services that private production depends upon, such as transportation, public health, power, and education. The availability of transportation and power, most importantly, are
'preconditions' of development. (Hirschman 1958, Rockler 2000) Hansen (1965) distinguished between "economic" overhead, which supports directly productive capital and includes roads, bridges, power-generation projects, etc., and "social" overhead, which benefits society more generally and includes health, education and social welfare functions (Hansen 1965, Rockler 2000). Economic overhead capital can create benefits that private investment can take advantage of, creating the possibility for economic growth through investments in roads, power utilities, water systems, and so on. (Rockler 2000). However, additional investments in social or economic infrastructure are not productive once a region is 'congested', meaning that the marginal social productivity of any new DPA is negative. Public investment will create the appearance of capacity for more private investment, which will attract DPA; however, this DPA will increase the congestion of the area.
Infrastructure Economic Development Projects
Infrastructure projects in support of local economic development focus on providing adequate infrastructure for existing businesses to maintain their
operations or to expand, or for new businesses to locate in the area.
Infrastructure projects can also indirectly help solve sectoral imbalances by targeting infrastructure improvements to benefit a particular type of industry. Infrastructure projects in support of economic development may include site preparation for industry attraction, the building or renovation of roads, water or sewer lines, water or sewage treatment or storage plants, other utilities, or
facilities for business operations. In some cases infrastructure improvements are made to secure a prospective or planned private investment that is contingent on the area making the infrastructure improvement. In other cases, infrastructure projects are pursued with the more general goal of making the area more attractive for industry or businesses to locate. Another possible economic
development function of an infrastructure improvement is to remove bottlenecks that constrain an area's growth.
Physical infrastructure is an important component of an area's capacity for economic development. The importance of physical infrastructure can be looked at from a number of perspectives. From the point of view of business location theory, infrastructure can either support or detract from the attractiveness of an area for private investment. Studies of the relationship between public
investment in infrastructure and economic growth have often considered physical infrastructure as an input into the production processes of businesses, affecting the cost of production and thus the profit margin of businesses (Rockler 2000). Although this relationship is still not well understood, adequate public
infrastructure is recognized as contributing to the productivity of local firms as well as to overall economic growth (Blair 1995).
Public infrastructure can also be considered in terms of its contribution to external economies, such as localization and urbanization economies.
Localization economies refer to the cost savings of related firms that utilize the same infrastructure improvement. For example, a project that services a
wood-industry industrial park would be contributing to localization economies. Urbanization economies are defined as "cost savings that accrue to a wide variety of firms when the volume of activity in an entire urban area increases."
(Blair 1995) Blair calls urbanization economies "the most diffuse type of
agglomeration economies." Infrastructure that makes a place more attractive for businesses may begin to attract new businesses. As more businesses are attracted, the per unit cost of maintaining the infrastructure decreases due to economies of scale. It can be argued that without an initial stock of
infrastructure, economies of scale can never be reached and economic growth may be unable to sustain itself. Although the precise impacts of infrastructure on economic growth are difficult and perhaps impossible to measure, it is clear that infrastructure is a necessary component of a stable and healthy economy.
Funding for Local Economic Development Projects
The responsibility for building and maintaining local physical infrastructure is almost always in the hands of the local government. The fiscal resources of many areas are inadequate to make needed infrastructure improvements, and local governments often rely on outside funding to supplement their resources in support of infrastructure projects.
Every year many potential infrastructure projects in support of economic development are in need of funding from state, regional, private, and federal sources. In the United States, the Economic Development Authority (EDA) and the Appalachian Regional Commission (ARC) are two of the largest agencies that help fund local development projects. The EDA was established under the
Public Works and Economic Development Act of 1965. Its goals are to generate new jobs, help retain existing jobs, and stimulate industrial and commercial growth in economically-distressed areas of the United States. The ARC was established under the Appalachian Regional Development Act in 1965 to support
economic and social development in the Appalachian Region. Its mission is to help residents of Appalachia to create opportunities for self-sustaining economic development and improved quality of life. Both the ARC and the EDA have
public works and infrastructure programs that provide partial funding for local infrastructure and public works projects. While the EDA specifically funds projects tied to local economic development, the ARC also funds infrastructure projects with primarily residential, quality-of-life goals.
Funding agencies such as these want to put their money into the most productive use, so that they need some way of making a reasonable
determination of what projects are likely to be successful. How do we look at projects that are up for consideration and decide which ones are likely to be successful?
Expected Findings
There are several factors that I would expect to affect the level of success of local infrastructure projects in support of economic development. A project is more likely to be successful if it clearly articulates a strategy for fulfilling
recognized economic needs of an area, such as recruiting a particular business or type of industry, removing bottlenecks to growth, or targeting an area with high economic development potential. The more specifically local officials can
articulate the economic development strategy that they are pursuing, the more focused they can be in their efforts to meet these needs.
An area's strategy for fulfilling its economic needs through a particular project might consist in trying to attract a certain type of industry or a particular business. Projects that are implemented in order to enable a private investment
that is contingent on the infrastructure improvement, or that at least have in some way committed to the area, would tend to be more successful than projects that
pursue vague goals of making the area more attractive to industry without having a "bird in hand." For example, a business may agree to locate in an area as long as the sewer lines are extended to serve the prospective site of their facility. In this case, completing the necessary improvement is likely to be successful in terms of its economic development aims. A project with more general goals,
such as to increase the attractiveness of the area for industry without having any specific businesses or even a particular type of industry in mind, is less likely to achieve its economic development goals.
An area's economic development strategy might also include projects to remove specific bottlenecks that are constraining economic growth. If there are one or two bottlenecks to the growth of an area, a project that removes the remaining bottlenecks to growth is likely to be successful. However, a project may make a needed infrastructure improvement and still not meet its economic development goals if other infrastructure improvements still need to be made, or other challenges still remain that inhibit economic development in the area.
A project is more likely to be successful if it is implemented during a period of economic growth in the area. If the population is growing, businesses may be more likely to respond to a project's efforts to improve the area, because of the availability of labor and/or increasing market size. Also, the sales of existing businesses may increase due to the larger market size, perhaps encouraging these businesses to expand.
A project may be more successful if the industrial sector the project is targeting is growing in number of establishments, number of employees, or
income/output during the time of project implementation. This may give the area the appearance of a good place for that type of industry to locate their operations in. Additionally, a project may be more successful if other sectors are growing that support or link into the sector being targeted.
Chapter Two
Evaluations of Local Economic Development Projects
Agencies that fund economic development projects often conduct
evaluations of these projects in order to assess the impacts that their funding has had.
Purpose of Evaluations
Evaluations of economic development projects can serve two general purposes for funding agencies. One of the main purposes that evaluations of economic development projects serve is to justify the existence of an
organization that is accountable for the projects' outcomes. Potential projects compete for funds from funding agencies, but funding agencies are often
dependent for their funds on other sources, public and private. An evaluation of projects that an agency contributed to may provide evidence that the agency's funding is serving a valuable purpose, and this may be used as an argument by that agency that they should continue to receive their funding. The other main
purpose that evaluations of economic development projects serve is to improve future internal decision-making of funding agencies. A funding agency can use
information about outcomes of past projects and how these projects were implemented to make adjustments to its policies and programs so as to make them more effective in achieving that agency's goals.
As noted earlier, efficient use of agency funding would be greatly facilitated if there were a method for predicting which projects are likely to be
successful. Thus, the question of what factors influence the economic impacts of local economic development projects is important. Evaluations of local economic development projects have the potential to provide insight into the relationship between infrastructure and economic development and to assist in understanding what factors influence the outcomes of infrastructure economic development projects.
Shortcomings of Evaluations
Evaluations often focus on assessing the economic impacts of
infrastructure projects without inquiring into the reasons that some projects are more successful than other projects. Evaluations are generally focused on determining the impacts of an agency's program, which has contributed to a
number of projects. The evaluations tend to focus on limited aggregate
indicators, such as the total number of jobs created by all projects funded by a program. When evaluations are pursued as a means to justifying the need for future funding of an agency, they may focus on a limited number of indicators that show the greatest overall impacts of the agency's program. Furthermore, it
may not be desirable to compare individual projects with one another when they were both funded by the same agency. Local officials, as well as officials within funding agencies who make decisions about which projects to fund, would
benefit from some insight into what makes some projects succeed and others not succeed. There is often a limitation of resources, such as inadequate information about projects, project areas, and project outcomes, or a lack of sufficient funding to conduct a thorough evaluation.
Examples of evaluations that are done to assess the impacts of economic development projects or programs are common. For example, Bingham and Bowen (1994) conducted an impact evaluation designed to verify empirically whether state economic development programs accomplish what they are
designed to accomplish. Isserman and Rephann (1995) conducted an evaluation of the economic impacts of 26 years of the Appalachian Regional Commission (ARC) program that was designed to accurately assess what portion of the
improvement in income and other indicators in Appalachian counties was actually attributable to the investments ARC had made in the region. Funding agencies such as the ARC and the Economic Development Authority (EDA), and
international agencies like the International Monetary Fund and the World Bank, conduct internal evaluations to determine the impacts of their programs, as well.
The World Bank has been perhaps the most important international institution in terms of investigating what influences the success or failure of development projects (Jenkins 1997). According to Jenkins, the World Bank has conducted studies that identify at least least two determining factors in project
performance. First, Jenkins described a study that showed that the quality of economic analysis done to evaluate projects before they are implemented is
highly correlated with the actual performance of the project: that is, low quality economic analysis is associated with unsatisfactory project performance, though a causal relationship is by no means clear. The other determining factor
identified by World Bank research, according to Jenkins, is that of
macroeconomic stability in project countries. The research consisted in
comparisons of development projects in many different countries, and the results showed better performance for projects in countries with greater macroeconomic
stability. This information would not help agencies such as the ARC and the EDA make decisions about how to allocate funding among potential projects, however. There remains a need for evaluations that pursue as their primary focus this question of what factors influence the outcomes of local economic development projects.
One way to evaluate local economic development projects with the goal of helping local officials and funding agencies make future determinations about which projects are most likely to succeed, is to look at past projects that were successful and to try to find out why they were successful. Given limited
information about the projects and their outcomes, I examined the available data and tried to identify common characteristics of successful projects. In order to conclude that common characteristics of successful projects may be causally related to (rather than just correlated with) project success, I also compared less successful or unsuccessful projects. Common characteristics of successful projects should be consistently lacking in unsuccessful projects, or opposite characteristics to those found in common among successful projects should be found in common among unsuccessful projects, in order to conclude that the common characteristics identified in the comparisons are among the factors affecting project outcomes. I stress, however, that even perfect correlation cannot guarantee the presence of causality between factors.
Recent Evaluations of Infrastructure and Public Works Programs In the early 1990s the EDA commissioned an evaluation of their Infrastructure and Public Works program (Evaluation of the U.S. Economic Development Administration's Public Works Program, 1992). The main goal of
the evaluation was to assess the impacts of EDA's program. However, it also included an attempt to identify factors that influenced project outcomes. The consultants who implemented the study concluded that the available quantitative data only explain a small proportion of what distinguishes successful from
unsuccessful projects.
There are a few possible reasons for this. First, the primary emphasis of the evaluation is on assessing the impacts of projects; identifying factors that influence the impacts of individual projects was a secondary goal and may not have received sufficient attention. Second, the scope of the evaluation may have been too large to pursue this type of analysis: the 233 projects that were
evaluated were implemented in all six of the EDA regions, which cover the entire United States. Projects in widely different geographical regions with very
different economic backgrounds and histories may be too diverse to yield any useful comparisons. Third, the evaluation considered a range of measures of project impacts. Although this approach avoids an overly narrow conception of project success, it does not consider the possibility that different factors influence different individual outcomes of economic development projects. For example, there may be factors that influence the success of projects in terms of job
creation and separate factors that influence the success of a project in terms of the number of businesses it serves or whether it reaches its projected capacity. Considering project outcomes according to multiple and broad measures of project success may make the process of identifying specific factors that influence the outcomes more complex and difficult. If a provisional, restricted definition of project success is used to rank projects, and then projects are
compared according to this ranking, it may be possible to identify characteristics of projects that perform well on that particular measure.
In 1999, the ARC also commissioned an evaluation of its Infrastructure and Public Works projects (Evaluation of the ARC's Infrastructure and Public Works Program, 2000). Like the EDA evaluation, the ARC evaluation assessed project outcomes along a range of economic measures. The ARC evaluation covered projects in the Appalachian region; thus, it had a more focused geographical scope of inquiry than the EDA evaluation. However, the ARC evaluation did not inquire into what factors influence projects' outcomes, but
rather focused on assessing the impacts of the ARC projects.
Neither the ARC nor the EDA evaluation distinguishes between projects of different scales for purposes of comparison. Both evaluations evaluated different types of projects separately, according to their own classification scheme.
However, large projects and small projects are likely to succeed or fail for different reasons. If the aim of an evaluation is to identify factors that influence project success, projects of widely different scales should be analyzed
separately.
Role of This Study
My paper fills the gap that I saw in evaluations of economic development projects involving physical infrastructure. I saw a need for an evaluation that focused on identifying factors associated with project success, while limiting the scope of projects to a relatively small geographic area. Although what
distinguishes a successful project from an unsuccessful project may be a combination of multiple factors, difficult to separate and identify, the importance
of understanding what makes projects succeed or fail demands that more careful, extensive inquiry be made into this question. By comparing individual projects of similar scale (level of funding) and within a geographical region which, though not homogenous, does bear some internal similarity, I hoped to identify common characteristics of successful projects that might have some explanatory power regarding the projects' outcomes.
Chapter Three
Data and Methodology for Evaluating the Success and Failure of Local Economic Development Projects
The legislation that authorizes the ARC defines the Appalachian Region as a 200,000-square-mile region in and around the Appalachian Mountains, stretching from southern New York to northern Mississippi. The Appalachian region includes all of West Virginia and parts of Alabama, Georgia, Kentucky, Maryland, Mississippi, New York, North Carolina, Ohio, Pennsylvania, South Carolina, Tennessee, and Virginia. About 22 million people live in the 406 counties of the Appalachian Region; 42 percent of the Region's population is
rural, compared with 20 percent of the national population. The extraction of natural resources (timber and coal) and manufacturing (largely wood products and textiles) were the early economic activities in the region. Economic activities in the region have diversified in recent years, including more emphasis on
services and the development of tourism in some areas.
ARC goals have also shifted since its inception, however the provision of infrastructure remains important in its programs. ARC's early programs focused on improving accessibility in the region; in particular, the major portion of early ARC funds went into building a highway system through the Appalachian region to connect it with the interstate highway system. ARC also funded many health and education programs, and improved local water and sewer infrastructure in
many communities.
In 1999, the Brandow Group in Pennsylvania and the Economic
Development Research Group (EDRG) in Boston, MA conducted an evaluation of infrastructure projects that received part of their funding from the Appalachian
Regional Commission (Evaluation of the ARC's Infrastructure and Public Works Program, 2000).
Methodology
The evaluation focused on 99 projects involving infrastructure and public works improvements that were implemented in the early to mid 1990s. I
analyzed a subset of these projects with the aim of determining what factors affected whether a given project was more or less successful.
Exclusion of Projects From Original Database
Starting with a data set of 99 projects developed by the author and other consultants at EDRG, I excluded a number of these projects from the data set for
my analysis, in order to focus on projects with economic development goals. I also excluded projects that had not been completed by 1997 in order that a few years had passed for the project's short-term effects to be seen. I have
interviewee responses to the question of "What community needs was this project designed to fulfill?" I used these responses, which ranged from specific goals to replace jobs lost from a company closure to more general job creation and "economic and community development" needs, to determine which projects had economic development goals. Thus, I excluded projects with responses such as "public health," "community development," or "need to provide clean water for residents." I also excluded business incubator projects,
in which industrial space was constructed or renovated to serve new or small businesses. In general, these were at such a different scale from the other projects that I would have had difficulty comparing them to the other projects,
which consisted predominantly of water system, sewer system, and road improvements. In addition, only about four of the business incubator projects had specific job-creation goals (the others were mostly designed to provide more affordable industrial space and/or business support to new and small businesses,
or to redevelop brownfields).
Assignment of Scale Levels
It is likely that projects that consist of large-scale infrastructure
improvements may have much larger impacts than projects that make small-scale improvements. For this reason, I decided to sort the data set into groups of projects of a similar scale and then conduct comparisons of the projects within each scale cohort, in order to identify factors associated with successful projects. I took funding level as a proxy for the scale of the project, assuming that larger-scale projects used more funding than smaller-larger-scale projects.
I then separated the projects into three groups based on total project funding. The 18 small projects received less than $400,000 in funding; the 15 medium-scale projects received from $400,000 to less than $1 million in funding; and the 19 large projects received from $1 million to less than $3.1 million in funding. I did not analyze four very large projects, which received more than $4 million in funding, because they would have been outliers to the large-project group, but they were not numerous enough to form their own group.
The 52 remaining projects involved a variety of infrastructure
improvements in support of economic development. Project activities included the construction and renovation of access roads; water- and sewer system-extensions and expansions, including the construction of storage and treatment
tanks; and site development and building construction in industrial parks. The projects experienced varying degrees of success, which made the data set appropriate for the type of analysis I performed, which focused on identifying common characteristics among successful and less-successful projects.
Determination of Success Levels
In order to compare individual projects, I had to choose one measure by which to rank the projects' success levels. I decided to use the total number of jobs resulting from the project as this measure. Given that one of the main goals of local economic development is job creation, I determined that a measure of the employment retention and generation of each project would be a reasonable
and informative way to rank the projects for the purpose of identifying and comparing projects with different levels of success.
Thus, in addition to sorting the projects into groups based on their level of funding, I further separated the projects within each group according to their employment impacts. Natural breaks in the data allowed me to separate each scale group into three segments, which I call high-success or high-ranking, medium-success or medium-ranking, and low-success or low-ranking projects (See Table 3.1). In the small-scale project group, natural breaks in the data separated four projects that resulted in 30 jobs or less, seven projects that
ranged from 80 to 150 jobs, and seven projects that resulted in over 250 jobs. The breaks in the medium-scale projects separate four projects that created 65
or fewer jobs, a set of six middle-range projects that resulted in more than 100 jobs but fewer than the group mean of 532 jobs, and five projects that resulted in
three groups: nine projects with fewer than 450 jobs, four projects with over 700 but fewer than 1000 jobs, and six projects with more than 1000 jobs.
Tahl 3 1 Frequency of Proiects by Scale Group and Success Level
Scale Group High Success Medium Success Low Success Total Number Number Number Number of Number Number Number of
of of Jobs of Jobs of of Jobs Projects
Projects Projects Projects
Large 6 > 1,000 4 700-1,000 9 < 450 19
Medium 5 > 700 6 100-532 4 <= 65 15
Small 7 > 250 7 80- 150 4 < 30 18
All Projects 18 17 17 52
Source: author's calculations based on EDRG information
Analysis
My analysis consists of three types of comparisons. I compare scale groups with one another; I compare projects of different success levels within each scale group; and I compare all projects of different success levels. The latter comparison requires a new grouping of projects: all high-success projects
(small, medium-scale and large) are compared with all medium-success projects and all low-success projects.
Areas of Interest
I perform these comparisons for four main areas of interest: (1) economic impacts and efficiency of public funding, (2) project type , (3) selected
characteristics associated with employment impacts, and (4) population and employment trends in project areas.
Project Types
My comparison of project types consists of an analysis of how the type of infrastructure involved in economic development projects is related to project scale and level of employment impacts. I classify each project under one of five main project types: exclusive water/sewer projects, exclusive access-road projects, combined water/sewer and access-road projects, industrial-park projects, and combined industrial- park and water/sewer projects. Exclusive water/sewer projects consist of projects in which water and/or sewer
infrastructure was constructed, improved, or expanded. Examples of such projects include construction of water storage tanks, extension of water and sewer lines to a previously unserved site or area, or expansion of an existing water- or sewage-system's capacity. Exclusive access-road projects consist of projects in which access-roads were built or improved. Some projects involve access roads as well as water or sewer infrastructure, such as several projects serving industrial parks. I classify these as combined access-road and
water/sewer projects. A few projects consist of site acquisition or facility
improvements in industrial parks, and I classify these as industrial-park projects. Finally, a few projects involve industrial-park improvements, such as those described for industrial park projects, but also include water/sewer infrastructure. I classify these as combined industrial-park and water/sewer projects. My analysis of project types differs from the EDA and ARC evaluations in that I compare projects by their scale levels and not only by the type of infrastructure they involve.
Economic Impacts and Efficiency of Public Funding
I then compare the economic impacts and efficiency of public funding for projects of different scales and success levels. I consider economic impacts in terms of jobs, businesses served, and private investment. Total jobs refers to the sum of (1) jobs that were reported to have been retained by the project, (2)
new jobs the creation of which was attributed to the project, and (3) new jobs the creation of which is indirectly tied to the project. Private investment leveraged by the project is a measure of business investments that were reported to have resulted from the project. For example, for a project in which a sewer line served a site in an industrial park at which a manufacturing firm located, the private investment leveraged would be the spending of the manufacturing firm associated with their new facility. Business served refers to the number of businesses that were served by the project. These numbers, in general, reflect the number of businesses that directly benefited from the project: thus I expect the number to be larger for large projects and smaller for small projects.
However, some large projects serve one large company, and in such cases the number of businesses served would not correlate with the scale of the project. The number of businesses served by a project gives a slightly different measure of success than private investment or employment measures, since a project may succeed in serving a large number of small businesses while having smaller impacts in terms of jobs and private investment than a project that serves one large business. I present the data but, as mentioned above, I use employment impacts to rank the success of projects within each scale group throughout the analysis.
The two private consulting groups (mentioned earlier) that conducted the ARC Evaluation developed these data, and I did not alter the data for my analysis. The consulting firms obtained data on the number of businesses served, the number of jobs retained and created, and the private investment leveraged by each project during interviews with local officials in the county in which the project was implemented. These officials were often the recipients of the ARC grants for the projects in question, and they were generally elected
officials and/or members of local economic development organizations.
The consultants at the EDRG calculated the number of direct and indirect jobs resulting from the project as follows. They obtained figures on the number of jobs retained by the project and the new jobs resulting directly from the project in the interviews. They used the Impact Planning (IMPLAN) model to calculate the indirect and induced jobs resulting from the project. A multiplier for each project was given by county-level IMPLAN data for the industrial sector or sectors
most directly impacted by the project and multiplied by the number of new jobs resulting directly from the project.
I consider the efficiency of public funding in terms of the ratio of public dollars spent to jobs resulting from the projects and the ratio of private
investment leveraged to public dollars spent. By comparing small, medium-scale, and large projects according to their economic impacts and the efficiency with which public funding is used, I obtain information about the relationship between the level of public funding a project receives and the level and efficiency of economic impacts that result from the project. I then compare the private
investment and business service impacts of projects with different levels of employment impacts to obtain information about how different indicators of
success are related and about the quality of employment impacts as a measure of overall project success.
Selected Characteristics Associated with Project Success
I consider several characteristics of projects that I expect to be associated with project success (as measured by employment impacts). I compare the number of projects in the different scale groups and success levels that have the characteristics of targeting specific businesses, targeting areas with economic development potential, and/or removing bottlenecks to growth. This part of the analysis is one of the most important in terms of identifying characteristics associated with project success levels.
Population and Employment Trends in Project Areas
Finally, I compare the projects with respect to population and employment growth in project areas during the period surrounding project implementation.
Using data from the Bureau of Labor Statistics on Mid-March employees and data from the U.S. Census Bureau on yearly population estimates, I calculate for
each project area the change in population and employment from the year before the project began to two years after the project was completed. (Project starting
and ending dates are included in the EDRG database from which I obtained much of the data that I use throughout this analysis.) In a few cases, projects were completed in 1996 or 1997, so that data are unavailable for the years after the project was completed. In these instances I calculate the change in
population and employment up until the most recent year for which data are available. My comparison of projects of different scale and success levels with
respect to the population and employment growth that the project areas were experiencing is another important component of this analysis, as described in previous chapters.
Limitations of the Data
The data are limited in several respects. First, I am using interview data collected in preparation of the Evaluation of ARC's Infrastructure and Public Works Program Projects. The purpose of the data was primarily to assess the
impacts of these projects and not to identify factors associated with project success. Second, the data on businesses served by the projects, private investment leveraged, businesses targeted, etc. were self-reported by
interviewees, most of whom were involved in designing and/or implementing the project. The data therefore may overestimate the actual impacts of the projects. However, this may be true for all the projects and may not affect the overall
results. Third, I am using employment data from the Bureau of Labor Statistics, which does not distinguish between full- and part-time jobs when reporting
number of employees. Fourth, the data on the projects reflect the projects' short-term impacts. However, some impacts of infrastructure projects only become
apparent in the long-term. This study will not capture these impacts.
Summary
I use data developed by the ARC and the EDRG to analyze 52 infrastructure projects in the Appalachian mountain region. I compare the projects in terms of their scale level, which is defined by the amount of funding they receive, and by
their success level, which is defined by the number of jobs resulting from the projects. I examine project performance in terms of jobs created and retained (including direct, indirect, and induced), businesses served, and private
investment leveraged by the projects. I consider the distribution of the type of infrastructure improvement made by the projects with respect to their scale and their success level. I present data on the frequency of certain characteristics in projects of different scale and success levels, and, finally, I look at population and employment trends in project areas. The goal of the analysis is to identify factors that are associated with, and perhaps causally related to, project outcomes.
Chapter Four
Examining the Success and Failure of Local Economic Development Projects in Appalachia
In this chapter, I present the results of my analysis of 52 infrastructure projects in the Appalachian region implemented in the late 1980s to mid 1990s.
If factors associated with project success can be identified, funding
agencies can use this information to make better decisions about how to allocate their funding resources in order to achieve certain types of economic impacts. Different types of outcomes may be associated with different causal factors: characteristics of projects that result in a lot of employment opportunities may differ from those associated with projects that serve a lot of businesses. In this chapter, I focus on economic impacts in terms of jobs. Employment opportunities are a primary emphasis of most economic development programs and projects, and an understanding of the characteristics of projects that result in high
employment generation and retention would be valuable for many funding agencies, as well as for local economic development officials.
In the first part of the chapter, I discuss economic impacts of projects in different scale groups and success levels. I consider economic impacts in terms of jobs, private investment, and businesses served by the projects. I also
discuss differences in the efficiency with which public funding was used to achieve project impacts. I then discuss variations in the efficiency of public funding in terms of jobs created and private investment. My expectation is that average impacts in terms of private investment will be larger for successful projects. Because I defined success in terms of jobs, job impacts will clearly be higher for high-success projects within each scale group, while average impacts
in terms of businesses served may or may not correlate with the project-success level I defined.
In the second part of the chapter, I discuss the frequency of different types of infrastructure projects in different scale groups and success levels of projects.
In the third part of the chapter, I discuss selected characteristics of the projects that I expect to be associated with successful projects. These include the characteristics of being targeted at specific businesses, being targeted at areas with high economic-development potential, and removing bottlenecks to growth. I expect successful projects to be tied to specific businesses and to have removed bottlenecks to growth and/or served areas with high economic
development potential. I expect these characteristics to be less frequent among projects with low levels of success.
Finally, I compare population and employment growth in the project areas, by scale group and by success level. I expect that the scale of the project would correlate to some extent with the population growth rate and total employment growth rate, since growing areas might be more likely to be implementing large-scale projects. I also expected successful projects to have higher growth rates than less successful projects, since areas with growing populations and
employment might be better able to take advantage of infrastructure improvements designed to forward economic development goals.
4.1 Project Performance Overview
I give an overview of project performance in terms of jobs, private investment leveraged, and businesses served. I try to answer two questions. First, did projects that received more funding result in more jobs than projects that received less funding? To determine this, I compare job outcomes of large, medium-scale, and small projects. Second, did projects with high employment impacts also have high impacts in terms of private investment leveraged and businesses served? To determine this, I compare success level with private investment and businesses served outcomes. Third, which projects were most efficient in their use of public funding? To determine this, I compare projects by scale group and by success level in terms of the public money they spent per job resulting from the project and the private investment leveraged by the project per public dollar spent.
The variation in public funds per job between high- and low-success
projects was very large: depending on project scale, it varied from a factor of 7 to a factor of 75. This fact reinforces the value of investing in high-success projects and the potential importance of identifying good predictors of high-success
projects.
Jobs, Private Investment, and Businesses Served
Although I define success in terms of job impacts for the purpose of this analysis, project success is multi-dimensional. Local officials and funding agencies do not just care about how many jobs are created or retained by a project, although this is often a primary concern. Other measures of project
success, such as the amount of private investment leveraged by a project and the number of businesses served by a project, are also important.
I present an overview of the relationship between project performance in terms of job impacts and these other measures of project performance, to give an idea of the applications of the results of the analysis. It may be that projects that created a lot of jobs did not perform well on these other indicators of project success. If so, this suggests that the results of this analysis hold only for project success in terms of jobs, and that other studies would be needed to identify factors associated with other types of project success.
Since data on the number of businesses served by projects and the amount of private investment leveraged by projects were obtained after the projects were implemented, they cannot be used to predict project success. These data represent the actual outcomes of the projects, which, in many cases, were not entirely anticipated in the planning stages.
Does more public funding translate into larger impacts for economic
development projects involving infrastructure improvements? This is perhaps the most basic question I have asked in this analysis, but it is very important. Large projects have high visibility and may be more politically appealing than small projects. However, they also demand large amounts of public funding.
Table 4.1 Range and Average Funding Levels and Impacts of Small, Medium-Scale, and Large Projects Small Medium-Scale Large
Average Public Funding $251,093 $586,585 $1,932,817
Average Job Impacts 277 657 663
Average Private Investment Leveraged $9,377,778 $34,791,800 $26,910,526
Average number of businesses served 4 5 3
Source: EDRG and author's calculations based on data from EDRG
Table 4.1 shows that high funding levels do not necessarily mean large impacts. Average funding for large projects is about 3.3 times more than for
medium-scale projects. However, the average private investment leveraged by large projects is slightly less than that leveraged by medium-scale projects, and the average number of jobs resulting from large projects is only slightly higher than the number resulting from medium-scale projects. Large projects tend to serve fewer businesses than either medium-scale or small projects.
Small projects were most efficient in their use of public funding to create and retain jobs (Table 4.2). Small projects spent about three times less public
money per job than medium-scale or large projects. This indicates that agencies with limited resources can create more jobs by investing in small projects, even though the larger projects tend to be more visible and perhaps more politically appealing. Large projects also leveraged the least private investment per dollar of public funding.
Table 4.2 Efficiency of Public Funding for Large, Medium-Scale, and Small Projects Large Medium-Scale Small
Public Dollars per Job $7,154 $8,500 $2,449
Private Investment per $14 $59 $37
Public Dollar
Source: the author's calculations based on information from EDRG
Small Projects
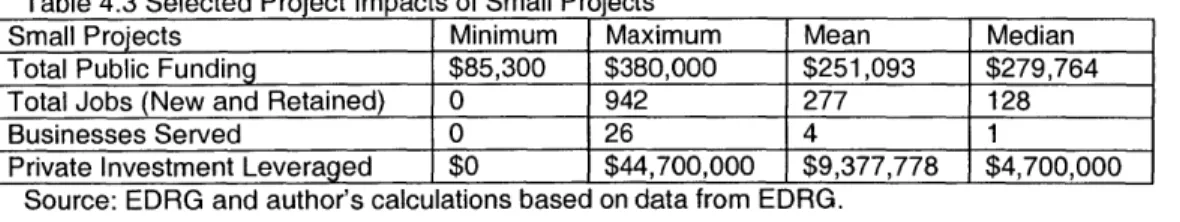
The small projects range in funding from $85,300 to $380,000 (Table 4.3)
Table 4.3 Selected Project Impacts of Small Projects
Small Projects Minimum Maximum Mean Median
Total Public Funding $85,300 $380,000 $251,093 $279,764
Total Jobs (New and Retained) 0 942 277 128
Businesses Served 0 26 4 1
Private Investment Leveraged $0 $44,700,000 $9,377,778 $4,700,000 Source: EDRG and author's calculations based on data from EDRG.
Total jobs (retained, direct, indirect, and induced) resulting from the
projects ranged from none to 26. Private investment leveraged by the projects ranged from none to $44,700,000.
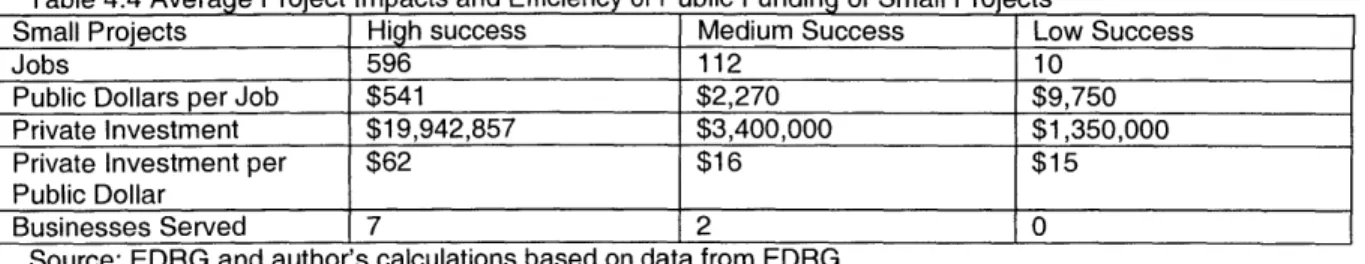
Projects with high impacts in terms of job creation and retention tended, on average, to be more efficient in terms of public funding (Table 4.4). The ratio of public funding to jobs is 4.2 times higher for projects with medium success than for projects with high success, and 18 times higher for projects with low success than for projects with high success. This is reasonable, considering that the small projects all received a similar range of funding, so that projects that created more jobs would spend fewer public dollars per job created. However, the fact that successful projects are more efficient in their use of funding
underlines the importance of trying to identify factors that can be used to predict project success.
Table 4.4 Average Project Impacts and Efficiency of Public Funding of Small Projects
Small Projects High success Medium Success Low Success
Jobs 596 112 10
Public Dollars per Job $541 $2,270 $9,750
Private Investment $19,942,857 $3,400,000 $1,350,000
Private Investment per $62 $16 $15
Public Dollar
Businesses Served 7 2 0
Source: EDRG and author's calculations based on data from EDRG
The amount of private investment leveraged, as well as the ratio of private investment leveraged to public funding, was highest for high-success projects. The average number of businesses served by high-success projects was also higher than for medium- and low-success projects. This shows that the small projects that resulted in the most jobs and the most private investment also leveraged the most private investment and job creation/retention per public dollar, and served the largest number of businesses, on average.
These results indicate that, in the case of these small projects, the number of jobs resulting from projects seems to be a good measure of project success. Projects with high employment impacts also had high private-investment impacts, served more businesses than other projects, and generated the most
employment and private investment per public dollar.
Medium-Scale Projects
The medium-scale projects range in funding from $407,300 to $973,000 (Table 4.5). Total jobs (retained, direct, indirect and induced) resulting from the projects ranges from none to 3,274, and the number of businesses served by the projects ranges from 0 to 36. Private investment leveraged by these projects ranges from none to $300,000,000.
Table 4.5 Selected Project Impacts of Medium-Scale Projects
Medium-Scale Projects Minimum Maximum Mean Median
Total Funding $407,300 $973,000 $586,585 $524,200
Total Jobs (New and Retained) 0 3,274 657 396
Businesses Served 0 36 5 3
Private Investment Leveraged $0 $300,000,000 $34,791,800 $10,000,000 Source: EDRG and author's calculations based on data from EDRG
Medium-scale projects display the same trends as small projects in terms of economic impacts and efficiency of public funding (Table 4.6). Projects with medium success levels spend 5 times more public money per job than projects with high success, and projects with low success spend 75 times more public money per job than projects with high success! The amount of private
investment leveraged, the ratio of private investment leveraged to public funding, and the number of businesses served, were all highest for high-success projects.
These results corroborate the finding for small projects that the number of jobs resulting from projects seems to be a good measure of project success.
Projects with high employment impacts had high private-investment impacts, served more businesses than other projects, and generated the most
employment and private investment per public dollar.
Table 4.6 Average Project Impacts and Efficiency of Public Funding of Medium-Scale Projects Medium-Scale Projects High Success Medium Success Low Success
Jobs 1,582 304 29
Public Dollars per Job $455 $2,289 $34,332
Private Investment $80,290,000 $19,083,333 $1,481,750
Private Investment per $106 $43 $2
Public Dollar I
Businesses Served 9 4 2
Source: EDRG and author's calculations based on data from EDRG
Large Projects
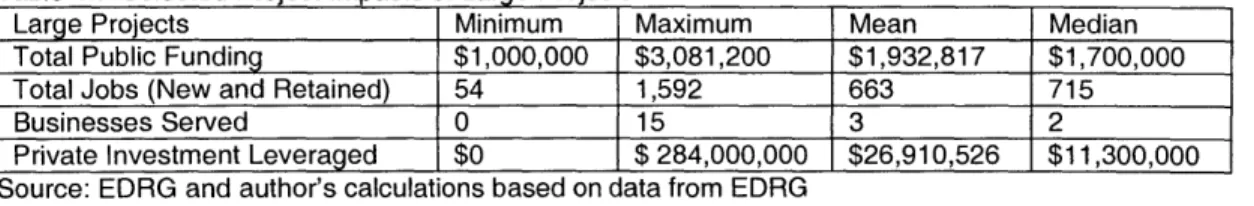
Large projects range in funding from $1 million to $3,081,000 (Table 4.7). Total jobs (retained, direct, indirect and induced) resulting from the projects
ranges from 54 to 1,592, and the number of businesses served by these projects ranges from 0 to 15. Private investment leveraged by these projects ranges from none to $284 million.
Table 4.7 Selected Project Impacts of Large Projects
Large Projects Minimum Maximum Mean Median
Total Public Funding $1,000,000 $3,081,200 $1,932,817 $1,700,000
Total Jobs (New and Retained) 54 1,592 663 715
Businesses Served 0 15 3 2
Private Investment Leveraged $0 $ 284,000,000 $26,910,526 $11,300,000 Source: EDRG and author's calculations based on data from EDRG
The large projects show slightly different trends in terms of the efficiency of public funding for the projects (Table 4.8). Like small and medium-scale
projects, high-success large projects use the least public funding per job created or retained. However, low-success projects generated more private investment,
both absolutely and per dollar of public funding, than medium- and high-success projects. This indicates that large projects may be more likely to serve large, capital-intensive businesses than medium-scale or small projects, and that private investment leveraged should not be thought of as correlated with employment impacts for large projects.
Table 4.8 Average Project Impacts and Efficiency of Public Funding of Large Projects Large Projects High Success Medium Success Low Success
Jobs 1,258 793 208
Public Dollars per Job $1,830 $2,155 $12,925
Private Investment $22,800,000 $9,250,000 $37,500,000
Private Investment per $11 $6 $20
Public Dollar
Businesses Served 4 2 4
Source: EDRG and author's calculations based on data from EDRG
4.2 Project Types
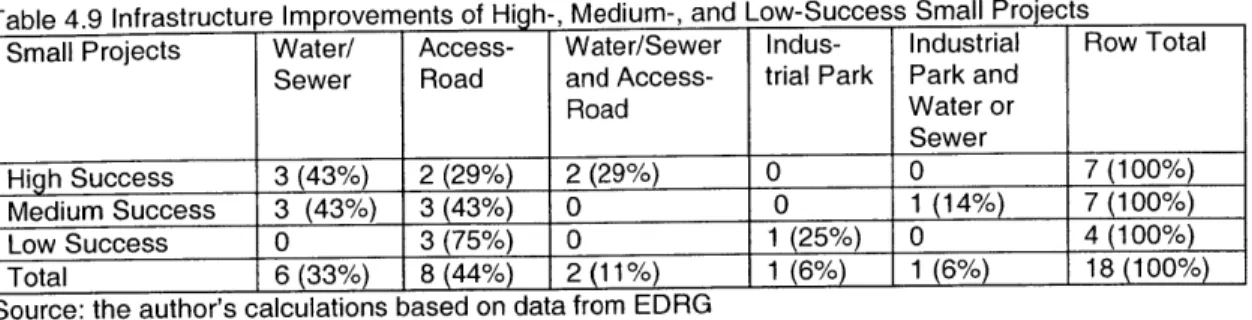
I present both aggregate and disaggregate data on the frequency of project types for small, medium-scale, and large projects, and for all projects. Most of the projects were water/sewer or access-road improvements. Overall, water/sewer projects were more frequently successful than access-road and other projects.
Small Projects
Among small projects, high-success projects included a higher percentage of exclusive water/sewer projects than of other types of infrastructure projects, while low-success projects did not include any exclusive or combined water/sewer projects (Table 4.9).