READ THESE TERMS AND CONDITIONS CAREFULLY BEFORE USING THIS WEBSITE. https://nrc-publications.canada.ca/eng/copyright
Vous avez des questions? Nous pouvons vous aider. Pour communiquer directement avec un auteur, consultez la première page de la revue dans laquelle son article a été publié afin de trouver ses coordonnées. Si vous n’arrivez pas à les repérer, communiquez avec nous à [email protected].
Questions? Contact the NRC Publications Archive team at
[email protected]. If you wish to email the authors directly, please see the first page of the publication for their contact information.
NRC Publications Archive
Archives des publications du CNRC
This publication could be one of several versions: author’s original, accepted manuscript or the publisher’s version. / La version de cette publication peut être l’une des suivantes : la version prépublication de l’auteur, la version acceptée du manuscrit ou la version de l’éditeur.
Access and use of this website and the material on it are subject to the Terms and Conditions set forth at
Multiscale Archaeological Survey Based on the Integration of 3D
Scanning and Photogrammetry
Guidi, G.; Tucci, G.; Beraldin, Jean-Angelo; Ciofi, S.; Ostuni, D.; Costantini,
F.; El-Hakim, Sabry
https://publications-cnrc.canada.ca/fra/droits
L’accès à ce site Web et l’utilisation de son contenu sont assujettis aux conditions présentées dans le site
LISEZ CES CONDITIONS ATTENTIVEMENT AVANT D’UTILISER CE SITE WEB.
NRC Publications Record / Notice d'Archives des publications de CNRC:
https://nrc-publications.canada.ca/eng/view/object/?id=73991ee9-bb86-436f-b512-70c399d17c96
https://publications-cnrc.canada.ca/fra/voir/objet/?id=73991ee9-bb86-436f-b512-70c399d17c96
National Research
Council Canada
Institute for
Information Technology
Conseil national
de recherches Canada
Institut de technologie
de l’information
Multiscale Archaeological Survey Based on the
Integration of 3D Scanning and Photogrammetry *
Guidi, G., Tucci, G., Beraldin, J.-A., Ciofi, S., Ostuni, D., Costantini, F., and
El-Hakim, S.
September 2002
* published in Proceedings of the Intern. Workshop on Scanning for Cultural Heritage
Recording - Complementing or Replacing Photogrammetry, Corfu, Greece. September
01-02, 2002. pp.58-64. NRC 44914.
Copyright 2002 by
National Research Council of Canada
Permission is granted to quote short excerpts and to reproduce figures and tables from this report, provided that the source of such material is fully acknowledged.
MULTISCALE ARCHAEOLOGICAL SURVEY BASED ON THE
INTEGRATION OF 3D SCANNING AND PHOTOGRAMMETRY
G. Guidia, *, G. Tuccib, J-A. Beraldinc, S. Ciofia, V. Damatoa, D. Ostunid, F. Costantinod and S. F. El Hakimc
a
Dept. of Electronics and Telecomm., University of Florence, Via S. Marta, 3 – 50139, Florence, Italy
b
Dept. of Scienze e Tecniche per i Processi di Insediamento, Politecnic of Turin, Castello del Valentino Viale Pier Andrea Mattioli,39 10125 Turin, Italy
c
NRC Canada, Institute for Information Technology, Bldg. M-50, Montreal Road, Ottawa, ON, K1A 0R6, Canada
d
Dept. of Civil Engineering, University of Florence, Via S. Marta, 3 – 50139, Florence, Italy Commission V, WG VI
KEY WORDS: 3D Scanning, Photogrammetry, Sensor fusion, Multiscale survey
ABSTRACT:
The survey intended as non-invasive diagnostic investigation, has reached an significant level of evolution, but in order to be effective it should own two fundamental features: rapid acquisition and completeness of data. In such way the status of a particular site can be reliably identified, indicating possible pathologies or complex situations, allowing to predict their evolution in time. In our case study both aspects had to be respected because the site is inside a religious place, so that all the measurement sessions had to be constrained into a well defined time frame, and the diagnostics is simultaneously influenced by an area of soft ground influencing the global planarity of the whole roof, and a set of local alterations in the mosaic structure, due to the consequential tension.
* Corresponding author. E-mail: [email protected] 1. INTRODUCTION
Surveying Cultural Heritage involves measurement at different possible scale. Wide range measurements as those based on Topography or Photogrammetry can be suitable for large buildings while for complex surfaces or small objects 3D scanning techniques seems more appropriate. In most cases the simultaneous presence of different scales in the same survey makes useful a possible integration of different levels of detail. In an archaeological site where objects with complex surfaces, as a piece of mosaic work, have to be accurately measured, it is also necessary to measure the structure containing them, where it is important to know other information, as the alignment between walls, or the planarity of the floor, not needing the same level of detail.
The same aspect emerges in 3D modeling of sculptures, that has been explored for application in monitoring, digital moulding, multimedia fruition or even rapid prototyping. Also in this case, it might be necessary to include the 3D model of a statue in a virtual environment as a room or a reproduction of the original environment, not needing the high resolution required for the sculpture.
In all these applications a multiscale survey, where the information density is correlated with the importance or formal complexity of the artwork to be measured, seems to be the ideal solution.
In order to obtain such result a possible approach is represented by the fusion of different sensors, as range cameras, based on both Triangulation or Time of Flight (TOF) principle, Photogrammetry and Topography, each of them capable to satisfy complementary survey needs (El-Hakim et al., 1998).
The study shown in this paper describes the application of the aforementioned approach for the study of an archaeological area located in the underground of Santa Maria del Fiore Baptistery (Florence), containing an ancient mosaic of the roman period, in bad conservation conditions.
2. TECHNICAL BACKGROUND
Nowadays many instruments for 3D optical scanning are available, based on optical triangulation or on time-of-flight (TOF). Recent technologies for digital tridimensional acquisition have opened innovative applications for the conservation, reproduction, study and fruition of sculptural, architectural and archeological artworks (Abouaf, 1999; Beraldin et al., 1997; Beraldin et al., 1998; Beraldin et al., 2000; Bernardini et al., 2002; Guidi et al., 2001; Levoy et al., 2000). 2.1 Triangulation based 3D scanning
The most diffused systems for creating a digitized 3D image of an object within a limited range (within some meters) are based on optical triangulation. A Laser, by means of a rotating mirror, forms a light stripe scanning the object, and a camera collects the image of the illuminated area. The range information is retrieved on the basis of the system geometry. An alternative technique is based on the projection of patterns of structured light (Sansoni et al., 1994), i.e. a light pattern coded as spots or stripes. Both techniques generate a cloud of points that, after suitable processing, allow to generate a tridimensional model of the object. The systems based on optical triangulation are the most accurate, allowing measurement uncertainty lower than one tenth of millimeter. Such uncertainty, however, depends
directly on the square of the distance between the camera and the object. A high precision is therefore achieved by suitably limiting this distance, and thus the illuminated area. The acquisition of relatively large objects, as a statue of human size, requires a large number (typically hundreds) of partial views (or range maps), taken all around the object, that have to be integrated through a complex alignment procedure in order to represent the whole surface. Using portable equipment, employed to scan Heritage artworks kept in museums, such range images are taken from unknown locations, and the coordinate system of each point cloud is referred to the range camera. In order to refer all the acquisitions to the same coordinate system, adjacent range maps are acquired with partial superimposition (at least 30%), and rototranslated by means of special software algorithms that minimize the mean square deviation or find a best match between overlapping points of adjacent maps (Besl, McKay, 1992; Chen, Medioni, 1992).
2.2 TOF based 3D scanning
Another class of 3D acquisition systems - often indicated in the photogrammetry world with the term “laser scanner” - is based on the simultaneous measurement of the time of flight of light pulses sent towards the object, giving the distance between the scanner and the measured surface, and the vertical and horizontal angles. The kind of output is similar to that attainable with a triangulation scanner.
The main advantage is that long-range imaging is possible, thus allowing large structures to be imaged. However, the achievable accuracy is relatively low, never better than a few millimeters, but commonly resulting in the centimeter range. Also in this case a procedure of partial views alignment is required.
2.3 Digital Photogrammetry
Photogrammetry is a well consolidated technique, that has a long history of developments for over a century. Digital photogrammetry is the product of an intensive research conducted for the last 20 years for the automation of information extraction from digital images, based on image analysis methods.
Photogrammetry is based on the acquisition of multiple images of the object to be measured, taken from point of views sufficiently apart by a photo camera. The method requires the selection of recognizable elements on the acquired images, including reference targets of a known size. Once the selection of homologous points has been performed, the 2D coordinates on the photogram plane are processed using an algorithm of bundle adjustment that allows the corresponding 3D coordinates to be estimated. Photogrammetry results generally suitable to large scale measurements. Close-range photogrammetry cannot be used for camera-object distance lower than 1-2 meters. The process of the identification of the points to be measured, being manual or semi-automatic, requires a long a tedious work if the number of points is elevated.
The available technology is largely used in the metric survey of architectures and archaeological sites (El-Hakim et al., 1996). A unique feature of photogrammetric techniques is its extremely high accuracy, that ranges from 100 ppm to 10 ppm of the overall dimension of the imaged area.
3. CASE STUDY: BAPTISTERY OF FLORENCE The object of our study was a Romanic mosaic and part of the surrounding area, located in the underground of the Baptistery of Florence, at the north-west corner.
The measurement conditions in such environment are particularly difficult: the bad conservation state after the early dislocation to a museum of the most valuable pieces (1912-15, 1925) and the difficult access don’t make easy the monument understanding.
Surveys based on overall measurements and inaccurate photography’s compositions have been made up to 1990, but due to the complexity of the archaeological site such kind of measurements and are prone to artificial regularizations, giving possible fake results. The first systematic studies over these structures were started in 1990 and published later (Marino et al., 1996).
The mixing of mosaic portions with wall structures of different ages makes difficult the historical interpretation of the artifact. In this case the differences in the pavement construction techniques, such as stones shape and cutting methods or mortar characteristics and thickness, are the only elements for an appropriate reading of the monument.
In the examined room a portion of a wall adjacent to the mosaic is semicircular and is sheltered by the foundation walls of the apse. All the room walls are made with three different layers: the lower one has a regular structure, the intermediate – less homogeneous – shows slid connections, while the upper one is mainly made by conglomerate.
On the roof lie a mosaic fragment representing geometrical drawings and made by small black and white tesserae, of the roman period.
4. METHODS AND INSTRUMENTATIONS A well established praxis in studying an artifact like the one previously described is to make topographic surveys integrated with photographs and 2-D drawings (generally 1:10 scale) showing elevations. For the smaller details a contact relief on polyvinyl is generally used, where each mosaic tesserae or the overall mosaic drawing are taken. In this way important mosaic details are acquired. From these raw data some papers are worked out, such as thematic maps of the materials employed, of the gaps, of restorations, of the conservation state, etc. A tridimensional relief is often acquired through molds made in silicon or glass-reinforced plastic in order to accurately evaluate the presence of roof depressions.
The introduction of advanced 3D measurement technologies seemed therefore very advantageous for eliminating all the manual steps typically employed for this kind of survey. 4.1 Topographic survey
11 points have been identified on the mosaic surface, and marked with reflecting targets. Their topographic coordinates have been measured with a steel band for planimetry, and with geometric leveling performed with a digital level meter Leica NA3003 and invar stadia bar for the points height.
4.2 Digital photogrammetry
Photogrammetry in this application act as the “global reference” supplying a single coordinate system for repositioning piece of data coming from other sensors. Such global reference is then reoriented to the absolute reference defined by older surveys. In order to have a good level of redundancy for measurements control, it was decided to make photogrammetry with two different kind of equipment.
4.2.2 Semimetric camera: A semimetric camera Rollei 6006 (6x6) was employed with a calibrated lens with 40 mm focal lenght. Each photogram, characterized by an average scale of 1:40, was then acquired with a calibrated Mirage scanner capable of 1400 DPI.
The final photogrammetric model was then generated with the Stereoview software supplied by Nikon. The relative orientation gave σ=2µm, while the global accuracy, checked with the topographic target coordinates, was around 1mm.
4.2.3 Off-the-shelf camera: Photogrammetry was also performed with an off-the-shelf camera coupled with a software for post processing the acquired images.
The camera used is a Nikon coolpix 5000, equipped with a 2/3" CCD organized in 2560x1920 pixel (5.2 MPixel), and a zoom lens that was kept fixed, during the photogrammetry shots, at its shorter focal length (7.1 mm), equivalent to a 28 mm wide-angle lens in a 35mm reflex camera. The camera has also the capability of saving images in uncompressed tiff format. This is an important feature when the image is employed for measurement purpose, because in this way any processing over the image can be avoided.
The photogrammetry program is a commercial package (Shape Capture - Shape Quest Inc., Ontario, Canada) that allows calculating camera calibration with simple steps.
After calibration, a set of convergent digital pictures of the object taken from different angles can be registered by first selecting homologous points over them, and then launching a bundle adjustment procedure (El-Hakim et al., 1996).
Once the images are registered, the 3D coordinates of specific points can be easily generated and saved in a text file.
4.4 TOF based Scanner
The smaller scale 3D acquisition was performed with a TOF scanner LMS-Z420 (produced by Riegel, Austria), giving a measurement uncertainty of ±8 mm.
4.5 Triangulation based Scanner
At larger scale a range camera “Opto3D Ranger” was employed (produced by Optonet, Italy). It is a triangulation system based on projection of light patterns over the investigated surface. The main components of the system are a LCD projector for pattern projection, a C-mount CCD camera, a few camera lenses, a variable baseline support, and a calibration fixture. Depending on the type of surface imaged, the field of view and accuracy of the 3D camera are reconfigured. This process allows the operator to adapt the modeling process to different situations found in modeling of artworks.
The 3D coordinates evaluation in this system is based on the simultaneous use of Gray codes projection, for generating an approximate estimation of the surface, and of phase shift of the finest pattern for a refinement of each 3D point estimation, according to a method described in the literature.
As any other active optical sensor based on triangulation, the measurement uncertainty depends directly on the projector-camera distance (baseline) and inversely on the projector- camera-field-of-view-distance (standoff).
Since the displacement between the 3D points measured by the scanner and their true coordinates follows a gaussian distribution, it is common to statistically quantify the measurement uncertainty through the standard deviation (σx, σy
and σz) of such displacements respect to the three reference
axes.
This evaluation is performed at the calibration stage, usually before starting a measurement session, by measuring the position in space of a known target located in known positions. It is also made in the following stages, for example at the end of a measurement session, or at the beginning of a session where a previous calibration setup is employed, by acquiring a verification object with a highly planar surface, and evaluating the deviation of the point cloud from the corresponding best fitting plane.
In the Results section, the opto-geometrical setup chosen for the scanner gave a field of view of 290x210 mm on the focal plane, with an extent of 160 mm in depth, and a standard deviation along z (σz) equal to 73µm.
5. EXPERIMENTAL RESULTS
The topographic survey has included some known points, measured in previous surveys, performed since 1909 by the Istituto Geografico Militare (IGM), and afterwards (1972-73; 1994) by the group of Prof. Fondelli at the University of Florence for measurements over the cathedral dome. Such coordinate system has been taken as an absolute reference for the work described in this paper, and all the following measurements have been re-oriented according to it.
Although the topographic survey gives the better possible accuracy over some specific points, for the mean part of the examined structure we chose to use photogrammetry due to logistic reasons (the place located underground is accessible only by a small aperture in the baptistery floor and the light is very little), and for the need of filling the gaps between accurate points well apart each other.
Finally photogrammetry was used to quickly generate a reference system for 3D acquisitions.
The procedure for integrating range maps originated by 3D scanning and digital photogrammetry is based on specifically designed targeting plates, capable to be properly identified with both measurement techniques, to be placed in the scene. The main role of these plates was to be easily recognizable with both 3D scanning and photogrammetry, so they had to exhibit specific 3D and optical properties. For this reason we designed them in order to have:
• high contrast for making easier the target selection with the photogrammetry software;
• high planarity, so that during the post processing of range maps its surface could be approximated with a fitting plane instead of employing the raw data set, typically affected by errors in the high contrast areas of the image;
• high number of targets for making more robust the rototranslation procedure. The minimum number of points to univocally calculate a rototranslation of the range-map are of course three, but in this way the possible errors affecting the rototranslation matrix would be directly influenced by the uncertainty of each point measured in both the source and destination reference system. By properly choosing and increasing the number of points to be employed for calculating the rototranslation, the uncorrelated errors tend to cancel each other, leaving only systematic errors, that can be minimized thanks to calibration;
• a known distance between targets, in order to give us the possibility to check the accuracy and deviation of the target position measured with both systems, in any stage of the processing.
The measurements set-up is shown in figure 1a, were the targets located over the mosaic are shown, in positions appropriate to get tridimensionality from the digital pictures of the scene, and in order to cover as much as possible of the framed area. In figure 1b the groups of coordinates generated through the bundle adjustment of 4 digital images similar to figure 1a, and including the targeting plates A, B ,C and D in a single coordinate system, are shown.
a)
b)
Figure 1. Digital photogrammetry of the mosaic: a) one of the 4 digital pictures taken on site for photogrammetry. A dashed rectangle highlights one of the surfaces also acquired with a structured light range camera; b) results of photogrammetry. These plates were also acquired with both 3D scanning systems, keeping in the framed area both the targets and portions of interest of the mosaic that can be acquired in this way at high resolution. The dashed rectangle in figure 1a highlight one of the areas taken at high resolution with the Optonet range camera.
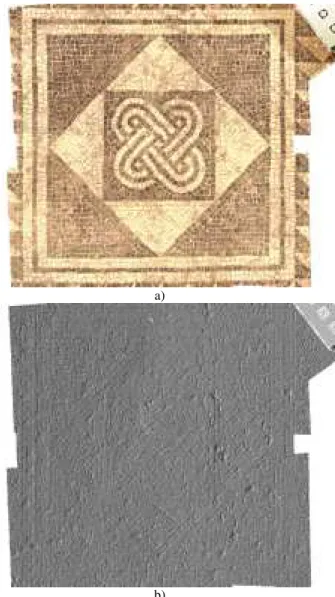
In figure 2 a couple of hi-resolution models generated with the pattern projection system are shown. It is interesting to notice how texture (figure 2a) and geometry artificially shaded (which is equivalent to raking light) (figure 2b), may give a different level of interpretation of the same data. For example in figure 2b it is much easier to identify the lacking tesserae of the mosaic.
By identifying each barycenter of the optical targets in the 3D images, groups of 3D coordinates corresponding to the different targets, generated by the two sensors, can be obtained. Figure 1b shows for example a the set of targets generated by photogrammetry. From these measurements transformation matrices have been calculated employing the well-known unit quaternion method (Horn, 1987). Each matrix allows for the roto-translation (pose) of the 3D images from the local coordinate system of the range camera to an accurate global coordinate system determined by the digital photogrammetric procedure.
The TOF 3D scanned was useful for generating a dense cloud of points representing the underground wall and a structure located
in the middle of the mosaic (see fig. 1a) whose meaning is still unknown.
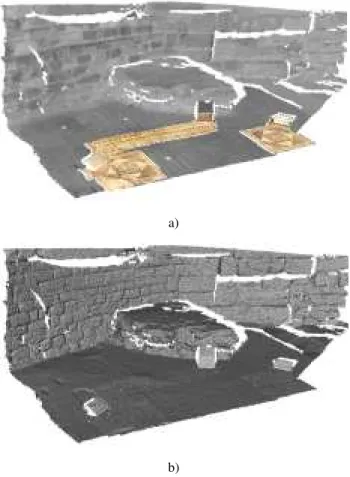
In figure 3a the final “multiscale” model is presented, where the hi-res 3D models and the TOF acquisition are both reoriented to the photogrammetry coordinate system through the method described.
a)
b)
Figure 2. 3D acquisition of the mosaic section near to target C: a)model with texture; b) model without texture and synthetic
a)
b)
Figure 3. Multiscale model integrating the data coming from the different sensors: a) with texture; b) with synthetic shading.
6. CONCLUSIONS
Different 3D measurement techniques are currently available each one with peculiar characteristic in terms of accuracy, density of the measurement or acquisition time. On the other hand in the archaeological field we can find a lot of different structures, that are more suitable to be measured with a technique rather than another one. Although this is not completely an original idea, the approach that we tried to set up is a technique for mixing different technologies, with specific targets and rototranslations based on the quaternions method, in order to exploit the characteristics of each technology in the most suitable way according to the manufact to be surveyed. The final “multiscale” 3D model seems to demonstrates a possible way for handling the resulting survey.
7. ACKNOWLEDGEMENTS
The author wish to express their thanks for the availability of Simone Orlandini, by Nikon Italia, that actually performed the 3D scan with the Rigel equipment.
8. REFERENCES
Abouaf J., 1999. Florentine Pieta: can visualization solve the 450-year-old mystery? IEEE Computer Graphics and Applications, 19(1), pp. 6-10.
Addison A. C., 2000. Emerging trends in virtual heritage. IEEE Multimedia, 7(2), pp. 22-25.
Beraldin J.-A., Blais F., Boulanger P., Cournoyer L., Domey J., El-Hakim S.F., Godin G., Rioux M., Taylor J., 2000. Real world modelling through high resolution digital 3D imaging of objects and structures, ISPRS Journal of Photogrammetry and Remote Sensing, 55(4), pp. 230-250.
Beraldin J.-A., Blais F., Cournoyer L., Rioux M., Bernier F., Harrison N. , 1998. Portable digital 3-D imaging system for remote sites, Proceedings of the IEEE International Symposium on Circuits and Systems, 5, pp. V-488-V-493.
Beraldin J.-A., Cournoyer L., Rioux M., Blais F., El-Hakim S.F., Godin G. , 1997. Object model creation from multiple range images: Acquisition, calibration, model building and verification. Proceedings of the International Conference on Recent Advances in 3-D Digital Imaging and Modeling, pp. 326-333.
Bernardini F., Rushmeier H., Martin I.M., Mittleman J., Taubin G., 2002. Building a digital model of Michelangelo's Florentine Pieta, IEEE Computer Graphics and Applications , 22(1) pp. 59-67.
Berndt E., Teixeira J.C., 2000. Cultural heritage in the mature era of computer graphics. IEEE Computer Graphics and Applications, 20(1), pp. 36-37.
Besl, P., McKay, N., 1992 A Method for Registration of 3-D Shapes, IEEE Trans. on Pattern Analysis and Machine Intelligence, 14(2), pp. 239-256.
Chen, Y., Medioni, G., 1992. Object modeling by registration of multiple range images, Image and Vision Computing, 10(3), pp. 145-155.
Cignoni P., Montani C., Puppo E., Scopigno R., 1997. Multiresolution representation and visualization of volume data, IEEE Transactions on Visualization and Computer Graphics, 3(4), pp. 352-369
Cignoni P., Puppo E., Scopigno R., 1997. Representation and visualization of terrain surfaces at variable resolution, Visual Computer, 13(5), pp. 199-217.
El-Hakim S.-F., Beraldin J.-A., Godin G., Boulanger P., 1996. Two 3-D Sensors for Environment Modeling and Virtual Reality: Calibration and Multi-view registration, International Archives of Photogrammetry and Remote Sensing, 31(B5), pp. 140-146.
El-Hakim S. F., Brenner C., Roth G., 1998. A multi-sensor approach to creating accurate virtual environments, ISPRS Journal of Photogrammetry & Remote Sensing, 53, pp. 379– 391S.
Guidi G., Ostuni D., Costantino F., Pieraccini M., Tucci G., Beraldin J.-A., 2001. Photogrammetry and 3D scanning: assessment of metric accuracy for the digital model of Donatello's Maddalena. Italy-Canada Workshop on 3D Digital Imaging and Modeling Applications of: Heritage, Industry, Medicine & Land, Padua. (on CD ROM)
Guidi G., Pieraccini M., Ciofi S., Atzeni C., Beraldin J-A., Lazzari S., 2001. Immagini Digitali Tridimensionali Di Beni Artistici. Alta Frequenza, 13(2), pp. 30-36.
Guidi G., Pieraccini M., Ciofi S., Damato V., Beraldin J.-A., Atzeni C., 2001. Tridimensional digitizing of Donatello's Maddalena, Proceedings of the IEEE International Conference on Image Processing, 1, pp. 578-581.
Guidi G., Morelli A., Nenci C., Santella C., Tucci G., 2002. Indagini diagnostiche applicate ai pavimenti musivi: tecniche di
rilievo, analisi per campioni e indagini geofisiche, Proceedings of the XVIII Convegno Scienza e Beni Culturali, I mosaici. Cultura Tecnologia Conservazione, Bressanone.
Haralick R.M., Shapiro L.G. , 1992. Computer and robot vision, Addison-Wesley, Reading, Mass.
Horn B.K.P., 1987. Closed-form solution of absolute orientation using unit quaternions, J. Opt. Soc. Am. A, Vol. 4, n. 4, p. 629-642
Kanaya I., Chen Q., Kanemoto Y., Chihara K. , 2000. Three-dimensional modeling for virtual relic restoration, IEEE Multimedia, 7(2), pp. 42-44.
Levoy, M., Rusinkiewicz S., Ginzton M., Ginsberg J., Pulli K., Koller D., Anderson S., Shade J., Curless B., Pereira L., Davis J., Fulk D., 2000. The digital Michelangelo project: 3D scanning of large statues, Proceedings of the ACM SIGGRAPH Conference on Computer Graphics, pp. 131-144.
Marino L., Dinelli O., Guerra M., Nenci C., Orlando F., 1996. L’ipogeo del Battistero di Firenze, in S.M. del Fiore. Rilievi, documenti, indagini strumentali. Interpretazioni. Piazza Battistero. Campanile., edited by Rocchi Coopmans de Yoldi, G., Il Torchio, Firenze, 1996.
Rioux M., Beraldin J.-A., Blais F., Godin G., Cournoyer L., 1997, High Resolution Digital 3-D Imaging of Large Structures, Three-Dimensional Image Capture, SPIE Proceedings, 3023, pp. 109-118.
Rushmeier H. et al., 1998. Acquiring Input for Rendering at Appropriate Level of Detail: Digitizing a Pietà, Proc.9th Eurographics Workshop on Rendering, pp. 81-92
Sansoni G., Biancardi L., Minoni U., Docchio F., 1994. A novel adaptive system for 3D optical profilometry using a liquid crystal projector, IEEE Transactions Instrumentation and Measurement 43 (4), pp. 558-466
Zheng J., Zhong L., 1999. Virtual Recovery of Excavated Relics, IEEE Computer Graphics and Applications , 19(3), pp. 6-11.