HAL Id: hal-00853822
https://hal.archives-ouvertes.fr/hal-00853822
Submitted on 23 Aug 2013
HAL is a multi-disciplinary open access
archive for the deposit and dissemination of
sci-entific research documents, whether they are
pub-lished or not. The documents may come from
teaching and research institutions in France or
abroad, or from public or private research centers.
L’archive ouverte pluridisciplinaire HAL, est
destinée au dépôt et à la diffusion de documents
scientifiques de niveau recherche, publiés ou non,
émanant des établissements d’enseignement et de
recherche français ou étrangers, des laboratoires
publics ou privés.
Critical Temperature Range in Standard and Ni-bearing
Spheroidal Graphite Cast Irons
Roxana Maria Ghergu, Jon Sertucha, Yannick Thebault, Jacques Lacaze
To cite this version:
Roxana Maria Ghergu, Jon Sertucha, Yannick Thebault, Jacques Lacaze. Critical Temperature Range
in Standard and Ni-bearing Spheroidal Graphite Cast Irons. ISIJ international, Iron & Steel Institute
of Japan, 2012, vol. 52, pp. 2036-2041. �10.2355/isijinternational.52.2036�. �hal-00853822�
Any correspondence concerning this service should be sent to the repository administrator:
staff-oatao@inp-toulouse.fr
DOI: 10.2355/isijinternational.52.2036
Official URL:
http://dx.doi.org/10.2355/isijinternational.52.2036
This is an author-deposited version published in:
http://oatao.univ-toulouse.fr/
Eprints ID: 9057
To cite this version:
Ghergu, Roxana Maria and Sertucha, Jon and Thebault, Yannick and Lacaze,
Jacques Critical Temperature Range in Standard and Ni-bearing Spheroidal
Graphite Cast Irons. (2012) ISIJ International , vol. 52 (n° 11). pp. 2036-2041.
ISSN 0915-1559
O
pen
A
rchive
T
oulouse
A
rchive
O
uverte (
OATAO
)
OATAO is an open access repository that collects the work of Toulouse researchers and
makes it freely available over the web where possible.
Critical Temperature Range in Standard and Ni-bearing Spheroidal
Graphite Cast Irons
Roxana Maria GHERGU,1) Jon SERTUCHA,2) Yannick THEBAULT1) and Jacques LACAZE1)*
1) CIRIMAT, Université de Toulouse, BP 44362, 31030 Toulouse cedex 4, France.
2) Ingeniería y Procesos de Fundición, IK4-AZTERLAN, Aliendalde auzunea 6, E-48200 Durango (Bizkaia), Spain.
Describing the conditions for reaustenitization of spheroidal graphite cast irons is of interest for their heat-treatment after casting, e.g. for manufacturing austempered ductile irons. Differential thermal analy-sis has been used to characterize the direct eutectoid transformation and the reverse transformation, i.e. the reaustenitization. This has been applied to a standard and a Ni-bearing alloy, with a ferritic matrix for the former, both a ferritic and a pearlitic matrix for the latter. The results are discussed in relation with the stable and metastable three phase fields. While earlier description of the direct eutectoid transformation is confirmed, the one for reverse eutectoid has been found more complex and is amended.
KEY WORDS: nodular cast irons; eutectoid transformation; austenitization; ferrite; pearlite.
1. Introduction
To control solid-state heat-treatment of cast irons, a precise knowledge of the effect of alloying elements on the stable graphite) and metastable (austenite-ferrite-cementite) three-phase fields is required. The corresponding temperature ranges have to be considered for describing the eutectoid transformation of austenite upon cooling as well as for controlling full or partial reaustenitization that may be called reverse eutectoid transformation. Recent interest has been focused on this latter for manufacturing austempered ductile irons (ADI) parts as stressed by a number of works dealing with kinetics of austenitization1,2) and its physical modelling.3,4) A clear understanding of the conditions for nucleation and growth of the new phases is necessary for mod-elling of direct and reverse eutectoid transformations.
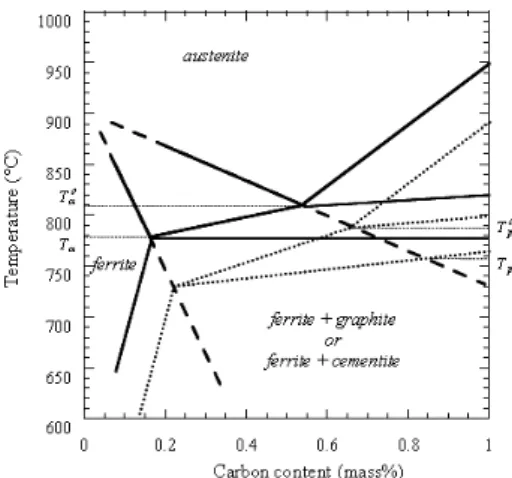
In a previous work, the conditions for ferrite and pearlite growth upon cooling from the austenite field have been described on the basis of results obtained by differential thermal analysis (DTA).5,6) Assuming their growth does not involve long range diffusion of substitutional solutes (e.g. Si, Cu, Cr, Mn, etc.)7,8) as must be the case for finite cooling rates, the characteristic temperatures for transformation could be evaluated on a Fe C isopleth section of the phase diagram drawn for the appropriate composition of the cast iron in substitutional solutes. Such a section for a Fe C Si alloy with 2.5 mass% Si is shown in Fig. 1,7) with the upper and lower temperatures of the three-phase field denoted and Tα for the stable system, and Tp for the metastable system. If ferrite precipitates as halos around graphite nod-ules and pearlite grows with no connection with graphite phase, it was thus found that growth of ferrite and pearlite
could proceed only when the lower temperature of the respective three-phase field has been reached. This approach has been applied successfully to explain that Cu and Mn favour pearlite because they both decrease the driving force for carbon diffusion in ferrite and decrease more Tα than Tp.9,10)
Using the same hypothesis, this approach was extended to the reverse eutectoid transformation.11) Upon heating, trans-formation of ferrite to austenite forming halos around the graphite phase should start at the upper limit of the stable three phase field ( ) while decomposition of pearlite could proceed as soon as the lower limit of the metastable three-phase field (Tp) is reached as it is not related to the graphite phase. Predictions for both direct and reverse eutectoid transformations were confronted against an extensive review of literature data.7) The agreement was good for finite scanning rates, though some features should be stressed:
* Corresponding author: E-mail: jacques.lacaze@ensiacet.fr DOI: http://dx.doi.org/10.2355/isijinternational.52.2036
Tα 0 Tp
0
Fig. 1. Isopleth section of the stable (solid line) and metastable (dotted lines) Fe C Si phase diagrams.7)
Tα 0
• for very low scanning rates, in practice lower than 2 K/ min, long range diffusion of substitutional solutes can take place in which case the stable transformation may start within the three-phase field. This would apply when partial reaustenitization is looked for as is the case for manufacturing so-called dual phase ADI.12,13)
• Upon cooling, the results showed that ferrite growth can start at very low undercooling with respect to Tα while pearlite needs some finite undercooling relative to Tp to appear.14) For modelling the eutectoid transfor-mation, it has been accepted that ferrite appears at the interface between austenite and graphite15,16) giving
rise to the bull-eye structure. In some cases however, intergranular ferrite may precipitate upon cooling before bull-eye ferrite after reaustenitization.9)
Similar-ly, austenite has been observed to appear at the ferrite/ graphite interface for high heating rates17) and at both
the ferrite/graphite interface and grain boundaries upon reverse eutectoid transformation.17,18)
• For finite cooling rates, microsegregation issued from solidification was considered to affect only the last stage of the eutectoid transformation though the pres-ence of even low levels of some alloying elements such as Cr, Mn and Cu could favour pearlite instead of fer-rite.19) This effect has been related to chemical
hetero-geneities built-up during solidification and seems to more dramatically affect reaustenitization and subse-quent solid-phase transformations18,20,21) as compared
to the direct eutectoid transformation during cooling after casting.
Since very few precise data were in fact available for checking the reaustenitization process against the former assumptions,7) it seemed appropriate to test these latter. For
this, an experimental investigation in which both ferritic and pearlitic matrix were processed has been performed. For such an attempt, it was decided to compare the transforma-tion of a Ni-bearing cast iron that is prone to give a pearlitic matrix to a standard alloy. Both alloys were first studied after a ferritization treatment and the Ni-bearing one was also studied after a pearlitizing thermal cycle. DTA was used for controlling the heating and cooling of the samples.
2. Experimental Details
The alloys investigated have been prepared for previous studies and all details on melt preparation and casting con-ditions have already been given.22) The content in the main
alloying elements for the standard and the Ni-bearing grades are given in Table 1. The isopleth Fe C sections for the Fe C Si and Fe C Si Ni alloys under investigation would be very similar to that shown in Fig. 1, with only slight changes in the characteristic temperatures. In this table are also listed the characteristic temperatures (°C) estimated according to the following formulas where wi (mass%) is the alloying
content of element i : 7)
... (1)
... (2)
... (3)
.... (4) These formulas have been calculated using a thermody-namic software and associated databases as previously described.7) They are thus valid for the low carbon content
that prevails at the eutectoid reaction, and account should be made of the presence of graphite that leads to redistribution of all alloying elements but carbon in the matrix. Accord-ingly, the wi values entered in the formulas for evaluating
the characteristic temperatures of an alloy are 1.05 times those listed in Table 1.7)
DTA experiments were performed with a SETARAM SETSYS apparatus, with alumina powder as reference mate-rial and samples machined out from the cast irons with a diameter of 3.9 mm and a height of 5 mm. The DTA cell is regularly checked against transformation temperature of pure elements, namely melting of aluminium, silver, iron and nickel. The accuracy on the temperatures reported here is estimated to be ± 2°C.
As received, the standard alloy showed an as-cast ferrito-pearlitic matrix and it was guessed that pearlite should start to decompose to ferrite and graphite upon heating at a tem-perature far below the metastable three-phase field. It was thus considered more significant to study only the transfor-mation of ferrite upon heating of this alloy. DTA samples were thus subjected to a subcritical anneal which consisted in heating at a rate of 10 K/min to 720°C, holding for 60 min and then cooling to 400°C at 2 K/min. The first sample was then cooled to room temperature (RT) and it was checked that all pearlite had decomposed. The subsequent samples were maintained for 1 min at 400°C after the subcritical anneal and then heated to 950°C, held 5 minutes and then cooled to RT. The heating and cooling rates used were 2, 5, 10, 15 and 20 K/min.
In the as-received condition, the Ni-bearing material had been ferritized by means of a subcritical anneal.22) A first set
of DTA experiments was thus conducted to investigate the effect of heating rate on the transformation of ferrite to auste-nite with upper temperature set at 1 050°C. Upon cooling, the effect of the scanning rate on the transformation of austenite to a ferrito-pearlitic matrix was investigated. Finally, for studying the effect of the heating rate on the transformation of pearlite to austenite, the samples were first heated to 1 050°C, then cooled at the highest possible rate (about 60 K/min in the eutectoid range) to maximize the amount of pearlite, and final-ly reheated to 1 050°C and cooled to RT for the same range of scanning rates as above. Figure 2 shows the nearly fully pearl-itic matrix obtained after rapid cooling from 1 050°C.
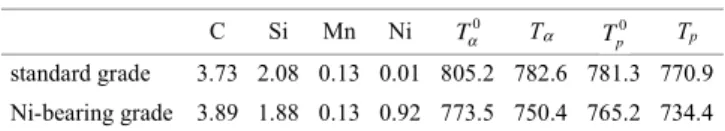
Table 1. Composition of the alloys (mass%).
C Si Mn Ni Tα Tp standard grade 3.73 2.08 0.13 0.01 805.2 782.6 781.3 770.9 Ni-bearing grade 3.89 1.88 0.13 0.92 773.5 750.4 765.2 734.4 Tα 0 Tp 0 T w w w w w w o Si Cu Mn Mo Cr Ni α = + − − + − − 739 31 5 7 7 18 7 3 3 10 7 26 0 . . . . . . T w w w w w w Si Si Cu Mn Mo Cr α = + + − − + − − 739 18 4 2 0 14 0 45 0 2 0 24 0 27 2 . . ( ) . . . . ..5wNi T w w w w w w p o Si Si Cu Mn Mo Cr = + − − − + + 727 30 07 1 98 10 7 13 7 9 3 24 3 2 . . ( ) . . . . −−12 0. wNi T w w w w w w p Si Si Cu Mn Mo Cr = + + − − + + − 727 21 6 0 023 21 0 25 0 8 0 13 0 2 . . ( ) . . . . 333 0. wNi
3. Results
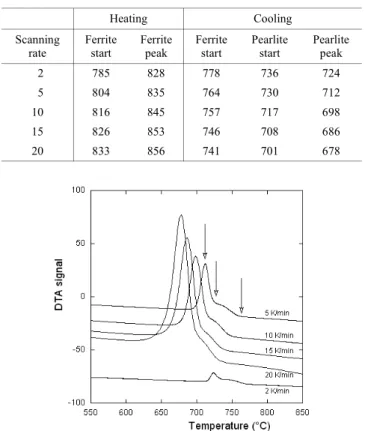
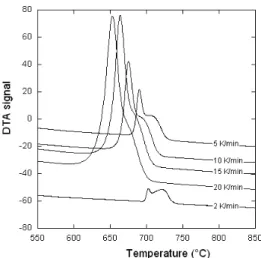
Figure 3 shows the five DTA records obtained upon
heat-ing the ferritized standard alloy up to 950°C at different rates (solid lines) plus the record corresponding to the as-received alloy with a 5 K/min heating rate (dotted line). Note that, in this figure and the following, the records have been shifted along the ordinate direction for clarity. Com-paring the two records at the heating rate of 5 K/min, it is seen that the as-received material shows three peaks while the ferritized one shows only two peaks. It is thus easy to associate the peak at intermediate temperature with pearlite decomposition, while the peak at lower temperature relates to the magnetic transformation of ferrite and that at higher temperature to the transformation of ferrite to austenite. It could be noticed however that a small bump is still apparent at intermediate temperatures on all DTA records with the ferritized samples, indicating that a small amount of pearlite was anyway present.
The temperature for the beginning of austenite formation and the peak temperature of the thermal arrest related to ferrite decomposition were recorded as indicated by the open arrows in Fig. 3. While the latter is easily evaluated, the former is sub-ject to a higher uncertainty. The obtained values for ferrite transformation start and ferrite peak are listed in Table 2.
The DTA records obtained on cooling the samples of the standard alloy are shown in Fig. 4. On each of these records,
two thermal arrests are clearly distinguished that relate to the appearance of ferrite for the high temperature and the formation of pearlite for the low temperature. As expected, the relative amplitude of the former with respect to the latter decreases as the cooling rate is increased. As indicated with the open arrows in Fig. 4, the characteristic temperatures that could be evaluated, namely the start of ferrite precipi-tation, the start of pearlite precipitation and the peak tem-perature associated to pearlite, are listed in Table 2. As men-tioned before, the start of the transformations is evaluated with a higher uncertainty than the peak temperature.
The set of characteristic temperatures have been plotted in
Fig. 5 as function of the square root of the scanning rate during
the DTA run. Looking first at the transformation temperature from austenite to ferrite upon cooling, it is seen that the data extrapolates to Tα with the value for the lowest cooling rate slightly above the regression line as expected. The two series of data for pearlite formation upon cooling, namely the start and peak temperatures, may be extrapolated to nearly the same temperature i.e. 20°C below Tp. That pearlite needs such an underccoling to appear is in agreement with previous works.6,9,14) Summing up, the results obtained upon cooling the standard alloy agree with those expected according to the pro-posed model for the eutectoid transformation.11)
On the contrary, the data for ferrite transformation to aus-tenite upon heating are at definite difference with respect to those expected. The temperature associated with the start of ferrite decomposition may be extrapolated to a temperature close to Tα at zero scanning rate. This means that the trans-formation proceeds within the three phase field and thus that austenite does not form halos around the graphite nodules as
Fig. 2. Micrograph of the Ni-bearing alloy with nearly fully pearl-itic matrix obtained after rapid cooling from 1 050°C.
Fig. 3. DTA records upon heating the standard material in the fer-ritized state (solid lines) and in the as-received condition (dotted line).
Table 2. Characteristic transformation temperatures (°C) evaluated on the DTA records of the ferritized standard cast iron for various scanning rates (°C/min).
Heating Cooling Scanning rate Ferrite start Ferrite peak Ferrite start Pearlite start Pearlite peak 2 785 828 778 736 724 5 804 835 764 730 712 10 816 845 757 717 698 15 826 853 746 708 686 20 833 856 741 701 678
Fig. 4. DTA records upon cooling the standard material from 950°C.
postulated in earlier work.11) Instead, the transformation
must proceed by the growth of austenite along grain bound-aries as reported by several authors17,18,23) and is controlled
by carbon diffusion along these grain boundaries.
Figure 6 presents the DTA records on heating to 1 050°C
of the as-received ferritized Ni-bearing material. These records show two main peaks, the Curie peak at low tem-perature and the peak associated with the ferrite to austenite transformation at higher temperatures. On all records, a shoulder peak at even higher temperature could be observed indicating that the transformation of ferrite to austenite is much longer for this alloy than for the standard one. The temperature for the start of ferrite decomposition and the peak temperature (open arrows in Fig. 6) have been consid-ered as characteristic temperatures and are listed in Table 3.
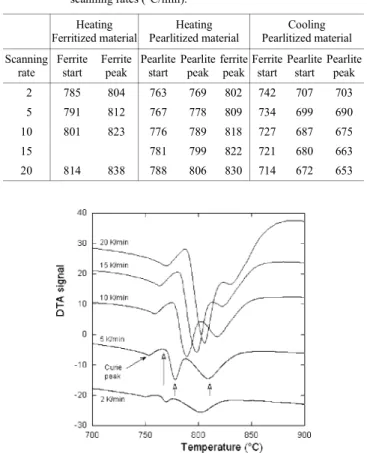
Figure 7 shows the DTA records upon heating after the
Ni-bearing material had been heated up to 1 050°C and rap-idly cooled to RT to get a nearly fully pearlitic matrix. The records all show three peaks, as for the dotted curve in Fig. 3, which can be allocated to the Curie transformation, pearl-ite decomposition and ferrpearl-ite transformation at increasing temperature. It is seen that the height of the peak associated with ferrite increases with respect to that of pearlite as the scanning rate is decreased. This shows that, though
stabi-lized by nickel, some of the pearlite transforms to ferrite and graphite during heating before it decomposes to austenite when the temperature is high enough. The characteristic temperatures considered here are the start and peak temper-atures for pearlite transformation and the peak temperature for ferrite transformation to austenite as it is shown with the open arrows in Fig. 7. Note that there are no shoulders on the high temperature side of the ferrite peak appearing, this will be discussed further below.
Finally, Fig. 8 shows the set of DTA records that were obtained from the Ni-bearing alloy upon cooling during the second series of experiments. As the initial conditions before cooling were the same in the first series of experi-ments, i.e. a short holding after heating to 1 050°C, the records obtained upon cooling during the first and second series were similar. The characteristic temperatures consid-ered in Fig. 8 are the same as for Fig. 4, i.e. the start of fer-rite precipitation, the start of pearlite precipitation and the peak temperature associated to pearlite, they are listed in Table 3.
The characteristic temperatures obtained from Figs. 6, 7 and 8 have been plotted in Fig. 9. Starting again with the transformation upon cooling, it is seen that the start of ferrite growth corresponds well to Tα. Similarly, the two character-istic temperatures for formation of pearlite upon cooling may be extrapolated to a single temperature that is about 10°C below Tp. These results agree with predictions11) as was already the case for the standard alloy.
Concerning the transformation from ferrite to austenite upon heating, it is seen that the temperature for the start of
Fig. 5. Evolution of the characteristic temperatures of the DTA records obtained for the standard material as function of the square root of the scanning rate. Solid symbols are for the ferritic reaction, open symbols for the pearlitic one.
Fig. 6. DTA records upon heating the Ni-bearing material in the ferritized state.
Table 3. Characteristic transformation temperatures (°C) evaluated on the DTA records of the Ni-bearing cast iron for various scanning rates (°C/min).
Heating Ferritized material Heating Pearlitized material Cooling Pearlitized material Scanning rate Ferrite start Ferrite peak Pearlite start Pearlite peak ferrite peak Ferrite start Pearlite start Pearlite peak 2 785 804 763 769 802 742 707 703 5 791 812 767 778 809 734 699 690 10 801 823 776 789 818 727 687 675 15 781 799 822 721 680 663 20 814 838 788 806 830 714 672 653
Fig. 7. DTA records upon heating the Ni-bearing material in the pearlitized state.
this reaction in an initially fully ferritic matrix may well be extrapolated to as expected from the model. This should mean that for this alloy the transformation proceeds, at least for a part, by the formation and growth of austenite halos around graphite nodules, and this is contrary to the result on the standard alloy presented above. This is further discussed in the next section.
Decomposition of pearlite during heating shows start and peak characteristic temperatures that may well be extrapo-lated to the same temperature that appears to be significantly higher than Tp and in fact quite close to Tα. This suggests that decomposition of pearlite to austenite upon heating pro-ceeds provided the material temperature is above Tα, i.e. with the condition that austenite may be stable at that temperature. Thus, the description that have been proposed previously11) must be modified: decomposition of pearlite to austenite will start at Tp if this temperature is higher than Tα, it will start at Tα in the opposite case as for this Ni-bearing alloy.
4. Discussion
In Fig. 9 it is noticed that the peak temperature for ferrite transformation is about the same whatever the initial matrix,
ferritic or pearlitic. This suggests that this peak relates to the same part of the material at the microstructure scale, and hence that the ferrite associated to the shoulder detected in alloys with an initially ferritic matrix (see Fig. 6) gives rise to the pearlite that first transforms after pearlitization. For a more precise understanding of the origin of the shoulders, samples of the ferritized Ni-bearing alloy have been heat-treated by introducing them in a furnace at either 800°C or 825°C for 5 and 15 minutes, and then quenched into brine. Typical micrographs of each sample are shown in Fig. 10 where it is seen that austenite (appearing as martensite after quenching) forms at the graphite/ferrite interface but also at cell boundaries away from the graphite nodules (Figs. 10(a) and 10(b)). Growth of austenite then proceeds by thickening of the austenite shell around the graphite nodules and of the austenite formed at cell boundaries (Fig. 10(c)) and finishes in the regions in between nodules and cell boundaries (Fig. 10(d)) which are then associated to the shoulders.
Using a sample of the Ni-bearing alloy that had been
Fig. 8. DTA records upon cooling the Ni-bearing material from 1 050°C.
Fig. 9. Evolution of the characteristic temperatures of the DTA records obtained for the Ni-bearing material as function of the square root of the scanning rate. Solid symbols are for the ferritic reactions, open symbols for the pearlitic one. Solid diamonds are for the material with initially a pearlitic matrix.
Tα 0
Fig. 10. Optical micrograph after etching with 2% Nital of Ni-bearing samples held 5 minutes (a dnd c) and 15 minutes (b and d) at 800°C (a and b) and 5 and 15 minutes at 825°C (c and d).
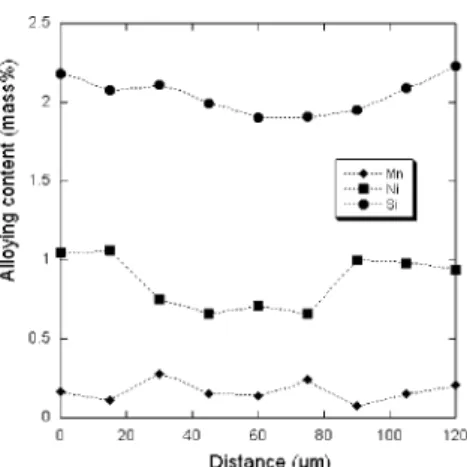
pearlitized, a few line-scans between two neighbouring graphite nodules were recorded using an energy dispersive X-ray spectrometry (EDS) system on a scanning electron microscope (SEM). One of these line-scans is shown in Fig.
11 where it is seen that Si and Ni contents decrease as
expected from the graphite/matrix interface to the inter-nodule areas, from 2.2 mass% to 1.9 mass% for Si and from 1.05 mass% to 0.6 mass% for Ni. Because of the low Mn content, this element appears more erratic when an increase would have been expected, thus it will be considered as con-stant at 0.14 mass% in the following. The Si profile in the standard alloy could be similarly considered to change from 2.0 mass% to 1.7 mass% while the Mn was again taken as constant at 0.14 mass%.
Using the compositions mentioned above, the Tα temper-ature could be estimated by means of Eq. (2) for locations close to the graphite nodules and at cell boundaries. The val-ues obtained are listed in Table 4. It appears clearly that the difference in the reaustenitizing process between the two alloys may be directly related to the change in Tα value from the graphite/ferrite interface to cell boundaries: this change is negative for the standard alloy while it is positive for the Ni-bearing alloy. Thus, for the standard alloy, transforma-tion of ferrite to austenite could start at lower temperature in the cell boundaries provided carbon can diffuse from the graphite nodules to these areas. As mentioned above, sever-al authors have observed this for the intermediate heating rates investigated in the present work. In the case of the Ni-bearing alloy, the decomposition of ferrite to austenite is not favoured at cell boundaries (see Table 4) and the transfor-mation should preferentially start with the fortransfor-mation of aus-tenite halos around nodules when the material temperature has reached . The microstructures in Fig. 10 show that both transformation processes do in fact compete for this alloy. This discussion shows the importance of microsegre-gation in the reaustenitization process.
5. Conclusion
The DTA results obtained in the present study upon cool-ing from the austenite + graphite field are in full agreement with previous reports and confirm the model proposed for the eutectoid transformation. On the other hand, the DTA results upon heating the materials and the few micrograph observations performed show that the previously developed model for reverse eutectoid transformation had to be chal-lenged with new experiments. The following conclusions could be drawn for reaustenitization of a ferritic matrix:
•in standard cast irons with very low levels of alloying additions, segregation of Si is such that the predicted ferrite to austenite transformation temperature is lower at cell boundaries than at the nodule/ferrite interfaces. Thus, austenite appears at cell boundaries and grows by carbon diffusion along grain boundaries at a tempera-ture lower than the temperature of the alloy. The ref-erence temperature for ferrite decomposition is then Tα. •Negative segregation of Ni leads to a predicted trans-formation temperature for ferrite lower at the graphite/ ferrite interface than at cell boundaries, so that austenite halos may form around the nodules before ferrite starts transforming at cell boundaries. In that case, the refer-ence temperature for ferrite decomposition is . In the case of a pearlitic matrix, decomposition of pearlite to austenite needs this latter to be stable which is possible if the Tα temperature of the alloy is lower than its Tp tem-perature. In such a case, the reference temperature for the start of pearlite decomposition is Tp while it will be Tα in the opposite case. The previous model for pearlite decompo-sition upon heating may be made more precise by stating that the temperature at which it starts is the highest of Tα and Tp.
REFERENCES
1) R. C. Thomson, J. S. James and D. C. Putman: MST, 16 (2000), 1412. 2) R. Ivanova, W. Sha and S. Malinov: ISIJ Int., 44 (2004), 886. 3) W. Kapturkiewicz, E. Fras and A. A. Burbelko: MSE A, 413 414
(2005), 352.
4) Uma Batra, S. Ray and S. R. Prabhakar: JMEPEG, 14 (2005), 574. 5) J. Lacaze, S. Ford, C. Wilson and E. Dubu: Scand. J. Metall., 22
(1993), 300.
6) J. Lacaze, C. Wilson and C. Bak: Scand. J. Metall., 23 (1994), 151. 7) V. Gerval and J. Lacaze: ISIJ Int., 40 (2000), 386.
8) S. N. Lekakh and V. L. Richards: AFS Trans., 118 (2010), 225. 9) J. Lacaze, A. Boudot, V. Gerval, D. Oquab and H. Santos: Metall.
Mater. Trans. A, 28A (1997), 2015.
10) J. Sertucha, P. Larrañaga, J. Lacaze and M. Insausti: Int. J.
Metal-casting, 4 (2010), 51.
11) E. Linares, V. Gerval and J. Lacaze: Scr. Mater., 38 (1998), 279. 12) A. Basso, R. Martinez and J. Sikora: Key Eng. Mater., 457 (2011), 145. 13) A. P. Druschitz, R. E. Aristizabal, E. Druschitz, C. R. Hubbard, T. R. Watkins, L. Walker and M. Ostrander: Metall. Mater. Trans. A, 43A (2012), 1468.
14) J. Lacaze: Int. J. Cast Metals Res., 11 (1999), 431.
15) M. Wessén and I. Svensson: Metall. Mater. Trans. A, 27A (1996), 2209.
16) J. Lacaze and V. Gerval: ISIJ Int., 38 (1998), 714.
17) N. Wade and Y. Ueda: Trans. Iron Steel Inst. Jpn., 20 (1980), 857. 18) J. M. Chou, M. H. Hon and J. L. Lee: Scr. Metall. Mater., 27 (1992),
61.
19) J. Lacaze: Proc. of Erstarrung Metallischer Schmelzen in Forschung and Giessereipraxis, ed. by A. Ludwig, Wiley-VCH, Weinheim, (1999), 25.
20) J. Sikora and R. Boeri: Int. J. Cast Metals Res., 11 (1999), 395. 21) J. M. Schissler and J. Saverna: J. Heat Treating, 4 (1985), 167. 22) J. Lacaze, P. Larrañaga, I. Asenjo, R. Suárez and J. Sertucha: MST,
28 (2012), 603.
23) J. E. Rehder: AFS Trans., 73 (1965), 473.
Fig. 11. Example of composition profile in between two nodules in the Ni-bearing alloy.
Table 4. Estimates of the Tα temperature at locations close to the
graphite nodules and at cell boundaries.
Standard alloy Ni-bearing alloy Nodule/ferrite interface 774.9 754.0 Intercellular areas 769.8 758.8 Tα 0 Tα 0 Tα 0