The Challenge of Smooth Transition from R&D to Business
for Innovation in a Telecom company
by
YUKARI TSUJI
M.E. Sciences and Engineering, Tsukuba
(1989)
University
SUBMITTED TO THE MIT SLOAN SCHOOL OF MANAGEMENT
IN PARTIAL FULFILLMENT OF THE REQUIREMENTS
FOR THE DEGREE OF
MASTER OF BUSINESS ADMINISTRATION at the
MASSACHUSETTS INSTITUTE OF TECHNOLOGY June 2005
© 2005 Yukari Tsuji. All rights reserved.
The author hereby grants to MIT permission to reproduce and to distribute publicly paper and electronic copies of this thesis document in whole or in part.
Signature of Author
MIT Sloan 8chool of Management
May 6, 2005 Certified by:
Henry B. Weil Sloan Management Review Professor of Management
Thesis Advisor
Accepted by:
I
I --Director, MIT Sloan Fellows Program
MASSACHUSETTS INS E
OF TECHNOLOGY
Stephen J. Sacca in Innovation and Global Leadership
/1
,2 ..~,
!
The Challenge of Smooth Transition from R&D to Business
for Innovation in a Telecom company
by
YUKARI TSUJI
Submitted to the MIT Sloan School of Management
on May 6, 2005 in partial fulfillment of the requirements for the Degree of Master of Business Administration
ABSTRACT
The environment surrounding telecom companies has changed dramatically since most were privatized in the 1980s. Under the influence of regulations, they had faced globalization and have repeatedly divided and consolidated to improve competitiveness.
From the technology and marketing points of view, two disruptive innovations
occurred in the 1990s: IP and wireless communications. Originally, IP was used only
for data communications, but it has now evolved to include voice communications as VolP. This had a huge impact on telecom companies because IP has destroyed the legacy cost structure that was based on a pay-as-you-go system; the new demand is for a flat rate fee structure. IP also moved forward the commoditization of communication network services. At the same time, demand for cellphone service grew exponentially, and the number of cellphone subscribers surpassed that of fixed
phone in 2000 in Japan. As a result, competitive superiority is shifting from
long-distance companies to local and wireless companies.
In this thesis, I discuss the telecom industry's situation, and compare three major carriers: AT&T, BT and NTT. I describe the organizational structures of each company to determine where there are-or if there is a requirement to improve-smooth transitions from R&D to business as one way to enhance the telecom companies' competitiveness.
My research found that their strategies regarding the acquisition of competence are totally different: AT&T did internal development; BT purchased necessary technologies from the market; NTT led joint development with manufacturers. From the comparison and analysis, I determined that the R&D structure should be changed from the legacy linear model to a circular model that produced fast clock speed. In addition, companies must have relationships with external companies and universities in order to purchase products or technologies
quickly and efficiently. Managing NTT Group effectively is another key issue to be
executed.
If NTT can turn these changes into an opportunity, the company can transform itself into an IP communication services company that is able to use its huge
technical resources to give themselves a marketing advantage.
TABLE OF CONTENTS
Page
... 6
Introduction Chapter 1 Telecom industry 1.1 Background ... 9
1.1.1 Current conditions in the Japanese economy ... 9
1.1.2 Japan's Information and Communication Industry ... 11
1.2 Privatization and Globalization ... 12
1.2.1 The U.S. Situation ... ... ... .. 12
1.2.2 The UK Situation ... ....14
1.2.3 The EU Situation ... 14
1.2.4 Privatization of the Japanese Telecom Industry ... 15
1.3 Analysis of market Dynamics ... ... 16
1.3.1 Trends in telecom industry ... 16
(1) Trend #1: Broadband ... 16
(2) Trend #2: IP networks ... ... 23
(3) Trend #3: Mobile communications ... 24
1.3.2 Effect of regulations ... 28
1.3.3 Evaluating current technologies ... 29
Chapter 2 Chapter 3 An Overview of NTT ... 30 2.1 NTT 's current situation ... 30 2.2 History ... 33 2.3 Current strategies ... 35
2.3.1 IP on Optical Fiber Networks . ... 35
2.3.2 RENA (Resonant Communication Network Architecture) 36 2.4 Organization ... 38
2.5 Competitors in the Japanese market ... 40... 40
An Overview of AT& and BT ... ... ... 43
3.1 AT&T ... 43
3.1.1 History ... 43
3.1.2 Reorganization ... ... 45
3.1.3 Competitors in the U.S. Market ... ...46
3.1.4 Current Situation ... ... 47
3.1.5 Current Strategies ... .... 48
3.2 British Telecom ... 49
3.2.1 History ... 49
3.2.2 Organization ... 50
3.2.3 Competitors and Partners ... 52
3.2.4 Current Situation ... 53
3.2.5 Current Strategies ... 55
(1) Bluephone Project . ... 55
(2) Replacing PSTN with IP networks ... 56
Chapter 4 Comparing Three Telecommunications Companies ... 59
4.1 Current financial situation ... 59
Table of Contents (continued) 4.2 R&D 4.2.1 4.2.2 4.2.3 4.3 Strategies Page ... 61 Changing Circumstances ... 61
Transition from Research to Markets: BT, NTT ... 62
VolP's Influence to R&D and the Telecom Market ... 64
... 66
Chapter 5 Growth Factors and Scenarios for the Future ... 69
5.1 Factors Effecting the Growth of Telecom Companies ... 69
5.1.1 Changes in Technologies ... ... 69
(1) VolP & Consumer Broadband ... ... 69
(2) Fixed and Mobile Convergence (FMC) ... 70
5.1.2 Changes in the Market ... ... ... 71
(1) Open Source ... 71
(2) Proactive Commoditization ... 71
5.1.3 Changes in Company and Industry Structure ... 72
5.2 Scenarios for the Future ... 73
Chapter 6 R&D Objectives and Models for Transition to Business 6.1 R&D Objectives ... 79
6.1.1 Market Dynamics ... 79
6.1.2 Competitive Strategies and R&D Objectives ... 80
6.2 Models for Transitioning from R&D to Business ... 81
6.2.1 Types of Transition Models ... 81
6.2.2 Characteristics of Transition Models ... ... 82
(1) Lineor Model ... 82 (2) Flow M odel ... 82 (3) Iterative Model ... 82 (4) Circular Model . ... ... 83 (5) Intermediary Model ... 84 6.2.3 Segmentation Factors ... ... ... ..84 (1) IBM ... 85 (2) SO N Y ... 85 (3) D E LL ... ... 85 (4) Siemens ... 86 (5) BMW ... 8...6... (6) IDEO ... 87 ...87...
6.2.4 Assessment of Possible Transition Model ... 89
Future Strategies ... 93
7.1 Possible strategy ... 93
7.2 Organization and processes . ... 94
7.2.1 Strengthening Flexibility of R&D's Role and Structure ... 94
7.2.2 Collaboration with External Partners ... 96... 96
7.2.3 Effective Partnerships in NTT Group ... 99
7.3 R&D Contribution to the Company's Strategy ... 99
Chapter 8 Conclusion
ACKNOWLEDGEMENTS
As I worked on this thesis project, my company, professors, and friends at MIT all helped me gain broader perspectives while giving me opportunities to
enhance my talents. There are many individuals to whom I would like to extend my
sincere thanks and appreciation:
Professor Henry B. Weil for his remarkable direction of my thesis and his able
assistance throughout my research activities.
Mr. Hiromii Wasai, Senior Executive Vice President of NTT Communications Inc., for
giving me this great opportunity to study at MIT Sloan.
Mr. Mitsunobu Komori, Mr. Yuji Uenishi and Mr. Masato Inaba, Senior Manager of
NTT Inc., for giving me many opportunities and kind encouragement.
Dr. Hiroshi Miyabe, Associate Senior Vice President and Exective Director of NTT
Cyber Communication Laboratory Group, Mr. Yoshitsugu Obashi, Director of NTT Service Integration Labolatories, Mr. Kazuhiro Nagayama, Senior Manager of NTT Service Integration Laboratories, Mr. Masatoshi Shimizu, Senior Manager of NTT Access Network Service Systems Laboratories, for giving me many opportunities
and strong support during my attendance at the MIT Sloan Fellows Program.
Mr. Steve Whittaker, Principal Consultant, BT Strategic Research Centre, and Mr.
Howard Anderson, founder and former president of The Yankee Group, and
co-founder of YankeeTek Ventures, for their thoughtful suggestions and helpful
coordination with my interviews.
Mr. Hirohiko Sato, Exective manager of NTT Soft Inc., for his thoughtful suggestions
for the contents of my thesis and kind encouragements.
Ms. Cherie Potts, for her excellent editing.
Mr. Stephen J. Sacca, for his great coordination and work on behalf of MIT Sloan
Fellows Program in Innovation and Global Leadership.
Introduction
For a number of years, telecom companies have functioned well as a result of their own self-contained development, that is, they supplied services through vertical integration, and developed technologies and products internally or in conjunction with other manufacturers. However, everything changed as the Web and cellular phones penetrated all facets of life. As a result, many external suppliers, such as router venders, service providers, and cellular companies, surged to the forefront in the telecom industry. This resulted in the shortening of service lifecycles and a greater dependency on the capabilities of others, i.e., horizontal relationships. Traditionally, the key features of the telecom industry were engineering and operations, but today these hold a less important position, replaced instead by marketing and creating new services. Today, network services have changed from cutting-edge to commodities. Under such conditions, telecom companies are questioning the importance of R&D.
NTT Group, a holding company consisting of five main subsidiaries, takes partial responsibility for R&D expenses in laboratories belonging to the holding company and the other small group companies. In NTT Group, fundamental
research and technologies used in the subsidiary companies are developed in
holding company, On the other hand, development of an application field used by a subsidiary company or customized requests for specific customers, are executed in
and economic climate, which requires quick development and production, the existing R&D structure simply cannot cope sufficiently. And in the transition from R&D to market, a lack of communication often occurs between the technology and marketing people.
The objective of this thesis is to analyze the organizational structures of telecom companies to determine where there are-or if there is a requirement to improve-the smooth transitions from R&D to business as one way to enhance the telecom companies' competitiveness. I seek to answer following questions:
· What are the key factors for successfully transitioning from R&D to business? · How can we change an organization to incorporate these factors? There are
three perspectives to be considered in organizational change: (a) strategic design: transition standards designed to guide a diverse R&D team that uses external relationships for strategic design; (b) political: identifying the right R&D field and assigning (if necessary, hiring) the right leader to bring about political
change; and (c) cultural: producing a change in the corporate culture by
transforming the thinking of executives and employees.
I begin by reviewing the history of world telecom companies, then I identify comparisons between AT&T and BT, both of which were broken up or privatized
similar to NTT. Then I analyze the transition from R&D to business as it is practiced at NTT.
The thesis has seven chapters. In Chapter 1, I analyze the present state of telecom industry, followed in Chapter 2 by a description of NTT's current situation. In Chapter 3, I describe the history and strategies of AT&T and BT. In Chapter 4, I
failure. In Chapter 5, 1 explain several factors effecting the growth of telecom companies and scenarios for the future. In Chapter 6, I mention about R&D objectives and then transition models from R&D to business to realize the objectives. In Chapter 7, 1 analyze NTT's possible strategy using a familiarity matrix'. In
Chapter 8, I conclude with my assessment of the keys needed to accomplish a
smooth transition from R&D to business for NTT.
Endnotes for Introduction
Edward B. Roberts, Charles A. Berry, "Entering New Businesses: Selecting Strategies for Success", Sloan Management Review/Spring 1985
Chapter One
Telecom Industry
1.1 BACKGROUND
Over the years since it was invented, telecommunication has greatly
improved its function and performance until now it is a fundamental part of the
infrastructure in every major society. Before analyzing the strategies of several telecom companies, I conducted a survey of economical situation, political issues such as privatization and globalization, marketing trend and technological trend.
1.1.1 Current Conditions in the Japanese economy
Following the collapse of the so-called "bubble economy" in the 1990s, the Japanese economy has remained sluggish. In 2004, the International Institute for
Management Development (IMD) issued a world competitiveness scoreboard1 which
ranked Japan at 2 3rd, slightly improved from its rank of 2 5 th a year earlier. Several
Asian countries, such as Singapore and Taiwan, were ranked better than Japan. The scorecard is a comprehensive ranking based on factors such as economic performance, government efficiency, business efficiency, and infrastructure. Until
1993, Japan had been at the top five years in a row, but it dropped in succeeding
In 2004, the competitive landscape changed as economic recovery took hold in Asia and new competitors emerged. Productivity began to spread via globalization into low-cost areas of the world. For example, the manufacturing industry in east Asia, especially China, has experienced major growth and its markets have expanded into Japan. Japan's manufacturing base also has extended abroad. The next paradigm shift will directly affect the service industry.
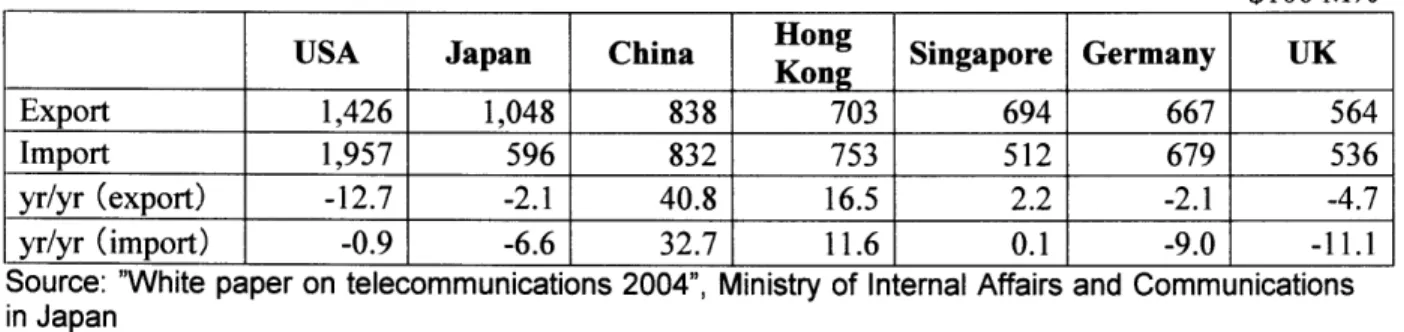
The excellent condition of Asian countries can also be seen in the IT-related trade values shown in Table 1-1. While the all-around trade values of the U.S., several European countries, and Japan have declined, China and Hong Kong reflect extremely high growth rates, well ahead of Germany and the UK. This explains why there is still room for growth in the economies of these countries.
Table 1-1 IT-related trade values in major countries
$100 M%
USA Japan China Hong Singapore Germany UK
Kog
Export 1,426 1,048 838 703 694 667 564
Import 1,957 596 832 753 512 679 536
yr/yr (export) -12.7 -2.1 40.8 16.5 2.2 -2.1 -4.7
yr/yr (import) -0.9 -6.6 32.7 11.6 0.1 -9.0 -11.1
Source: "White paper on telecommunications 2004", Ministry of Internal Affairs and Communications
in Japan
On the other hand, the IMD's technological indicator shows Japan is second only to the U.S. on the basis of technology-related markers such as the number of patents granted. Japan has received a tougher evaluation because there are still few signs of improvement in the overall macro economy. However, a persistent willingness to continue technical development-one of the signs of long-term
economic rebirth-is viewed as cause to expect future improvements in competitiveness.
The results of a questionnaire about the superiority of information technologies, targeting both domestic and international information and communications technical experts, which was handled by Ministry of Internal Affairs and Communications (MIAC) in Japan, showed that Japan has the advantage in the field of mobile terminals, home information appliances, and electronic tags and sensors.2 In contrast, it is weak in the areas of security, certification, and content
applications. As for the technologies used in optical and mobile networks, MIAC believes the US and Japan are at a similar level, and that information and communication technologies will be leading forces in the improving trend.
1.1.2 Japan's Information and Communication Industry
In 2002, the market size of Japan's information and communication industry (including telecom) was ¥116 trillion-a year-by-year decrease of 2.7%, and the first declining year since 1995. The reason was deemed to be reduced investment in equipment. (The communication industry's capital investment in 2002 was 2.72 trillion, a decrease of 15.6.) As shown in Figure 1-1, the market size of the
170 160 150 140 130 120 110 100 an 1995 1996 1997 1998 1999 2000 2001 2002 Year 1995 1996 1997 1998 1999 2000 2001 2002 Japan (Billion) 79,224 88,722 97,502 103,849 106,630 115,013 119,327 116,070 USA($10 million) 118,635 129,364 142,287 158,717 175,475 191,209 191,792 190,782
Note: Indexed on the basis of size in 1995 as 100
Source: "Analysis of IT-related economy," Ministry of Internal Affairs and Communications in Japan Fig. 1-1 Transition of information and communication industry's market size
1.2 PRIVATIZATION AND GLOBALIZATION
Historically, industries such as electricity, gas, and railways have been allowed to operate as monopolies in order to maintain stability of service and/or supply. However, this required enormous investment in equipment and the provision of service. Telecom companies around the world also enjoyed some form of monopoly until the 1970s, but by the end of the twentieth century the situation had changed dramatically.
1.2.1 The U.S. Situation
regional holding companies and their operating company subsidiaries (known as "Baby Bells"). The new AT&T was comprised of long distance (including international) and manufacturing divisions.
As dramatic as the breakup of AT&T was, it is useful to remember that entry
into long-distance (trunk) carriage by MCI and Sprint, and entry into equipment
manufacturing by Nortel, Ericsson, and others had been allowed prior to divestiture. The new AT&T had both carrier and manufacturing arms and maintained the strong international presence of its predecessor. Later, the manufacturing functions were spun off into Lucent Technologies.
From the start, the Baby Bells sought to expand beyond their local-service orientation by entering the long-distance business and, in several cases, cable television or video delivery. Several have invested in operating companies abroad, and all have sought international roles. As the result of mergers, at the time of this writing there are five remaining Baby Bells, each with a number of international
holdings but no significant long-distance or international traffic.
On a worldwide scale, market openings and competition have progressed, and the industry has evolved into private company initiatives. Political measures have provoked global competition beyond the borders of International/domestic, fixed/mobile, or voice/data/internet/CATV. This enormous surge was caused by the reaction of EU in response to Internet policies implemented by the Clinton administration, which had a major influence on the privatization of communications and pan-European network policy.
1.2.2 The UK Situation
British Telecom (BT) was privatized during the Thatcher administration in 1984, and a duopoly structure began with Mercury (currently called Cable and Wireless). In 1991, British communications policy was reviewed with an eye to abandoning the duopoly structure and to refrain from splitting BT. To accelerate competition in the telecom industry, the UK government gave cable companies permission to handle telecom business as well.
1.2.3 The EU Situation
The privatization of telecom companies in other European countries continued throughout the last half of the 1990s, including Deutch Telecom in 1995,
France Telecom in 1996, and Telecom Italia in 1998. All pressed ahead with huge
capital investment into their networks and M&As to enhance globalization. As of 1998, three large groups had been formed across borders: Concert (BT/MCI), Global One (DT/FT/Sprint), and World Partners (AT&T/Unisource and many other European and Asian telecom companies).
There were two major purposes for these strategic alliances. One was that international traffic had increased 15% every year over the past decade, and such alliances hoped to take advantage of continuous growth.
Another purpose for strategic alliances was that deregulation was deemed to cause a lack of capital for investing in building infrastructure in developing countries and for deepening the range of services available in developed countries. Companies considering such alliances believe that a globalized team would help
both sides solve their respective problems. In other words, globalization was seen as an answer for increasing the quantitative output of telecom companies.
In 1999, World Partners announced it would not extend its plan; Concert (the
alliance between BT and MCI) was also eliminated. About the same time, AT&T and BT began an international joint venture-the new Concert-in 2000 to supply backbone networks, voice and data communications for multinational companies, international communications careers, and Internet providers as a world largest communication company. However, in 2001, Concert was eliminated due to slumping business. In addition, BT paid expensive fees for licenses for third-generation cellular services. However, demand for communications did not increase as much as anticipated, and soon the entire telecom industry was in trouble.
1.2.4 Privatization of the Japanese Telecom Industry
In 1985, Japan began to reform its telecommunications industry. In April of that year, competition was introduced by privatizing NTT and allowing new common carriers (NCCs) to operate domestic long-distance and international telephony. NCCs were also allowed to operate regional mobile telephones and satellites.
From 1985 to 1991, NTT and the NCCs have maintained competing prices in
the long-distance market. The Ministry of Post and Telecommunications (MPT) believed that NTT's monopoly power, particularly the bottleneck in access services, was slowing development in the Japanese telecommunications industry. It was thought that splitting NTT would introduce more competition and the industry would grow more quickly.
In 1996, MPT and NTT agreed on a restructuring plan, and in 1999 NTT was divided into NTT Communications (long-distance operations), and NTT East and
NTT West (local service operations).3 NTT East and NTT West remain heavily regulated by MPT, while NTT Communications has been allowed to enter the international telecommunications market. KDD, a major supplier of international services in Japan, was allowed to supply domestic telecommunications services.
Thus the telecom industry was changed as follows:
(1) Monopoly in the 1970s,
(2) Deregulation and new entry in 1980s; and
(3) Roll again of existing companies and further new entries in the 1990s.
In the future, consolidation may again occur with peripheral industries such as broadcasting. I will look at this scenario in Chapter Four.
1.3 ANALYSIS OF MARKET DYNAMICS
1.3.1 Trends in the Telecom Industry
Current trends in today's telecom industry include broadband, IP, and wireless communication. In the following sections, I discuss the current situations of each trend.
(1) Trend #1: Broadband
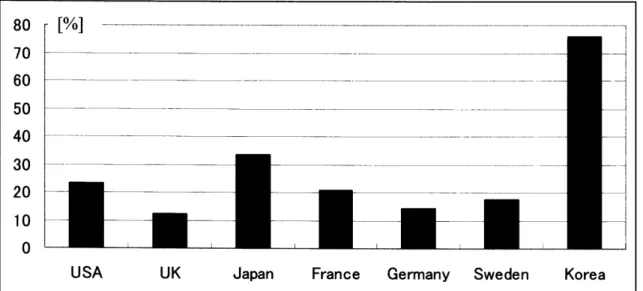
Korea has the greatest penetration rate of broadband for household use, followed by Japan and the U.S. (see Figure 1-2). This is the result not only of
technological advances but also reflects the Korean government's leadership in implementing policies to improve the communications infrastructure. Indeed, growth rate of broadband in Korea has almost reached saturation level now.
dU 70 60 50 40 30 20 10 n rn/i L ... ... ... ... ... I/o _____.,____,__...,,,_._A
USA UK Japan France Germany Sweden Korea
Source: Information Communications Handbook 2005, InfoCom Research, Inc., NTT Data Institute of
Management Consulting, 2004.
Fig. 1-2 Penetration rate of household broadband use
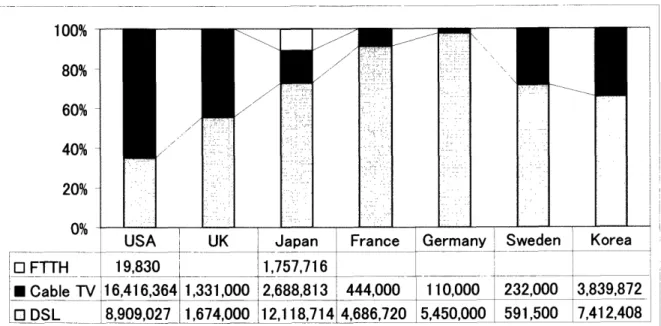
In countries outside the U.S., DSL is the main form of broadband Internet, as shown in Figure 1-3. In the U.S., cable modem holds more than 60% of the market.
In the U.K., DSL use is increasing but cable still counts nearly half of all users. The strong role of cable in the U.S. and U.K. evolved out of their respective regulatory histories. Both countries agreed in the early stages to enter the telecom business using cable after the breakup of the AT&T and BT monopolies. As regulations became more relaxed, cable companies expanded their capabilities within the telecom services. I VJA ! r ~ ~ ~ ~ ~ ~ ~ ~ ~ ~ ~ ~ ~ ~ ~ ~ ~ ~ ~ ~ ~ ~ ~ ~ ~ ~ ~~~~---~ ~ ~ ~ ~ ~ ~ -- ---v I I _ __. _ I
100% 80% 60% 40% 20% 0% . I : i I
France Germany Sweden Korea
E1FTTH 19,830 _1,757,716 _ _
* Cable TV 16,416,364 1,331,000 2,688,813 444,000 110,000 232,000 3,839,872 LO DSL 8,909,027 1,674,000 12,118,71414,686,720 5,450,000 591,500 7,412,408
Source: Information Communications Handbook 2005, InfoCom Research, Inc., NTT Data Institute of
Management Consulting, 2004.
Fig. 1-3 Numbers of broadband subscribers
Until recently, U.S. cable companies had retained their majority hold on
broadband users. However, in the U.K., BT and Mercury were prohibited from
supplying video transmission service using public networks; the ban was lifted in 2001. As a result, both telecom and cable companies went into their core
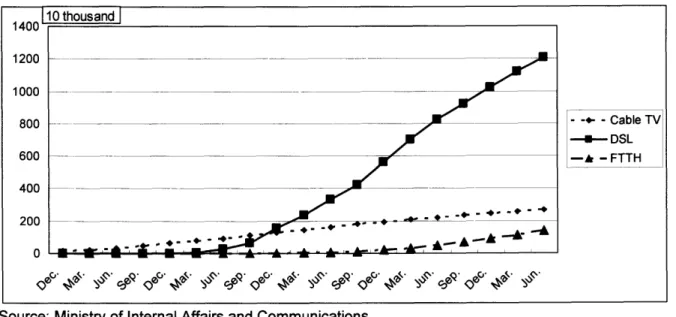
businesses and competition for broadband services became much more intense. Figure 1-4 shows changes in the rate in Japan. The number of DSL users overtook cable users by the end of 2001. This was caused by a price war instigated
by DSL.
I
-_
-I
10 thousand I 400 1200 800 - _ __-- _ _ _ _ _ ___ __ _ _ 600 _ --- - _ _ _ _ _ _ _______________ 400 __ - _ _ _ _
200
--
if-
- : 8 ;; i
-
;_
__
0e
cod
-SAd
-4.-4--
-oC: 0...
-r ~
0
\"~"S'*
'--
--
0·
4&
'*A0
- - - CableTV -- DSL -h -FTTHSource: Ministry of Internal Affairs and Communications
Fig. 1-4 Changes among broadband subscribers in Japan
Broadband penetration in Japan is a good example of the relationship among markets, technologies, and regulations. I will describe the key factors of breakthrough innovations in established firms and a story that provides the
background of DSL's rise in Japan.
Managing in a way that encourages breakthrough innovation in an established firm involves three key factors, which I have identified below:
1. Technology life cycle
Technology life cycles have four phases: fluid phase, transitional phase,
mature phase, and discontinuities phase.4 Ideally, established firms will have an
s-curve5 that is in good condition, meaning the technology will almost certainly lead to success, and another technology will follow. If firms can generate successive
technology successfully, each project should be small and the company should allocate authority to each project leader so that projects can be managed flexibly in concert with its current phase in the technology life cycle.
2. Human resource allocation
Allocating human resources is a key to managing breakthrough innovation. Hiring excellent employees and placing them appropriately supports the possibility of developing a breakthrough innovation. Existing team members do not necessarily need to be changed in order to sustain innovation; they can continue to generate incremental innovations using the abilities they have already acquired. When it comes to radical innovation, however, it may be necessary to create a new team or
perhaps add some people with special skills. To create such a team, a top-down approach is useful. Moreover, managers need to maintain a high level of motivation
among their team members because new projects tend to be risky and sometimes upsetting to team members.
3. External environment
Decisions regarding innovations involve real uncertainty-about the future, about scramble uncertainty, which means that newly supplying service scrambles for the same market share with existing service, as well as concerns regarding margin erosion and implementation. These uncertainties cannot be predicted, except perhaps for internal market share scramble. If possible, such situations should be avoided.
In the following, I describe an example involving ISDN and DSL in Japan.
NTT East and NTT West are the regional telephone companies of Japan, major subsidiaries of NTT holding company. Until 2000, ISDN (integrated services digital network) was widely used all over the country with approximately ten million lines. NTT Group decided that ISDN was a short-term solution for digital services
that could be used to lead into FTTH (fiber to the home) as a breakthrough
innovation for the long term. In fact, optical fibers have already been laid over 50% of Japan as of 2001.
In 2001, Japan's Telecommunication Business Law (TBL) was revised. The
revision included two policies: one regarding unbundling of services, and the other regulation of dominant companies. NTT East and NTT West, which were regarded as the dominant companies, were required to divide their network infrastructures and services in order to encourage greater competition in the telecom industry. Under the new policies, new telecom entrants could use NTT's infrastructure at low cost.
Soon thereafter, Softbank Corporation (established in 1981 as a distributor of personal computer software and now expanding into broadband networks and e-commerce)6
began to sell DSL and IP phones at very low cost, which caused totally
disrupted telephone rates being charged by NTT East and NTT West. At the time,
NTT East and West were steadily increasing their sales of ISDN. But with Softbank's incursion, both NTT companies were forced to change direction and join the booming DSL competition. This change resulted in serious financial damage to NTT East and NTT West because ISDN sales declined.
It is true that DSL transmission rates are much faster than ISDN. In fact, DSL is considered a "best effort" service, despite the fact that and its performance can be
reduced owing to external factors such as microwaves. But the technology functions by using existing analog telephone lines, which means less engineering is required and maintenance costs are cheaper. Thus, DSL has quickly penetrated the Japanese market.
However, from a technological standpoint, it is not an innovation; rather it
closer to a backward step, moving from digital back to analog. At the time, NTT had
just changed from analog lines to digital ISDN lines. But with the DSL boom, NTT
was forced to rethink their plans for investment-perhaps even changing back from ISDN to DSL in some areas. This change also resulted in an erosion of employee motivation because ISDN and FTTH were key projects for NTT at the time.
This example shows how established firms are sometimes forced by external pressures to provide new services, even if that change results in internal market share scramble. It also means that the transitional phase of new technologies, such
as ISDN and FTTH, are unexpectedly extended. NTT had developed both its DSL
and ISDN technologies from the initial stage. Especially with ISDN, NTT laboratories
had invented and developed the technology in the early 1980s. And the company
followed its strategic plan to offer the service for digital data networks, subsequently leading to FTTH. But external circumstance interrupted the plan, and the project could move forward. From this example, it is clear that existing external factors influence innovation. In 2001, NTT was unable to convince consumers about the long-term benefits of their product.
It is my belief that in order to manage for breakthrough innovation, a firm
should be convinced of the innovation's long-term success. If the company views the issue only in terms of immediate gains and losses, it could easily "kill the golden goose." Even if many high hurdles develop, a firm must continue to encourage their innovation projects and perhaps allow for the possibility of some period of stagnation.
It is a classic example of the truism: "no pain, no gain."
(2) Trend #2: IP Networks
Many providers supply VolP (Voice over Internet Protocol) as part of the development of broadband. VolP is currently one of hottest trends in the telecom industry.
It began in December 2003, when AT&T, TWC (Time Warner Cable, the
second-largest cable company), and Quest (a Baby Bell) each announced they would begin offering VolP service. Following this announcement, Verizon and Comcast also entered the competition. Although VolP in the U.S. has grown steadily since 2003, the number of users remains low at this point.
Long distance telecom companies have seen a 10% decrease in revenues and they consider VolP phone service an annoyance. In response, they have made
strong efforts to bundle local area and long distance services as a way to retain
customers. However, wholesaling of local lines remained a problem. So the long-distance providers also began to look at VolP, which would enable them to supply
end-to-end communications without relying on wholesale local lines. Among the long
MCI and Sprint, aligned themselves with cable companies, which got into VolP via their "triple play" service that offers cable TV, Internet, and VolP. The Bell companies, forced to offer VolP service because of strong competition from cable
companies, has appealed to its investors and to regulatory authorities. As a result,
the regulation of VolP has been under discussion in the U.S. since 1998.
In the U.K., NTL and TeleWest (cable companies) are the major suppliers of cable telephone service. Together they have four million subscribers, about 17% of the residential telecom market. In December 2003, BT announced it would begin
supplying VolP, with a special focus on cable telephony users. Moreover, by 2006,
BT plans to change 28.7 million telephone subscribers, including local networks, to IP networks. The EU has been formulating IP phone regulations since June 2004.
In Japan, the number of VolP users has grown to almost five million. Japanese ISP provides VolP service as an added bonus, so the service fee is set extremely low. As the forerunner of VolP, each company began preparing various services, including VolP communication between different manufacturers' phones as well as IP television phone service.
(3) Trend #3: Mobile communications
The number of cellphone users in the world had increased about 50% per year since 2000. More recently, the increase has dropped to 20% per year. At the same time, the number of cellphone users has surpassed fixed phone users, as shown in Figure 1-5. For example, fixed phones accounted for more than 90% of
total voice traffic in the U.K. in 1994; since then it has declined about 80% (survey by OFCOM).7 Llv"lllJlJul I OUU
1400
__
1200 1000 . ,800
_
__.
·' 600 *'I-400
_
_ _
_
200- - , _ __ 199 992 1993 99 1995 1996 00 1997 998 1999 2002 2003 Fixed phone 549 576 610 641 685 742 796 854 919 998 1061 1129 1210 ' - Cellurar phone 15 21 34 54 88 140 211 314 473 727 1481387194Source: Information and Communication Outlook 2005, InfoCom Research, 2004 Fig. 1-5 Number of subscribers in the world
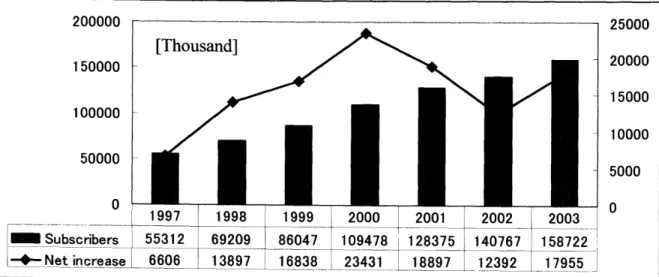
A Figure 1-6 shows, in the U.S., growth of cellphone penetration has almost reached saturated. However, in developing countries the growth rate remains very
high. 200000 25000~~_1~1111.~111 1 25000 20000 15000 10000 5000 0 200000 150000 100000 50000 0 97 1998 1999 2000 2001 2002 | 2003
312 69209 86047
.7t,998
.999
1094782ooo
1283752oolt.o
o 2 12oo3
140767 15872255z
66 16838 23431 18897 12392 17955
Source: FCC, "Trends in Telephone Services", 2004
Fig. 1-6 Changes in cellphone subscribers in the US
-
Subscribers -'- -Net increase1QI rkAil 1;,,,. .Inn
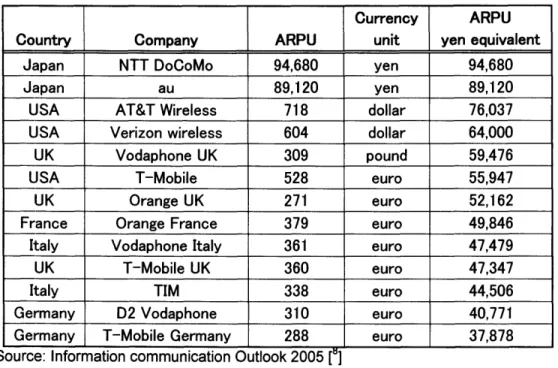
-Table 1-2 shows the average revenue per user (ARPU) of each country's major cellular companies. Compared with other countries, ARPU for Japanese companies is high due owing to strong demand for data via cellphones. The ARPU for cellphones has already exceeded that of fixed phones in Japan. Even so, volume is declining every year. Expenses for data use, such as for i-mode, is steadily increasing, but it cannot cover the gap of declining expense for voice service. In 2004, major cellular companies in Japan announced the introduction of fixed rates for packet usage. The impact of that decision on ARPU will be not available until
after fiscal year-end 2005.
Table 1-2. ARPU among cellular service providers
Currency ARPU
Country Company ARPU unit yen equivalent
Japan NTT DoCoMo 94,680 yen 94,680
Japan au 89,120 yen 89,120
USA AT&T Wireless 718 dollar 76,037
USA Verizon wireless 604 dollar 64,000
UK Vodaphone UK 309 pound 59,476
USA T-Mobile 528 euro 55,947
UK Orange UK 271 euro 52,162
France Orange France 379 euro 49,846
Italy Vodaphone Italy 361 euro 47,479
UK T-Mobile UK 360 euro 47,347
Italy TIM 338 euro 44,506
Germany D2 Vodaphone 310 euro 40,771
Germany T-Mobile Germany 288 euro 37,878
Source: Information communication Outlook 2005 ["]
Several major trends are apparent in the broadband market:
> shrinking fixed voice service,
> expanding broadband use,
strong competition to increase market share, even price wars. These are critical situations, especially for fixed phone providers.
To cope with this situation, FMC (Fixed and Mobile Convergence, a bundled service between fixed and mobile communications based on levels of service and network) is one place where companies can offer differential service in an attempt to
increase revenues.
There are three major types of FMC: packages (one-stop billing), network service, and terminal.
In the package type, the benefit for users is one bill that includes both fixed and cellphone use. This is already being done by major telecom companies in the U.S.
With network service, users can transfer calls going to their cellphone to a specified fixed phone. In the U.S., because a communication fee is charged when receiving a cellphone call, users who transfer to a fixed phone benefit because they
do not have to pay for a cellphone call. Fast Forward, a plan offered jointly by Cingular, SBC, and Bell South, is an example of this kind of service.
Terminal type enables users to use both fixed and cellphone services in one
cellular terminal. Recently, major telecom companies joined One-Phone Project. In addition, an alliance among these companies is created. BT has a similar Blue Phone project which I will describe in greater detail in Chapter Three.
1.3.2 Effect of Regulations
As mentioned earlier, regulations have a great impact on the strategies of telecom companies and the industry as a whole.
In the U.S., the Federal Communications Commission (FCC) implemented the Telecommunications Act of 1996 to promote competition in local communication markets, which forced incumbent local exchange carriers (ILEC) to open their network resources. This regulation remains under discussion in the telecom industry. The latest directive from the FCC9eliminates the obligation to unbundle the
FTTH loop for ILEC.
As for VolP, the FCC has been evaluated it specifically. But as VolP service becomes increasingly popular, the FCC will implement procedures to regulate it. Such regulations will undoubtedly relate to access fees, universal funds, federal
wiretap law, and so on. Some say that the 1996 act, instituted in the era of the legacy telephone companies, is already out of date, and it will need to be updated.
In the UK, Ofcom, which regulates the UK communications industry and is responsible for television, radio, telecommunications and wireless communications services, is working to revise its communication policy for the first time in thirteen years.
Telecom companies across the board are having to rethink their strategies as they take steps to comply with the stream of regulations. Sometimes it is necessary to appeal regulatory authorities before proceeding with strategic policy making.
1.3.3 Evaluating Current Technologies
Today's technologies require high speed, mobility, and transparency. Basic technologies in each field of network, platform, and terminal have been progressing
well, with various technology innovations in these fields.
Transparency means that users should not be conscious of networks and/or computers when they use telecom technologies. FMC is one example of a transparent technology. However, it seems that technologies for transparency are still somewhat unsatisfactory. To realize a better level of such service, related technologies including security, certification, user interfaces, and convergence network controlling should be explored in the future.
Endnotes for Chapter One
1 World Competitiveness Scoreboard 2004: see: <http://www01. imd.ch/documents/wcc/content/ranking.pdf>
2 White paper on telecommunications 2004:
<http://www.johotsusintokei.soumu.go.jp/whitepaper/ja/h 16/index.html>
3 NTT East, see: <east.co.jp/index_e.html>; for NTT West, see: http://www.ntt-west.co/jp/index_e.html>.
4 E.B. Roberts and W.K. Liu. "Ally or Acquire?", MIT Sloan Management Review, Fall 2001.
5 J. Utterback, Mastering the Dynamics of Innovation. Cambridge, MA: HBS Press, 1996, pp. 145-66.
6 For information on Softbank, see their website: <http://www.softbank.co.jp/english/index.html>. 7 For information regarding the Communications Market 2004-Telecommunications survey, see: http://www.ofcom.org.uk/research/industry_marketresearch/m i index/cm/cmpdf/telecoms/pdf>.
8 Information and Communication Outlook 2005, InfoCom Research, 2004. Printed in Japan.
9 FCC, "Trends in Telephone Services," 2004, see:
Chapter Two
An Overview of NTT
2.1 NTT's Current Situation
The rapid penetration of broadband has brought substantial changes in the telecommunications services market in Japan. In particular, DSL services continue to grow, while optical access services are also accelerating. On the other hand, the fixed-line telephone market in Japan has been shrinking due to the availability of flat-rate dedicated Internet access services and the rapid growth of telephone services
based on IP technologies. In the mobile communications market, the use of packet
telecommunications continues to expand.
Faced with these challenging business conditions, NTT Group has tried to
reform its earnings structures and cut costs. In April 2003, NTT announced the NTT
Group Three-Year Business Plan.1 NTT Group is focused on discount pricing and
strategic infrastructure investment to boost sales activity of B-FLET'S,2 an optical access service with high-level reliability. In the mobile market, NTT Group will aggressively promote FOMA,3 NTT DoCoMo's third-generation mobile phone system.
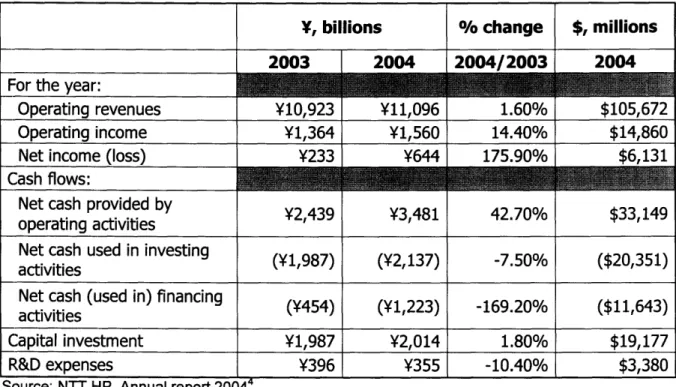
The success of these initiatives contributed to higher sales and profits during the fiscal year ending March 31, 2004. Consolidated operating revenues increased
NTT Group (see Table 2-1). Major factors contributing to these record-high results include strong growth in packet communication services, including i-mode at NTT
DoCoMo (see number of subscribers in Table 2-2 and ARPU in Table 2-3), and substantial reductions in costs at NTT East and NTT West, which more than offset
declines in sales due to falling fixed-line telephony revenues.
Table 2-1 NTT's financial data as of March 31, 2004
Y, billions % change $, millions
2003 2004 2004/2003 2004
For the year:
Operating revenues Y10,923 Y11,096 1.60% $105,672
Operating income Y1,364 Y1,560 14.40% $14,860
Net income (loss) Y233 Y644 175.90% $6,131
Cash flows:
Net cash provided by Y2,439 Y3,481 42.70% $33,149
operating activities
Net cash used in investing (Y1,987) (Y2,137) -7.50% ($20,351)
activities _ _ _ _ _ _
Net cash (used in) financing (Y454) (Y1,223) -169.20% ($11,643)
activities
Capital investment Y1,987 Y2,014 1.80% $19,177
R&D expenses Y396 Y355 -10.40% $3,380
Source: NTT HP, Annual report 20044
Financial results in 2004 were better than expected, but this was mainly caused by strong cost reduction efforts that cannot be continued at the current pace. Moreover, NTT Group will need to make a substantial investment to develop plans for the next-generation network, including replacement of all legacy telephone networks with IP networks over the next several years. Thus, NTT Group will have to
plan on enormous financial outflows for the foreseeable future in order to accomplish these plans.
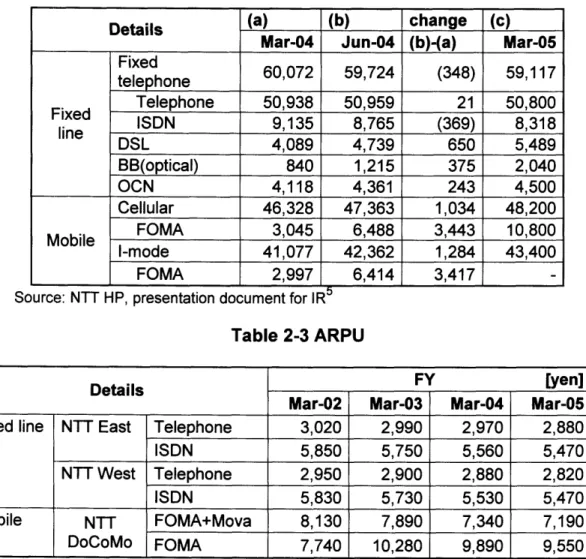
Table 2-2 Number of subscribers
Details (a) (b) change (c)
Mar-04 Jun-04 (b)-(a) Mar-05 Fixed telephone 60,072 59,724 (348) 59,117 telephone Telephone 50,938 50,959 21 50,800 lined ISDN 9,135 8,765 (369) 8,318 DSL 4,089 4,739 650 5,489 BB(optical) 840 1,215 375 2,040 OCN 4,118 4,361 243 4,500 Cellular 46,328 47,363 1,034 48,200 FOMA 3,045 6,488 3,443 10,800 I-mode 41,077 42,362 1,284 43,400 FOMA 2,997 6,414 3,417
Source: NTT HP, presentation document for IR Table 2-3 ARPU
Details FY [yen]
Mar-02 Mar-03 Mar-04 Mar-05
Fixed line NTT East Telephone 3,020 2,990 2,970 2,880
ISDN 5,850 5,750 5,560 5,470
NTT West Telephone 2,950 2,900 2,880 2,820
ISDN 5,830 5,730 5,530 5,470
Mobile NTT FOMA+Mova 8,130 7,890 7,340 7,190
DoCoMo FOMA 7,740 10,280 9,890 9,550
<Note> FOMA + Mova are used for data communications. Source: NTT HP, presentation document for IR5
As of March 31, 2004, the number of employees in NTT's holding company, including headquarters staff and the R&D laboratories, was 3,056, with 205,288
employees in the combined NTT Group. As shown previously in Table 2-1, Capital
way, now R&D is also affected by cost reduction program in the points of the number of researchers and R&D expenses. The effect of this stringent policy is emerged that the evaluation of products for transition from research to business, which needs prototyping and developing, becomes very strict and self-manufacturing prototypes are increased instead of outside order. So far, cost reduction effect to R&D not to
bring in products or technologies from outside but to make them by themselves.
2.2 History
Significant changes have occurred in recent years in the legislative and regulatory frameworks governing telecommunications in Japan; indeed, changes are ongoing, including implementation of telecommunications reform laws aimed at promoting competition in the telecommunications services market.
Prior to April 1, 1985, the predecessor corporation, Nippon Telegraph &
Telephone Public Corporation, was the sole domestic telecommunications carrier in Japan. On April 1, 1985, NTT was incorporated as a limited liability, joint-stock company under the NTT Law6 and the new entity received all the assets and liabilities of the predecessor corporation. (Government and municipal corporations
still own 46% of NTT.)
In 1953, the predecessor corporation's international division, which operated Japan's international telephone, telegraph, and related telecommunications services, was transferred into a separate corporation, Kokusai Denshin Denwa Co., Ltd., which became KDDI.
In 1988, sales activities covered by the central data communications division were transferred to NTT Data Corporation. In addition, the sales division of car phones and other mobile phones were transferred to NTT Mobile Communications
Network, Inc. (NTT DoCoMo) in 1992. NTT was reorganized into an NTT holding company comprised of NTT East, NTT West, and NTT Communications in 1999.
The telecom business began in 1890 in Japan. From a technological point of view, the business had centered on voice communications through the 1960s. In the 1970s and 1980s, the digital era took over, the networks for voice and data converged. Moreover, ISDN and convergence with computers also entered the picture. In the 1990s, IP and mobile networks became the next major target of the telecom business.
From the voice communication era through the 1980s, NTT continued its long-established practice of leading and working with a small group of suppliers, manufacturers, subsidiaries, and group companies in order to jointly develop
advanced equipment. By and large, NTT maintained its strategies throughout the
1990s. While this period, NTT had tried to promote procurement of switches and many peripheral equipment from both domestic and international manufacturers, but it was took over by domestic telecom related manufacturers practically. AT this point, the relationship with domestic vendors was really tight and NTT R&D took a role of directing and leading what they should make based on their long-time research about network infrastructure. Through this scheme, manufactures were also enhancing their technological capabilities. However, as IP and mobile communications became dominant, the old NTT style not enough sufficient to handle
both domestic and international competition. Recently, NTT decided lessen its reliance on independent R&D in favor of faster development.
2.3 Current Strategies
NTT has decided on two major strategies to improve its market position:
- IP on optical fiber networks and
, RENA (Resonant communication network architecture)
These strategies are really historical shakeup for NTT, because this means that NTT decided to put an end to legacy telephone networks, which have been their backbone and biggest source of income quite a long time. Moreover it was shift in strategy of laying optical fibers from demand estimation to demand boosting. As is
the case with other telecom companies like AT&T and BT, NTT has been taken their
position against VolP as Denial, Anger, Reluctant acceptance and Capitulation in
this order.7 Now NTT set down VolP as one of key applications of FTTH (Fiber To
The Home).
2.3.1 IP on Optical Fiber Networks
In November 2004, NTT announced that its fixed-line telephone networks will be replaced by next-generation networks that use IP technologies over optical
networks.8 The company has set a target of moving 30 million users (among its
current base of 60 million fixed telephone users) to its new IP networks by 2010.9 To
accomplish this plan, NTT Group will invest 5 trillion over the next six years, including ¥3 trillion for developing next-generation networks.
This kind of shift in strategy is extremely rare for NTT. In the past, NTT has
not attempted to be proactive but instead has responded reactively to its competitors. However, this strategy change comes as the result of a demand-and- supply analysis which was conducted to determine how to boost demand as a result of
changes in the competitive environments. In 2004, both BT and KDDI announced
they would change over their fixed telephone networks to IP networks. NTT countered this announcement by cutting the price of the base charge for fixed
telephone service. However, that was not enough to make NTT more appealing to
customers. Therefore, NTT announced its drastic solution: a complete transformation from legacy networks to IP on optical fiber networks.
Behind this announcement, many uncertainties remain. Two primary concerns are deregulation of the optical fiber networks' open obligation for NTT East and NTT West and revision of universal funds. These issues are strongly tied to political positions and moves by other countries. NTT must move the plan into action
but will have to do so with some conditions.
2.3.2 RENA (Resonant Communication Network Architecture)
As revenues from fixed telephones have decreased, NTT Group has had to
find new sources of income. While it has gained increased revenue from both basic FTTH charges and from a variety of added services, NTT is now adopted a new strategy known as RENA (resonant communication network architecture), which provides a variety of applications and secure network services on IP over optical fiber networks. With a primary focus on visual communication, it will feature a
multi-function, easy-to-use TV phone, convergence between wired and wireless data communications, a sensor and wireless IC tag application, and distribution of high-volume content.10 RENA can also handle real-time and non-real-time applications simultaneously using optical path routing technology and moving firewall
technology.1 1 To realize these services and networks, NTT will use technologies
developed in their own laboratories.
In order to realize RENA, NTT established a new company named NTT
Resonant at the end of 2003. The new company is a merger of the NTT-X operating portal site "goo" and NTT-BB content distribution supplier for broadband users. The other members of NTT Resonant are from NTT laboratories. All of them believe that NTT laboratories' technologies will be RENA frontrunners. Actually the reason why NTT decide to rely on internal technology for RENA was that almost all fields of
technologies related RENA has been studied inside NTT labs with pouring a large
amount of R&D expenses. So, they would like to maximize the contribution of R&D to business by using their own technologies.
In reality, NTT is a technology-oriented company, and have had a major role
in leading related companies such as manufacturing companies, subsidiaries, and NTT group companies. For this reason, technological innovations are very much dependent on internal development. When technologies were brought to market, they were often spun off from NTT holding company or its subsidiaries and then established as a new group company. This scheme was not totally satisfactory, but it worked passably well. However, the clock speed of the telecom industry continues to shorten with each passing year. Therefore, for both IP over optical fiber networks
and RENA, it is necessary to develop and supply services in an extremely short time
frame. It has become clear that it is critical to rethink the scheme and culture of NTT
Group to bring it in alignment with today's rapidly changing telecom market. The
other problem is that R&D in product-based structure is far from selling section and
customers and hard to gain an understanding of customer needs. As a result, it
tends to supply over specification products more than customer expected, regardless of customers want simpler and lower cost products honestly. I'd like to describe in detail in the next section.
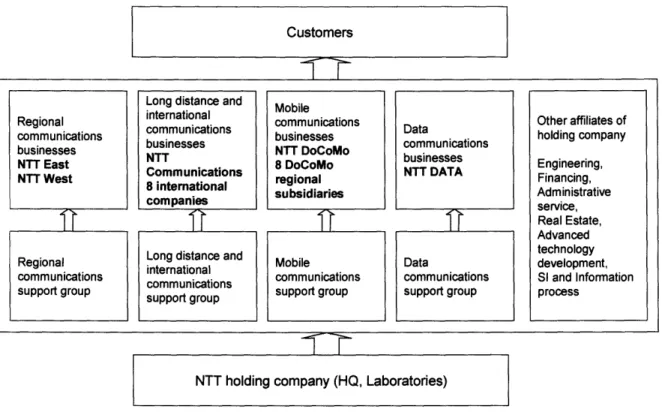
2.4 Organization
Figure 2-1 shows the organization chart for NTT Group. Each business group has its own support group to execute the business of that group; the holding company also has many other affiliates to support, such as administrative services and engineering. These small companies are mainly comprised of internal resources from the holding company and five main subsidiaries. The smaller companies are joint ventures, and those obtained through merger and acquisition. Advanced technology development, R&D, system integration, and information process business support companies all conduct R&D to help develop products and do business, making use of their own facilities rater than the laboratories of the holding company.
Two conclusions can be drawn from this organization. The first is that each
major subsidiary and holding company, including their respective laboratories, maintains a specified number of employees and makes every effort not to increase
that number. The second conclusion is that supporting companies can operate their business effectively in short time frames due to their small size.
Based on these points, it can be said that the organization works well, and helps to avoid any business stagnation in the existing company.
Customers
_~~~~
-T
Regional communications businesses NTT East NTT West Regional communications support groupLong distance and international communications businesses NTT Communications 8 international companies
Long distance and international communications support group Mobile communications businesses NTT DoCoMo 8 DoCoMo regional subsidiaries Mobile communications support group Data communications businesses NTT DATA Data communications support group Other affiliates of holding company Engineering, Financing, Administrative service, Real Estate, Advanced technology development, SI and Information process
NTT holding company (HQ, Laboratories)
Fig. 2-1 Organization Chart of NTT Group
However, there are also two problems with this organizational structure. The first problem is that most of the small companies were spun off from inside of NTT Group's resources in order to support their parent companies. Therefore, the culture and strategy of these small companies strongly reflect the culture and strategy of the parent company, and there is less diversity of thinking. Consequently, there are
IT 1-T 1 T I - -&, I ,,i I, ! l I I
---
-I Imany small companies in NTT Group but they are not accustomed to producing innovative technologies, services, or products.
The second problem is that the laboratories and R&D sections in the holding company are located far from customers, which tends to make the company less able to identify marketing trend and customer needs. To improve this problem, NTT holding company has created a producers' section whose producers are composed of technical people from the laboratories and marketing people from the subsidiaries. Together they manage both the development and marketing. Almost all of the technologies and services in the laboratories are supplied through producers to each subsidiary and then to customers.
With regard to NTT Resonant, that company takes the producers' parts for
RENA services, and flows from R&D to business are now being executed via this
scheme. Some time will be needed before a proper assessment can be made, but so far it appears that the gap between R&D and the customers is larger than expected.
Once companies have experience with value networks, they tend to form skills, organization structure, and a corporate culture that corresponds to a demand that is far ahead of others.12 In the past, NTT has made its abilities, organization, and culture fit with its existing operating network services. Now it is trying to change its organization structure. This is the time to make further innovative changes in concert with the changing circumstances surrounding the telecom industry in general.
2.5 Competitors in the Japanese Market
Competition between NTT and Softbank has been especially intense in the past few years. Softbank was originally a wholesale dealer of PC software, but it has grown very large through numerous M&As. It merged with Japan Telecom'3 in the local phone market, and Cable & Wireless IDC 14 in the long distance and international phone market. It also allied with Yahoo Japan in the broadband services market.15. Now it is considering getting into the cellular phone services market. Thus, each company has offered distinct benefits to the services they offer, and this has served to widen their competitive positions.
The major differences between NTT and Softbank are their strategy and culture. NTT enjoys hard-and-fast brand power due to its long history as a leader in the Japanese telecom industry. In contrast, Softbank gives priority to marketing as a result of its earlier core business as a wholesale dealer. The company makes full
use of its marketing skills and speed in its competition with NTT. NTT is superior in
its technical strength and general abilities.
As for FMC (fixed and mobile convergence), both companies are aiming squarely at achieving dominance in this field. But Softbank is at a disadvantage because it is legally barred from entering the cellular phone business. At NTT, fixed
phones and cellular phones are operated by different companies, so it too has a regulation problem. So both companies are still reviewing this issue.
The phases of competition are usually function, reliability, convenience, and price in this order. However, Softbank, a radical reformer, entered the competition at
capabilities, but now it will need to think about fundamental issues in the telecom business. As for NTT, the key elements to its growth will be its marketing abilities and business speed to supply timely services using innovative technologies.
Endnotes for Chapter Two
NTT News Release, NTT Group Three-Year Business Plan (FY 2003-2005)
Toward Early Achievement of Resonant Communications Environment:
<http://www. ntt.co.jp/news/newsO3e/0304/030423. html>. See also: <http://www. ntt.co.jp/ir/e/businessgoals. html>.
2 NTT East, B-FLETs: <http://www. ntt-east.co.jp/product_e/05/index. html>.
3NTT DoCoMo, FOMA: <http://www.nttdocomo.co.jp/english/p s/service/foma/index.html>. 4NTT Annual report 2004: <http://www. ntt.co.jp/ir/pdf/04/e/p2. pdf>.
5NTT HP, presentation document for IR: <http://www.ntt.co.jp/ir/e/presen/o/doc/050204e.pdf>. 6NTT Law: <http://www.soumu.go.jp/joho_tsusin/policyreports/english/laws/Ntt_law.html>. 7 Howard Anderson, "Why big companies can't invent", MIT's magazine of innovation Technology
Review, May 2004, pp.56-59
8 NTT News release, "NTT Group's Medium-Term Management Strategy":
<http://www. ntt.co.jp/news/news04e/0411/041110d. html>.
9 "NTT's ambition for new IP over optical infrastructure", Nikkei Communications, 15 December
2004, pp.36-42.
10 "What's RENA?", Nikkei Communications, 12 April 2004, pp.44-54.
" "New era of Resonant communication begins", NTT Technical Journal, Vol.16, No.4, 2004,
p.6-22.
12 Christensen, Clayton, M. The Innovator's Dilemma. Cambridge, MA: Harvard Business School Press, 2001.
13 "Softbank pursues Japan Telecom", The Japan Times:
<http://202.221.217.59/print/business/nb05-2004/nb20040526a4. htm>. 14 "Softbank to acquire C&W IDC", The Japan Times.
<http://202.221.217.59/print/business/nbl 10-2004/nb20041 027a3.htm>.
Chapter Three
An Overview of AT&T and BT
3.1 AT&T
3.1.1 History
The history of AT&T is one of continuous breakup and restructuring.1 I have split the history in segments by date and will discuss each segment.
(1) Privatization and breakup: to 1984
In 1876, Alexander Graham Bell invented the telephone, for which he received two patents. Later, he founded the company that became AT&T, which was comprised of three major sectors: local and long distance, R&D, and production. For many years, until its breakup in 1984, this company held a virtual monopoly on telephone service in the U.S. In 1984, American antitrust laws were applied to AT&T, and as a result of Judge Green's historic ruling, the company was divided into seven
local telephone companies known as "Baby Bells."
During its dominant era, AT&T provided long distance services; its subsidiary, Bell Laboratories was world famous for research and development; and other subsidiaries manufactured and installed telephone equipment that incorporated Bell Labs' R&D innovations. Vertical integration dominated, upstream to downstream. In 1984, AT&T created a vertical separation between local and long distance service.
(2) Horizontal diversification: 1984- 1993
At the same time, AT&T was allowed to diversify horizontally, which meant the company could enter the computer business. In 1991, it acquired NCR Corporation, a computer manufacturer, in an attempt to created synergies which AT&T believed were coming with the integration of computing and communications. AT&T also merged with McCaw Cellular Communications, the largest provider of cellular service in the United States; that division was renamed AT&T Wireless in
1993.
(3) Spin-off of Systems, Computers: 1984 - 1996
After numerous twists and turns, AT&T spun off a products and systems company (later named Lucent Technologies) and a computer company (which reassumed the NCR name). Bell Laboratories were taken over by Lucent Technologies.
(4) Vertical integration and horizontal separation: 1996 - present
In 1998, AT&T acquired Teleport Communications Group (TCG), the largest alternative provider of local telecommunications service in the U.S. In 1999 it acquired Tele-Communications, Inc. (TCI), the second-largest cable company in the
U.S. (later renamed AT&T Broadband), and in 2001 it added NorthPoint
Communications, a provider of high-speed local data network services. As a result of these acquisitions, AT&T now had local and broadband companies that could be used as access networks.