Publisher’s version / Version de l'éditeur:
Vous avez des questions? Nous pouvons vous aider. Pour communiquer directement avec un auteur, consultez la
première page de la revue dans laquelle son article a été publié afin de trouver ses coordonnées. Si vous n’arrivez pas à les repérer, communiquez avec nous à PublicationsArchive-ArchivesPublications@nrc-cnrc.gc.ca.
Questions? Contact the NRC Publications Archive team at
PublicationsArchive-ArchivesPublications@nrc-cnrc.gc.ca. If you wish to email the authors directly, please see the first page of the publication for their contact information.
https://publications-cnrc.canada.ca/fra/droits
L’accès à ce site Web et l’utilisation de son contenu sont assujettis aux conditions présentées dans le site LISEZ CES CONDITIONS ATTENTIVEMENT AVANT D’UTILISER CE SITE WEB.
NACE Northern Area 2003 Conference [Proceedings], pp. 1-20, 2003-09-01
READ THESE TERMS AND CONDITIONS CAREFULLY BEFORE USING THIS WEBSITE. https://nrc-publications.canada.ca/eng/copyright
NRC Publications Archive Record / Notice des Archives des publications du CNRC :
https://nrc-publications.canada.ca/eng/view/object/?id=73879711-a8c5-4ab6-a22e-80cd98919caa https://publications-cnrc.canada.ca/fra/voir/objet/?id=73879711-a8c5-4ab6-a22e-80cd98919caa
NRC Publications Archive
Archives des publications du CNRC
This publication could be one of several versions: author’s original, accepted manuscript or the publisher’s version. / La version de cette publication peut être l’une des suivantes : la version prépublication de l’auteur, la version acceptée du manuscrit ou la version de l’éditeur.
Access and use of this website and the material on it are subject to the Terms and Conditions set forth at
Corrosion performance of reinforcing steel in concrete containing supplementary cementing materials
Corrosion performance of reinforcing steel in concrete containing supplementary cementing materials
Qian, S.; Baldock, B.; Qu, D.; Bouzoubaâ, N.; Gu, P.; Fournier, B.
NRCC-45401
A version of this document is published in / Une version de ce document se trouve dans : NACE Northern Area 2003 Conference, Ottawa, Ontario, Sept. 14-17, 2003,
pp. 1-20
Corrosion Performance of Reinforcing Steel in Concrete Containing Supplementary Cementing Materials
S. Qian, B. Baldock and D. Qu Urban Infrastructure Rehabilitation Institute for Research in Construction
National Research Council Canada, Ottawa, Canada, Ontario, K1A 0R6 N. Bouzoubaâ, P. Gu and B. Fournier
Canada Centre for Mineral and Energy Technology Natural Resources Canada, Ottawa, Ontario, K1A 0G1
ABSTRACT
This paper summarizes the corrosion results of a 5.3 year study on the corrosion performance of reinforcing steel in concrete slabs containing supplementary cementitious materials and exposed to chlorides. Chloride ions were introduced into the reinforced concrete slabs through a natural migration process, i.e. a ponding solution of 3.4% sodium chloride on the top slab surface of the concrete slab. The concrete mix was designed with a 0.32 water-to-cementitious materials ratio (w/cm), containing plain Portland cement and additions of fly ash Class C, fly ash Class F, silica fume and blast furnace slag. Concrete slabs with Portland cement only and different w/c ratios (0.32, 0.43 and 0.55) were also tested. The thickness of concrete cover to the steel reinforcing bars ranged from 13 mm to 76 mm. Corrosion of the reinforcing steel bars was evaluated using the half-cell potential, linear polarization and AC impedance techniques. The test results indicated that the concrete incorporating fly ash Class C had the best performance with respect to chloride induced corrosion followed by the concrete containing silica fume and the control concrete with w/c of 0.32. In these concrete slabs the corrosion rate of the steel bars was relatively low, even with 13 mm concrete cover. The concretes made with Class F fly ash and blast furnace slag performed better than the Portland cement concretes with w/c of 0.43 and 0.55.
Keywords: Chlorides, concrete, corrosion, fly ash, blast furnace slag, silica fume, reinforcing steel, water-cement ratio
INTRODUCTION
Corrosion of reinforcing steel is a major cause of failure in concrete structures. There are many methods for protection against corrosion of steel in concrete, including addition of inhibitors, cathodic protection, metallic coatings for steel reinforcement or as described in this paper the addition of supplementary cementing materials such as silica fume, fly ash and blast furnace slag to the concrete. The use of these materials in concrete not only improves the mechanical properties and durability but also uses industry by-products (silica fume and fly ash) and has, therefore, significant environmental and economic benefits. Silica fume concrete has a high compressive strength, low permeability and good resistance to
freeze-thaw cycling.1 Similar performance enhancements have also been achieved for high volume
fly ash and blast furnace slag concretes.2-6 However research on the long-term effects of these
supplementary materials on chloride ion diffusivity and corrosion of the reinforcing steel in concrete is limited and needs further investigation.
In this paper, an experimental investigation of the corrosion of reinforcing steel bars embedded in concrete slabs containing supplementary cementitious materials was undertaken. The performance of these slabs was then compared to a control mix made of normal Portland cement concrete with the same w/cm ratio. Reinforcing steel bars were embedded in these slabs with different depths of concrete cover in order to investigate the effect on the ingress of chlorides into the concrete of adding cementitious materials. Corrosion tests of reinforcing steel bars embedded in normal Portland cement concrete with higher water/cement ratios (0.43 and 0.55) were also included for comparison purpose.
After 5.3 years of ponding with a 3.4% sodium chloride (NaCl) solution on these concrete slabs, corrosion gradually developed on the reinforcing steel bars. The corrosion probability and current density in the steel bars were investigated using non-destructive
techniques including the half-cell potential,7-9 AC impedance and linear polarization
techniques.10
CONCRETE SPECIMENS
Seven air-entrained concrete mixes were made, four of which used supplementary cementing materials (SCM). These are, two high volume fly ash concrete mixtures made with 58% Class F (FA-F) and Class C (FA-C) and a w/cm of 0.32, 10% silica fume (SF) concrete with a w/cm = 0.32, and 55% ground granulated blast furnace slag (BFS) concrete with a w/cm = 0.32. The other three concrete mixtures were normal Portland cement
entraining admixture (AEA) was used in all the concrete mixtures. The composition of the
concrete mixtures and their codings are listed in Table 1. For each concrete mixture, one
833 mm x 600 mm x 153 mm slab was cast as shown in Figure 1.
The embedded reinforcing bars consists of black steel 15 mm in diameter, 470 mm in
length and an exposed surface of 2.21 x 104 mm2 achieved by coating the two ends of the
reinforcement bars with epoxy (the extra surface area of the ribs on the reinforcement was not counted). Four pairs of reinforcing steel bars were embedded in each slab with concrete covers of 13 mm, 25 mm, 51 mm and 76 mm (see Figure 1). The slabs were cast in April 1997 and cured under wet burlap for 7 days followed by exposure to air in the laboratory for 28 days. They were then ponded with a 3.4% NaCl solution for 5.3 years (duration of the experiment). The physical properties and chemical analysis of these slabs have been reported
elsewhere.11,12
CORROSION TESTING TECHNIQUES
There are several non-destructive techniques available for the investigation of corrosion in reinforced concrete. In order to get a reliable assessment of the corrosion of reinforcing steel, three corrosion evaluation techniques were used in this study: half-cell potential, linear polarization and AC impedance methods.
Half-Cell Potential Method
The half-cell potential method has been widely used because of its simplicity and cost
effectiveness.8,13 This method allows the evaluation of the probability of corrosion activity
through the measurement of the potential difference between a standard portable reference electrode and the reinforcing steel. The data analysis guidelines described in ASTM C876-99 provide general principles for the evaluation of corrosion probability of reinforcing steel in concrete structures.
A saturated Hg/Hg2Cl2 electrode (SCE) was used to measure the potential of the
reinforcing steel, because the ponded water on top of the concrete samples contained chloride
ions. The guideline of half-cell potential specified in ASTM C876 is vs. Cu/CuSO4 electrode
(CSE). The standard potential of saturated Cu/CuSO4 and Hg/Hg2Cl2 is 318 mV and 246 mV
versus that of the standard hydrogen electrode (SHE), respectively. The difference between these two reference electrodes is 72 mV. The guidelines described in ASTM C876 provide general principles for the evaluation of the reinforcing steel corrosion in concrete. The guidelines and their conversion values (vs. SCE) are listed in Table 2.
Linear Polarization Method
The linear polarization technique was used to determine the polarization resistance and the corrosion rate of reinforcing steel bars embedded in concrete. The potential of the steel electrode was scanned at a slow rate of 0.1 to 0.05 mV/s. The tests were initiated at 20
mV below the corrosion potential (Ecorr) and terminated at 20 mV above it, while recording
the polarization current (I). These tests were conducted with one of the following potentiostats, EG&G 273 or 6310, Gamry CMS100, and Solartron 1286 or 1287. The
polarization resistance, RP, of the reinforcing steel is defined as the slope of a
potential-current density plot at the corrosion potential (Ecorr) as follows:
corr E P I V R ∆ ∆ = (1)
Considering the correction of potential drop due to concrete resistance (iR drop correction), RP is: corr E c P I R I V R ∆ ⋅ ∆ − ∆ = (2)
where ∆V and ∆I are the applied potential and current response, respectively, and Rc is the
concrete resistance between the reference electrode and the surface of reinforcing bar, which can be obtained by AC impedance technique. The corrosion current density is calculated from
the Stern-Geary equation:14
P corr R B I = (3) and ) ( 303 . 2 a c c a b b b b B + = (4)
where “B” is the so-called “Stern-Geary constant” that can be determined from the ba and bc,
which are the Tafel slopes for the anodic and cathodic reactions, respectively. Avalue of 26
mV and 52 mV is often used in the calculation for the bare steel in the active and passive
stages,15 respectively. For simplicity, a value of 26 mV was used to calculate all the corrosion
rates in this paper since the corrosion current is inversely proportional to RP. The criteria for
A.C. Impedance Method
The measurement of AC impedance spectroscopy provides information on the electrical resistivity and the dielectrical properties of the concrete cover, the corrosion rate and the mechanism of reaction on the steel/concrete interface. This technique is frequently used in
the laboratory to study the corrosion of steel in concrete. Experimental investigations17,18 have
shown a close relationship between the corrosion rate determined by weight loss and the values calculated from AC impedance measurements.
The AC impedance measurements were performed by a solartron SI 1287 Electrochemical Interface coupled with SI 1260 HF Frequency Response Analyzer (FRA) and controlled by a PC computer with Zplot and Corr-ware software. A small sinusoidal voltage signal of 5 mV was applied over the range of frequencies 100 kHz to 0.0005 Hz. The experimental results were fitted by Zview software based on the equivalent circuit after which the polarization resistance and the corrosion rate were calculated.
RESULTS AND DISCUSSION
Half-Cell Potential of Reinforcing Steel
Half-cell potentials were measured on the reinforcing steel bars embedded in the normal concrete with different w/c ratios and concretes containing SCM. Figure 2 shows the half-cell potential (average of two steel reinforcing bars with same depth of concrete cover) change with increase of the concrete cover depth measured in September 2002. The results indicate that the reinforcing steel bars were all corroded in slab N6 regardless of the concrete cover depth. In slab N5 the rebars with concrete cover depth 13 mm and 25 mm were corroded; only those with 75 mm concrete cover were not. In all other slabs the reinforcing bars were not corroded when the concrete cover depth was 25 mm or deeper, however the half-cell potential readings indicate corrosion of all reinforcing steel bars with a 13 mm concrete cover depth, except for slab N2. As expected it is clearly shown that high concrete covers depth (>13 mm) can significantly delay the ingress of chlorides into the concrete/steel interface region.
The half-cell potential readings for the 13 mm concrete cover depth, varied widely
from slab to slab (Figure 3),which made it possible to compare the performance of different
types of concretes. The potentials for concrete slabs N1, N6 and N5 shifted into the most negative range in 2002, while N2 (concrete containing FA-C) maintained the most positive
values. The potentials for concrete slab N8 were quite negative between 1999 and 2001 but shifted back to around –320 mV vs. SCE.
Table 4 lists the detailed probability of corrosion for all reinforcing steel bars embedded in the concrete slabs (including control slabs and PCC with different w/c ratios) with different thickness of concrete covers evaluated in September 2002 by half-cell potential according to the ASTM guideline C876. It clearly shows that the concrete slab N2, i.e. the concrete slab with high volume FA-C had the best performance, followed by slab N7 with concrete containing 10% SF and the control slab N3 (w/c = 0.32). The concrete slab N1 with high volume FA-F and N8 with concrete incorporating 55% ground granulated BFS had a relatively poor performance compared to the control slab N3. The concrete slabs N5 and N6 (normal PCC with w/c ratio of 0.43 and 0.55, respectively) had the poorest performance.
Corrosion Current Measurements by Linear Polarization
Figure 4 shows that the corrosion current density obtained by the linear polarization technique. The corrosion current densities (average of two steel reinforcing bars) were plotted vs. increasing cover depth for the concrete slabs containing SCM and the control slab (w/c = 0.32). When the thickness of concrete cover was 25 mm or thicker
the corrosion current densities of reinforcing steel bars were all smaller than 0.1 µA cm-2
indicating they were still in the passive condition. However, the difference in the corrosion current densities on the reinforcing steel bars with 13 mm concrete cover is quite significant so that the performance of these slabs can be easily identified. It is clearly shown that the concrete slab N2 (FA-C) had the best performance, while the concrete slabs N8 (BFS) and N1 (FA-F) had a relatively poor performance. The results from slabs N5 and N6 were not shown in figures 4 and 5 since their current densities were very high on reinforcing bars for all concrete cover depths except slab N5 with 75 mm concrete cover (see Table 5).
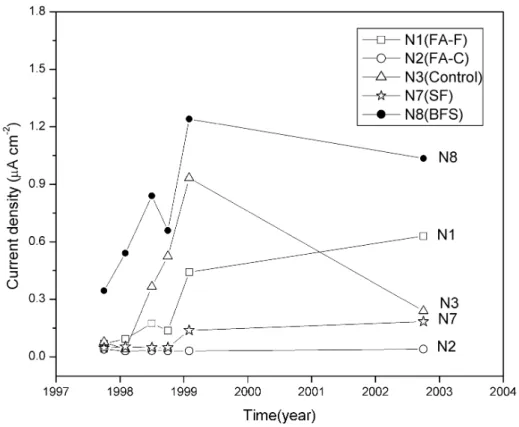
Figure 5 illustrates the corrosion current density change with time on the reinforcing steel bars with a 13 mm concrete cover. These measurements were carried out for up to 5.3 years of 3.4% NaCl solution ponding. It can be seen that the corrosion current density started to increase from 1997 and remained the highest for the slab N8. The current density increased in the beginning of 1998 and became the second highest, then reduced in 2002 for the slab N3 (control slab). The current density for slab N2 remained very low, while for the slab N7 the current density had a slight increase in 1999, and then remained at relative low values.
Table 5 summarizes the corrosion state of reinforcing steel bars embedded in all the slabs (including control slab and slabs containing PCC with different w/c ratios) evaluated by the linear polarization method in September 2002. It shows clearly that the concrete slab N2 had the best performance followed by slab N7. Although slab N3 had the same corrosion state as slab N7 based on the criteria listed in Table 3, the current density was higher and thus it ranked third. The slabs N8 and N1 had relatively poor performance. The slabs N5 and N6 had the worst performance.
Corrosion Current Measurements by AC Impedance
To interpret the AC impedance spectra, an equivalent circuit fitting procedure is commonly used. The complexity of the reinforced concrete system makes this approach difficult. Sometimes different models have to be tested to obtain the best fit and also have
physical meaning for the metal/concrete interface.19-21
It is generally accepted that the physical model of the steel/concrete interface consists of a layer of iron oxides and hydroxides film in the passive stage and an interfacial film
adjoined to the concrete matrix.20-22 Many equivalent circuits have been proposed to describe
the different stages of the steel/concrete corrosion process including active, and passive corrosion processes involving diffusion control, passive film formation and macro-cell corrosion etc.21,23-25
The corrosion current for reinforcing steel in concrete slabs was obtained using the
AC impedance technique. The values of the polarization resistance, Rp, and the concrete
resistance, Rc, were obtained by the “best-fit” of the experimental impedance spectra using
one of the equivalent circuits shown in Figure 6. Two types of equivalent circuits were used in this work. A simple equivalent circuit (circuit A) was used in most of the analyses. In this
equivalent circuit, a pure resistor, represent ohmic resistance (Rc), is in series with a parallel
combination of a resistor (polarization resistance, Rp) and a frequency dependent double layer
capacitor (Cdl). The latter, also called a constant phase element (CPE)26,27 is introduced to
account for a depressed semicircle on complex plot. A modified equivalent circuit (circuit B)
was also used in this study. This equivalent circuit consisted of a resistor (Rc) in series with
two parallel combinations of a resistor and a CPE, Ri with Ci and RP with Cdl. These RC
parameters are defined as follows:
• Rc: the concrete resistance;
• R i and CI: steel/concrete interface film resistance and capacitance; and
The complex-plane and Bode phase-angle plots of AC impedance measurement data (symbols) and fitting results (solid line) for reinforcing steel bars embedded in the concrete
slabs containing SCM and the control slabs are shown in Figure 7. The fitted value of Rp
represents the overall condition of the steel surface corrosion and does not identify the passive or active corrosion areas even though the latter has the major contribution to the measured
Rp.28 The value of Rp was used to calculate the corrosion rate based on the Stern-Geary
relation (equation 3) and a “B” value of 26 mV was applied. The value of Rc was used to
correct the iR drop in the linear polarization measurement.
The relation of corrosion current density of reinforcing steel bars versus concrete cover (after 5.3 years ponding with chloride solution) are plotted in Figure 8. The reinforcing steel bars with a 25 mm concrete cover or thicker in all slabs had a very small corrosion
current density (< 0.1 µA cm-2). Higher corrosion current densities were observed for most
concrete slabs with 13 mm concrete cover (Icorr vary from 0.18 µA cm-2 for slab N7 to 0.22
µA cm-2 for control slab N1) except the concrete slab N2 in which the current density
remained very low. The best-fit approach to the AC impedance results for slab N8 was
unsuccessful but a larger Icorr was estimated. The results for slabs N5 and N6 were not shown
in this figure since their values were much larger than all others.
The corrosion rates evaluated by the AC impedance method were also analyzed using the criteria listed in Table 2, as shown in Table 6. It is clearly shown in Table 6 that the slab N2 with FA-C had the best performance followed by the slabs N7 (SF), N1 (FA-F) and N3 (the control slab). Although the slab N7 had the same corrosion state as slabs N3 and N1 (Table 6) the current density obtained on slab N7 was lower than the other two slabs (Figure 8). Therefore slab N7 had the number 2 performance ranking. The difference in the current density between slabs N3 and N1 was so small that both these slabs were ranked as 3. Slab N8 had relatively poor performance, but as expected, the worst performances were these of slabs N5 and N6.
Overall Performance Ranking of Concrete Slabs
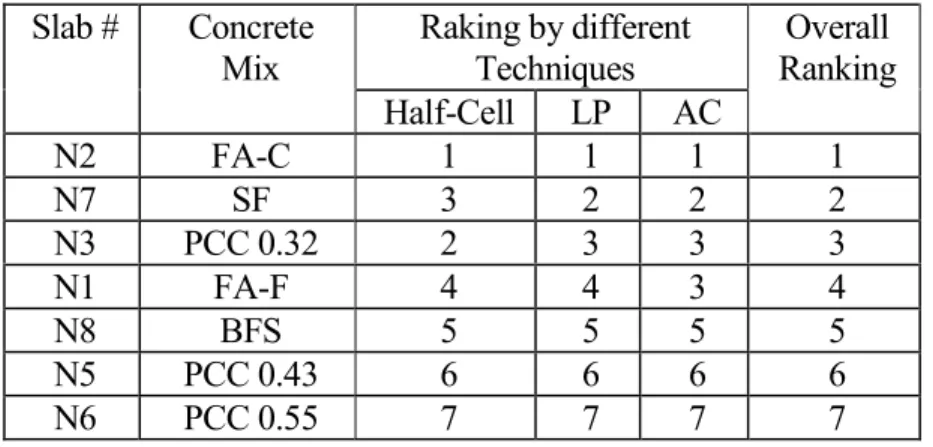
The performance ranking of the different concrete slabs tested using the half-cell potential, linear polarization and AC impedance techniques are listed in the Table 7. It can be seen that they are in very good agreement. It should be noted that the difference between slabs N3 and N7 with respect to corrosion is very small. Based on the fact that the lower corrosion current density was obtained on slab N7 by both linear polarization and AC impedance techniques, the ranking 2 was given to slab N7. The slab N2 (high volume FA-C)
with respect to the reinforcing steel corrosion. The slabs N1 and N8 were ranked number 4 and 5 having a relatively poor performance. The slabs N5 and N6 (PCC with w/c = 0.43 and 0.55, respectively) ranked number 6 and 7 since they had the worst performance.
A comparison of the values of corrosion current densities measured by the linear polarization and AC impedance techniques is presented in Figure 9 as a log-log plot. A solid line represents the best-fit by the linear regression method showing a linear relationship between the two techniques. Figure 9 shows that both measurements are in relatively good agreement, especially when the rebars are in the active condition with relatively high corrosion current densities. It is also shown that, when the rebars are in a passive state with a low corrosion rate, the values of corrosion current density obtained from the AC impedance method are lower than those obtained from the linear polarization method.
SUMMARY AND CONCLUSIONS
The corrosion of reinforcing steel bars embedded in the concrete slabs containing supplementary cementitious materials was investigated by half-cell potential, linear polarization and AC impedance techniques. The performance of concrete slabs with different concrete mixes and concrete cover depths in delaying corrosion of reinforcing steel bars was evaluated after 5.3 years of ponding with a 3.4% NaCl solution. Their performance was compared to normal Portland cement concrete and concrete slabs with high water cement (w/c) ratios. The results obtained by these different techniques were in very good agreement. The results of this investigation can be summarized as follows:
• The concrete slab N2 (containing high volume fly ash class C) had the best performance.
The corrosion of the reinforcing steel bars was initiated only on the steel bars with 13 mm concrete cover and the corrosion rate was lower than that obtained in the control slab N3 (w/c = 0.32).
• The concrete slab N7 (concrete containing 10% silica fume) provided the second best
performance. The corrosion rate of the reinforcing steel bars with 13 mm concrete cover depth was still relatively low.
• The control slab N3 (normal Portland cement concrete, w/c ratio = 0.32) also had a
good performance, and was ranked 3. The corrosion state was similar to slab N7 but the corrosion rate was not as low as in slab N7.
• The concrete slabs N1 and N8 had relatively poor performance when compared to the
control slab with lower w/c. The corrosion of the reinforcing steel bars with a 13 mm concrete cover depth was in the moderate to high corrosion state, but the reinforcing steel
bars with thicker concrete covers were still in the passive condition, according to the measured corrosion rates.
• The corrosion of reinforcing steel bars embedded in Portland cement concretes with
high water/cement ratios (w/c = 0.43 and 0.55) was significant. Substantial corrosion of the reinforcing steel bars was found in slab N5 (w/c = 0.43) with a 50 mm cover and in slab N6 (w/c = 0.55), even with a 75 mm concrete cover.
• As expected thick concrete covers were effective in delaying and reducing chloride
induced corrosion, when high performance concretes such as high volume fly ash class C, concrete containing 10% silica fume and Portland cement concrete with a w/c of 0.32 were used.
ACKNOWLEDGEMENT
Grateful acknowledgement is made to the Canada Center for Mineral and Energy Technology (CANMET) of Natural Resources Canada for the financial support of this project.
REFERENCES
1. Malhotra, V.M. and Mehta P.K., “Pozzolanic and Cementitious Materials”, Advance in
Concrete Technology Vol.1, Gordon and Breach Publishers, Canada, 1996.
2. Bilodeau, A., Sivasundaram, V., Painter, K.E. and Malhotra, V.M. “Durability of
concrete incorporating high-volume fly ash from sources in the U.S.”, ACI Materials Journal, V.91 No.1, 1994, pp.3-12.
3. Sivasundaram, V., Garette, G.G. and Malhotra, V.M., “Long-term strength development
of high-volume fly ash concrete”, Cement & Concrete Composites, 12, 1990, pp. 263-270.
4. Feldman, R.F., Garette, G.G. and Malhotra, V.M., “Studies on mechanism of
development of physical and mechanical properties of high-volume fly ash cement pastes”, Cement & Concrete Composites, 12, 1990, pp. 245-251.
5. Berry, E.E., Hemmings and Cornelius, B.J., “Mechanisms of hydration reactions in high
volume fly ash pastes and mortars”, Cement & Concrete Composites, 12, 1990, pp. 253-261.
6. Malhotra, V.M. and Sivasundaram, V., “Fly ash in Concrete”, Natural Resources
7. ASTM C876-99 Standard Test Method for Half-Cell Potentials of Reinforcement in Concrete, ASTM, Philadelphia, 1999.
8. Stratfull R. F., “Half-cell potentials and the corrosion of steel in concrete”, Highway
Research Record, 1973, p. 433.
9. Broomfield, J., Davies K. and Hladky, K., “The use of permanent corrosion monitoring
in new and existing reinforced concrete structures”, Cement and Concrete Composites 24, 2002, p. 27-34.
10. Alonso, C. Andrade, C. and González, J. A., “Relation between resistivity and corrosion rate of reinforcements in carbonated mortar made with several cement types”, Cement and concrete Research, 18, 1988, p. 687-698.
11. Gu, P., Beaudoin, J.J., Baldock, B., “Corrosion Resistance of Reinforcing Steel in Cemetitious Concrete exposed to Chloride Solution,” NACE Northern Area Eastern Conference and Exhibiton, October 24 – 27, 1999, paper 9B.1.
12. Gu, P., Beaudoin, J.J., Zhang, M.H., Malhotra, V.M., "Performance of steel
reinforcement in portland cement and high-volume fly ash concretes exposed to chloride solution," ACI Materials Journal, 96, (5), Sept-Oct., 1999, pp. 551-558.
13. Broomfield, J., Davies, K., and Hladky, K. “The use of permanent corrosion monitoring in new and existing reinforced concrete structures”, Cement and Concrete Composites 24, 2002, p. 27-34.
14. EG & G Princeton Applied Research Application Note – 140 “Linear Polarization” and Note – 148 “Tafel Plot”.
15. Andrade C. and Gonzales J. A., “Quantitative measurements of corrosion rate of reinforcing steels embedded in concrete using polarization resistance measurements”, Werkstoffe und Korrosion, Vol 29,1978, pp515-519.
16. Feliu, S., Gonzalez, J.A., and Andrade, C., “Electrochemical Methods for On-Site Determinations of Corrosion Rates of Rebars,” Techniques to Assess the Corrosion Activity of Steel Reinforced Concrete Structures, ASTM STP 1276, Neal S. Berke, Edward Escalante, Charles K., Nmai, and David Whiting Eds., American Society for Testing and Materials, 1996.
17. Elsener, B and Böhni, H., Materials Science Forum, Vol. 8, 1986, Trans Tech Publications Switzerland-UK-USA, p.363.
18. Elsener, B and Böhni, H., Proceedings, European Congress of Corrosion, 19-21Nov. 1985, Nizza, Vol. 1, p.1.
19. Hachani, L., Carpio, J., Fiaud, C., Raharinaivo, A. and Triki, E., “Steel Corrosion in Concrete Deteriorated by Chlorides and Sulphates: Electrochemical Study Using
Impedance Spectrometry and Stepping down the Current Method”, Cem. Concr. Res., 22, 1992, pp. 56-66.
20. Crentsil, K.K S., Glasser, F.P. and Irvine, J.T.S., “ Electrochemical Characteristics of Reinforced Concrete Corrosion as Determined by Impedance Spectroscopy”, British Corrosion Journal, 27, 1992, pp. 113-118.
21. Lemoine, L., Wenger, F. and Galland, J., “Study of the Corrosion of Concrete
Reinforcement by Electrochemical Impedance Measurement”, “Corrosion Rates of Steel in Concrete”, ASTM STP 1065. Edited by N.S. Berke, V. Chaker and D. Whiting, Philadelphia, PA, ASTM, 1990, pp 118-133.
22. John, D.G., Searson, P.C. and Dawson, J.L., “Use of AC Impedance Technique in Studies on Steel in Concrete in Immersed Conditions”, Br. Corrosion J., 16, 1981, pp. 102-106.
23. Alonso, M.C. and Andrade, C., “Corrosion of Steel Reinforcement in Carbonated Mortar Containing Chloride”, Advances in Cement Research 1, 1988, pp. 155-163.
24. Andrade, C., Merino, P., Novoa, X.R., Perez, M.C. and Soler, L., “Passivation of Reinforcing Steel in Concrete”, Materials Science Forum Vols.192-194, 1995, pp. 891-898.
25. Andrade, C., Maribona, I.R., Feliu, S., Gonzales, J.A. and Feliu,Jr, S., “The Effect of Macrocells between Active and Passive Areas of Steel Reinforcements”, Corrosion Science, Vol.33 (2), 1992, pp237-249.
26. Sluyters-Rehbach, M. and Sluyters, J.H., in Electroanalytical Chemistry, Vol.4, ed., A.J. Bard, Marcel Dekker, New York, 1970, pp. 1-125.
27. Cole, K.S and Cole, R.H., "Dispersion and Absorption in Dielectrics I. Alternating Current Characteristics", J. Chem. Phys., 9, 1941, pp. 341-351.
28. Gu, P., Elliott, S., Hristova, R., Beaudoin, J.J., Brousseau, R., and Baldock, B., “A study of corrosion inhibitor performance in chloride contaminated concrete by electrochemical impedance spectroscopy”, ACI Materials Journal, Vol.94, No.5, 1997, pp385-395.
Table 1. Mixture proportions of the concrete Quantities (kg/m3) Mix No. Type of SCM SCM content % W/C+ SCM W/C
Water Cement SCM Fine
agg. Coarse agg. SP∗ AEA (mL/m3) N1 N2 N3 N5 N6 N7 N8 FA-F FA-C PCC 0.32 PCC 0.43 PCC 0.55 SF BFS 58 58 -10 55 0.32 0.32 0.32 0.43 0.55 0.32 0.32 0.76 0.76 0.32 0.43 0.55 0.36 0.72 119 119 120 160 165 118 120 156 156 376 372 300 335 170 217 217 0 0 0 37 207 751 747 769 723 736 754 764 1124 1120 1150 1085 1099 1131 1146 4.0 5.0 9.1 0.5 0 8.9 10.2 403 403 457 111 60 494 866 ∗ Superplasticizer
Table 2. Guidelines for half-cell potential data interpretation
E vs. Cu/CuSO4
(ASTM C876)
E vs. Hg/Hg2Cl2
(in this study)
Corrosion Activity
> –200 mV > –128 mV 90% probability of no corrosion
–200 > E > –350 mV –128 > E > –278 mV Corrosion is uncertain
< –350 mV < –278 mV 90% probability of corrosion
Table 3. Criteria for estimating reinforcement corrosion conditions.
Corrosion Rate (µA cm –2) Extent of Corrosion
Icorr < 0.1 P : passive condition
0.1 < Icorr< 0.5 L : low to moderate corrosion
0.5 < Icorr< 1.0 M : moderate to high corrosion
Table 4. Probability of reinforcing steel corrosion evaluated for different concrete mixes and concrete cover depths from half-cell potential measurements *
Concrete Cover Depth (mm) Slab # Slab Description 13 13 25 25 51 51 76 76 Ranking N2 FA-C H L L L L L L L 1 N3 PCC 0.32 H U L L L L L L 2 N7 SF H H L L L L L L 3 N1 FA-F H H U L L L L L 4 N8 BFS H H L L L U L L 5 N5 PCC 0.43 H H H H H U L L 6 N6 PCC 0.55 H H H H H H H H 7
* L: 90% probability of no corrosion; U: Uncertain state of corrosion;
H: 90% probability of corrosion.
Table 5. Corrosion state of reinforcing steel evaluated for different concrete mixes and concrete cover depths from linear polarization **
Concrete Cover Depth (mm) Slab # Concrete mix 13 13 25 25 51 51 76 76 Ranking N2 FA-C L P P P P P P P 1 N7 SF L L P P P P P P 2 N3 PCC 0.32 L L P P P P P P 3 N1 FA-F L M P P P P P P 4 N8 BFS M H P P P P P P 5 N5 PCC 0.43 H H H H H H P P 6 N6 PCC 0.55 H H H H H H H H 7
**(P: Passive; L: Low; M: Moderate; H: High)
Table 6. Corrosion state of reinforcing steel evaluated for different concrete mixes and concrete cover depths from ac impedance **
Concrete Cover Depth (mm) Slab # Concrete Mix 13 13 25 25 51 51 76 76 Ranking N2 FA-C P P P P P P P P 1 N7 SF L L P P P P P P 2 N3 PCC 0.32 L L P P P P P P 3 N1 FA-F L L P P P P P P 3 N8 BFS M M P P P P P P 5 N5 PCC 0.43 H H M H L L P P 6 N6 PCC 0.55 H H H H H H H H 7
Table 7. Overall performance ranking with regard to corrosion of reinforcing steel bars in concrete slabs
Raking by different Techniques Slab # Concrete Mix Half-Cell LP AC Overall Ranking N2 FA-C 1 1 1 1 N7 SF 3 2 2 2 N3 PCC 0.32 2 3 3 3 N1 FA-F 4 4 3 4 N8 BFS 5 5 5 5 N5 PCC 0.43 6 6 6 6 N6 PCC 0.55 7 7 7 7
Figure 1: A schematic plot showing the reinforcing steel bars layout of the reinforced concrete test slabs.
Figure 2: Half-cell potential measurements of reinforcing steel bars embedded in concrete slabs after 5.3 years ponding with 3.4% NaCl solution.
Figure 3: Half-cell potential measurements of reinforcing steel bars embedded in concrete slabs with 13 mm concrete cover.
Figure 4: Corrosion current densities obtained by linear polarization technique on reinforcing steel bars embedded in concrete slabs after 5.3 years ponding with 3.4% NaCl solution.
Figure 5: Corrosion current densities obtained by linear polarization technique on reinforcing steel bars embedded in concrete slabs with 13 mm concrete cover.
Figure 6: Equivalent circuit used in AC impedance fitting process; A) Simple equivalent circuit; B) modified equivalent circuit.
Figure 7: Complex-plane (A) and Bode phase-angle (B) plots of AC impedance for reinforcing steel bars embedded in concrete slabs containing SCM and control slabs; The symbols represent the experimental data and the line the fitted results.
Figure 8: Corrosion current densities obtained by AC impedance technique on reinforcing steel bars embedded in concrete slabs after 5.3 years ponding with 3.4% NaCl solution.
Figure 9: Log-Log plot of corrosion current densities obtained by linear polarization and AC impedance techniques.