HAL Id: hal-02414054
https://hal.archives-ouvertes.fr/hal-02414054
Submitted on 16 Dec 2019
HAL is a multi-disciplinary open access
archive for the deposit and dissemination of
sci-entific research documents, whether they are
pub-lished or not. The documents may come from
teaching and research institutions in France or
abroad, or from public or private research centers.
L’archive ouverte pluridisciplinaire HAL, est
destinée au dépôt et à la diffusion de documents
scientifiques de niveau recherche, publiés ou non,
émanant des établissements d’enseignement et de
recherche français ou étrangers, des laboratoires
publics ou privés.
An imaging system for microbial corrosion analysis
Leonardo Iannucci, Luca Lombardo, Marco Parvis, Pierangela Cristiani,
Régine Basséguy, Emma Angelini, Sabrina Grassini
To cite this version:
Leonardo Iannucci, Luca Lombardo, Marco Parvis, Pierangela Cristiani, Régine Basséguy, et
al..
An imaging system for microbial corrosion analysis.
2019 IEEE International
Instrumen-tation & Measurement Technology Conference, May 2019, Auckland, New Zealand.
pp.1-6,
OATAO is an open access repository that collects the work of Toulouse
researchers and makes it freely available over the web where possible
Any correspondence concerning this service should be sent
to the repository administrator:
tech-oatao@listes-diff.inp-toulouse.fr
This is an author’s version published in: http://oatao.univ-toulouse.fr/25200
To cite this version:
Iannucci, Leonardo and Lombardo, Luca and Parvis, Marco and Cristiani, Pierangela
and Basséguy, Régine
and Angelini, Emma and Grassini, Sabrina An imaging
system for microbial corrosion analysis. (2019) In: 2019 IEEE International
Instrumentation & Measurement Technology Conference, 20 May 2019 - 23 May
2019 (Auckland, New Zealand).
Official URL :
https://doi.org/10.1109/I2MTC.2019.8826965
An imaging system for microbial corrosion analysis
Leonardo Iannucci Luca Lombardo
Marco Parvis
Dipartimento di Elettronica e Telecomunicazioni Politecnico di Torino
Torino, ITALY
Email: leonardo.iannucci@polito.it
R´egine Bass´eguy
Laboratoire de G´enie Chimique Universit´e de Toulouse, CNRS
Toulouse, FRANCE Email: regine.basseguy@ensiacet.fr
Pierangela Cristiani
Ricerca sul Sistema Energetico – RSE SpA Milano, ITALY
Email: pierangela.cristiani@rse-web.it
Emma Angelini Sabrina Grassini
Dipartimento di di Scienza Applicata e Tecnologia Politecnico di Torino
Torino, ITALY
Email: sabrina.grassini@polito.it
Abstract—This paper describes a viable and self-contained imaging system able to assess and quantify the effects of microbial corrosion on metals surface. The proposed image processing uses Scanning Electron Microscope micrographs to analyze bacteria attachment on sample surface and to estimate the degree of degradation of the material. After a preliminary brightness and contrast normalization, which refines the image taken by the operator, the software is able to identify dark spots on the clear metal surface. These are then attributed to singly attached bacteria or to larger clusters, which are the most dangerous ones, as they could overlay corrosion pits. After that, the degradation of the material is evaluated through the quantification of microbial attachment on the surface and through dimensional distribution of bacteria clusters.
Index Terms—Microbial Corrosion, Image Processing, Im-plants, Scanning Electron Microscopy
I. INTRODUCTION
Prosthesis implantation is a surgical operation in which the choice of material is an issue of paramount importance. The interaction between a material (especially in case of metal alloys) and the body fluids can lead to corrosion phenomena that, in the most serious cases, can cause the failure of the implant. A particularly severe degradation is due to microbial corrosion, in which bacteria catalyze metal oxidation, signifi-cantly increasing the corrosion rate.
Since corrosion is an electrochemical reaction, electrochem-ical techniques are generally the most effective in the study of material-environment interaction and of corrosion mechanisms [1]. In the field of biomaterials, Electrochemical Impedance Spectroscopy, monitoring of open circuit potential, polariza-tion curves and other tradipolariza-tional electrochemical measurements are routinely employed to assess the corrosion behavior of different metals and alloys when in contact with electrolytic solutions that simulate the aggressiveness of body fluids. However, most of them can’t be considered as stand-alone techniques, as they must be coupled to each other or to other
chemico-physical characterization techniques such as optical and electron microscopy, in order to investigate the mechanism and the morphology of the corrosion reactions occurring on the metallic surface. From this considerations, the necessity to develop easy-to-use solutions able to quantitative evaluate the extent of the degradation phenomenon occurred on the material surface arises.
Many are the possible approaches related to imaging anal-ysis when microbial corrosion (MIC) is concerned. In partic-ular, these methods can be classified taking in account the technique used for image collection or the main purpose of the investigation (corrosion assessment or biofilm growth). When surface morphology is the main concern, often stereo-microscope, reflected light microscopy and SEM (Scanning Electron Microscopy) are used [2]–[5]. In order to have a more accurate 3D reconstruction of the surface, white light interfer-ometry or Fourier Transform Profilinterfer-ometry can be employed, so as to detect pit formation [6], [7]. Main advantages of these techniques are related to the easy way in which corrosion pits can be detected and quantified (e.g. through parameters such as the pit density); drawbacks are related to the detection of biofilm and attached bacteria, as magnification is too low. On the other hand, to have the best morphological characterization of the biofilm, CLSM (Confocal Laser Scanning Microscope) is generally used [8]–[13]. This allows to have quantitative information about biofilm coverage and also its 3D structure, providing important information to researchers in biology. Main limitation is that sample preparation requires staining techniques, that are not always available in material science laboratories.
Aim of this research work is to develop a simple and fast imaging system able to quantitatively estimate the microbial corrosion effects and the biofilm growth on metallic specimens subjected to MIC laboratory tests. Imaging based systems have been employed in several fields [14]–[16] mainly thanks to
their limited cost and non invasiveness [17]–[19].
The proposed approach is based on the processing of sur-face micrographs collected by means of a Scanning Electron Microscope (SEM), which provides a sufficient resolution at high magnification to examine bacteria attachment, even in case of low biofilm coverage. Electron microscopy is a traditional characterization technique routinely used in all material science laboratories, so it does not require additional equipment or skills. The system is based on the open-source openCV library, which can count many applications in the identification of specific objects present in images [20], [21]. After a preliminary processing of the image, which is described in section II, the software is able to identify bac-teria aggregates that are present on the sample (section III). Obtained results are finally presented and discussed in section IV.
II. IMAGEPROCESSING
A. Image acquisition
To assess the microbial corrosion effects and the bacteria growth onto the metal, surface images are collected by means of a Field Emission Scanning Electron Microscope (FESEM - Supra 40 Zeiss). Fig. 1 shows, as an example, a FESEM image of a metallic specimen after a microbial corrosion test carried out in an electrolytic solution added by an inoculum containing a wide variety of bacteria; after 200 h of expo-sure to the MIC test a flat surface on which some bacteria agglomerates, highlighted as dark areas are present, can be observed. The image magnification is selected by the operator and automatically computed by the microscope; magnification can range from few nanometers per pixel to several tens of micrometers per pixel, while the image dimension can be 2000 × 1500 pixels. Since the expected microorganisms have dimensions in the range of 2 µm to 15 µm, a resolution of the order of0.2 µm/pixel can be conveniently used; therefore, the analyzed area is of the order of400 µm × 300 µm. This value has been used in all the images processed in this paper.
Fig. 1. FESEM image of a metallic surface affected by microbial corrosion.
B. Image brightness and contrast normalization
In addition to magnification and pixel size, the operator selects also the images brightness and contrast in order to obtain the best visualization of bacteria aggregates and localized corrosion attacks (pits). Setting these parameters is a critical operation, which makes any automatic image processing difficult to be applied.
In addition, the image brightness can change over the scanned surface because of the different topography and roughness and as a consequences of charging effects occurring when the electron beam hits non conductive species (bacteria aggregates). The low voltages used by the field emission microscope and the efficiency of its detector greatly help to reduce the charging effects making them almost negligible. However, brightness can still significantly change due to the different surface morphology in the different areas (i. e. different positions) of the scanned image [19].
Therefore, an image normalization has to be performed in order to obtain FESEM images whose contrast and brightness are reasonably independent from the operator; this processing involves three steps:
1) Estimation of brightness changes due to the different morphology of the surface area;
2) Correction of brightness changes in the different posi-tions;
3) Normalization of the image brightness to eliminate the operator setting effect.
The first step requires identifying a brightness plane whose value is described by the following equation:
B = B0+ αBXx + αBYy (1)
where B is the brightness of the metallic surface area not interested by microbial corrosion,B0is the average brightness
value,αBX andαBY are the brightness changes with position
coefficients, andx and y are the position coordinates. Since the samples have an average brightness which is almost constant in the absence of corrosion, the identification of the brightness average value could be easily performed if one is able to find on the image the areas not affected by corrosion, i.e. in the case of the described images, areas not affected by bacteria growth. Such a manual selection can be avoided in most cases since the area covered by the bacteria is usually limited with respect to the total scanned metallic surface, so that a the image brightness as a function of the coordinates can be easily estimated by solving in the Least Square sense the matrix equation:
B= U · λ (2) where B is the column vector of all pixel brightness, U is nP ix × 3 matrix in which is row is [1, x, y] accounts for the position of each line in the B vector andλ = [B0, αBX, αBY]′
is the vector containing the sensitivities whose estimation is referred toˆλ.
Of course the actual estimated brightness values depend on the way the images are acquired, i.e. on the FESEM operator; however, tests performed on several images with average brightness in the range of140 to 220 out of a maximum value of 255 led to position coefficients whose maximum value is of the order of 9 · 10−3 on x axis and of 3 · 10−2 on the y
axis. This leads to maximum brightness changes of the order of 40 units out of 255 units.
The second pre-processing step, onceˆλ has been estimated, can be simply obtained by computing the corrected brightness Bc as:
Bc=
B
1 + αBXx + αBYy
(3) obtaining therefore an image whose brightness is no longer affected by brightness changes in the different surface areas.
The third step can be obtained simply by changing image contrast by modifying the brightness values, so that they covers all the available gray levels. In order to avoid a normalization affected by the presence of few abnormal white and black spots, the image brightness BminandBmax can be obtained
by: Bmin= X pixelnumber Pxy : Bp< Bmin; kPtot (4) Bmax= X pixelnumber Pxy : Bp> Bmax; kPtot (5)
wherePxy is the generic pixel,Ptotis the number of pixels in
the image and k is the coefficient usually in the range of 5% to 10%, which is used to define the number of pixes shown as black and white.
Once Bmin and Bmax have been estimated, the image
brightness can be normalized as:
Bs= 0, ifB ≤ Bmin
(B − Bmin)BmaxM−Bmin, ifBmin< B < Bmax
M axB, ifB ≥ Bmax
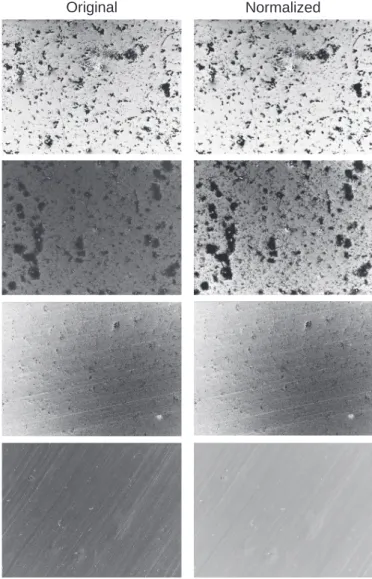
(6) where M axB is the maximum brightness value of the image. Fig. 2 shows four different examples of normalized images collected on metallic specimens which have undergone to the MIC test in different solutions. The normalized images appear to have similar brightness and contrast even though the bacteria proliferation and coverage appears to be quite different.
III. BACTERIA IDENTIFICATION
On FESEM images collected on metallic samples exposed to MIC test, bacteria appear as dark areas whose dimension ranges from few squared micrometers for aggregate of few bacteria to several hundreds of micrometers for large bacteria aggregate.
The identification of the bacteria aggregates has been per-formed by using the OpenCV opensource environment [22],
Fig. 2. Example of results of the normalization process on images with different brightness, contrast, and bacteria coverage.
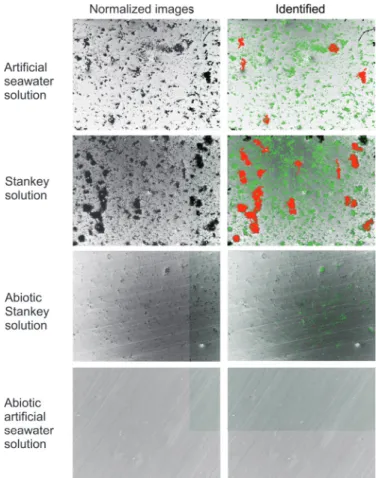
[23] by using the findContour function set to identify dark spots. This function returns a list of contours which can be easily shown on the FESEM image as it possible to observe in fig. 3. The figure shows normalized and identified images collected on four metallic specimens immersed in different solutions. Two of the images (Artificial seawater and Stankey solution) refer to samples immersed in solutions containing the inoculum and therefore rich of bacteria, the other two (Abiotic artificial seawater and Abiotic Stankey solution) refer to samples immersed in solutions having the same chemical composition but without the presence of bacteria.
In the identified images, as an example, a green contour has been used to flag aggregates with size of less than 200 µm2
while a red contour has been used to flag bigger aggregates with size above200 µm2
Fig. 3. Example of results of the identification process where in green are shown bacteria clusters with size below200 µm2
and in red cluster of bacteria above such value. Four examples are shown: in two cases samples were immersed in solution containing bacteria, and in the other two without bacteria. The corrosion difference is immediately visible
IV. RESULTS
After a microbial corrosion test, FESEM characterization provides morphological information about biofilm growth and corrosion attacks onto the specimen surface.
Depending on the material and on the electrolytic solution employed in the MIC test, a different amount of microorgan-isms singly attached or agglomerated in big clusters can be found. So important information can be gathered by means of an imaging analysis able to quantitatively estimate the amount of bacteria grown on the metallic surface as a function of the aggressiveness of the MIC test; therefore the imaging approach could be very useful to compare the behaviors of different metals and alloys exposed to MIC and to put in evidence also the different aggressiveness of bacteria inocula.
In order to validate the proposed image processing, two standard microbial corrosion tests have been carried out, by immersing stainless steel specimens (AISI304, composition in table I) in two different electrolytic solutions. AISI 304 Stainless Steel is an alloy basically employed in biomedical applications, such as orthopedic implants. The specimens have been immersed in two electrolytic solutions, the Stankey medium and artificial seawater (solutions composition are
reported in table I). The former is a classic growth medium for bacteria, containing mainly sulphates and chlorides ions; the latter has a more complex composition simulating marine environment (also a favorable solution for microorganisms proliferation) and has been chosen in order to obtain a different corrosion morphology affecting the metallic surface after the test and compare it through the image analysis. Salt marsh sediments have been used as inoculum for the two solutions (it was added in the concentration of 10 vol%).
TABLE I
MATERIAL ANDELECTROLYTICSOLUTIONCOMPOSITION Material Chemical Composition [wt%] AISI 304 Cr 18, Ni 10, Mn 2, Si 1, C 0.7 Electrolytic Solution Concentration [g/L]
Stankey Medium K2HP O4 0.50, N H4Cl 1.00,
N a2SO4 1.00, CaCl22H2O 0.100,
M gSO47H2O 2.00, N aCl 24.53,
CH3COON a 3.00
Artificial Seawater N aCl 24.53, M gCl2 5.20, N a2SO4
4.09, CaCl2 1.16, KCl 0.695,
N aHCO3 0.201, KBr 0.101,
H3BO3 0.027, SrCl2 0.025, N aF
0.003, CH3COON a 3.00
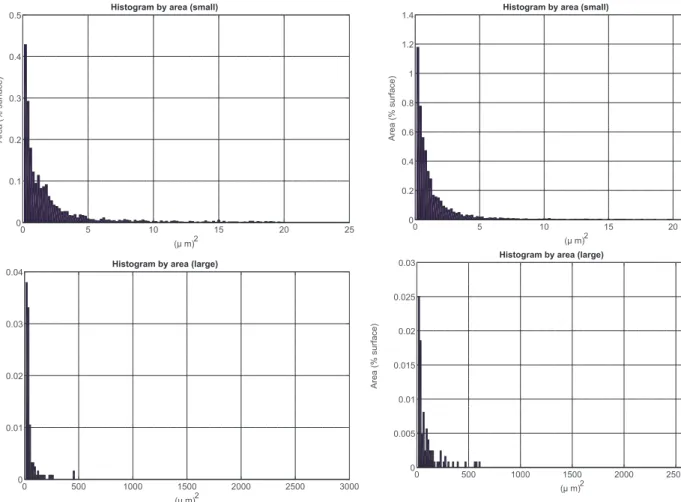
Results from dimensional distribution of microorganism are shown in fig. 4 and 5 as histograms for the samples immersed respectively in artificial seawater and Stankey medium. Data have been divided into two plots, one collecting single bacteria or small aggregates (having area up to 20 µm2
) and the other one grouping larger ones (until 3000 µm2
). Different information can be gathered arranging data in this way, as smaller objects provide indications about bacteria attachment, while bigger ones can be considered the most dangerous as far as microbial corrosion is concerned. Actually, they could generate preferential sites for pitting formation, as they create areas of differential aeration or where corrosive compounds (such as chlorides ions) can accumulate or pH changes can occurs; so identifying and quantifying them is an important point to assess the microbial corrosion behavior of the metallic specimen.
As can be seen in fig. 3, the software is able to correctly identify almost all microorganisms present on the sample. Main limitations are due to agglomerates which lie near the edges of the image, as their contour can’t be determined by the findContouralgorithm. In virtually all other cases, bacteria are identified and labeled according to their dimension. Thus, analyzing data from the histograms, it is possible to recognize the different morphologies of the two samples. Immersion in artificial seawater lead to a condition in which bacteria are singularly and randomly attached on the surface with only few bigger agglomerates, which can be recognized in the histogram ranging until 3000 µm2
. On the other hand, immersion in Stankey solution induced the formation of a higher number of bigger aggregates (area above20 µm2
TABLE II
RESULTS OBTAINED FOR SAMPLES IMMERSED INARTIFICIAL SEAWATER,INSTANKEY SOLUTION AND INABIOTICSTANKEY SOLUTION. Electrolytic Solution Number of Small aggl. Total Surface of small aggl. (µm)2 Average surface (µm)2 Percentage of covered surface Number of Large aggl. Total Surface of large aggl. (µm)2 Average surface (µm)2 Percentage of covered surface Artificial seawater 6660 11000 1.6 8.7 5 1640 380 1.3 Stankey 16400 15700 0.9 12.5 16 8000 500 6.3 Abiotic Stankey 20300 3800 4.5 2.9 - - -
-Fig. 4. Histograms showing dimensional distribution (expressed as agglom-erate area) as a function of the covered surface percentage for the samples immersed in artificial seawater.
quantified through their density:
aggregates density = number of aggregates surf ace area (7) This parameter has been found equal to 41.7 mm−2
for sample immersed in artificial seawater and equal to 133.3 mm−2 for the sample immersed in Stankey solution,
Fig. 5. Histograms showing dimensional distribution (expressed as agglom-erate area) as a function of the covered surface percentage for the samples immersed in the Stankey solution.
providing an important additional clue for the material char-acterization. Such values have been calculated dividing the total number of bigger aggregates (reported in table II) by the micrograph area (expressed as mm−2)
Finally, another useful parameter that can be derived from the image processing is the biofilm coverage, defined as:
biof ilm coverage = pixel covered by bacteria
Its value has been calculated for the two samples, resulting 10.0 % for the test in artificial seawater and 18.8 % for the test in Stankey medium. Table II summarizes further data that can be gained from the processing, such as: number of aggregates (distinguished according to the size), their total surface, the average surface of aggregates and the percentage of covered surface (from which the biofilm coverage can be calculated). As a further analysis, analogous corrosion tests have been carried out in sterile conditions (using the same electrolytic so-lutions and material). In this case of course no microorganisms were present, but information about pitting corrosion could be gained through the image processing. Same magnification was used to collect micrographs and results from contour identification are presented in fig. 3. In the case of Stankey solution, the sample revealed initial hints of degradation, properly detected and classified by the software. On the other hand, for the artificial seawater sample no signs of corrosion could be found, as clearly visible from the FESEM micrograph and then from the histogram.
Obtained results have been summarized in table II.
V. CONCLUSIONS
A novel imaging system has been proposed for bacteria identification after microbial corrosion test. The processing, based on OpenCV environment, is able to quantify microbial attachment on specimen surface, providing to researchers important information about material degradation, such as biofilm coverage, aggregates density and bacteria dimensional distribution. Results obtained from the software have been pre-sented, showing the effectiveness in bacteria identification and the main information that can be derived from the processing.
REFERENCES
[1] L. Iannucci, M. Parvis, E. Di Francia, S. Grassini, ”iHomeX: An Internet-Enabled Laboratory for Long-Term Experiment Management”, IEEE Transactions on Instrumentation and Measurement, vol 67, no. 5, pp. 1142-1149, 2018.
[2] S. Caines, F. Khan, J. Shirokoff, ”Analysis of pitting corrosion on steel under insulation in marine environments”, Journal of Loss Prevention in the Process Industries, vol. 26, pp. 1466–1483, 2013.
[3] E.N. Codaro, R.Z. Nakazato, A.L. Horovistiz, L.M.F. Ribeiro, R.B. Ribeiro, L.R.O. Hein, ”An image processing method for morphology characterization and pitting corrosion evaluation”, Materials Science and Engineering A, vol. 334, pp. 298–3065, 2001.
[4] S. Caines, F. Khan, J. Shirokoff, ”An image analysis study of pit formation on Ti-6Al-4V”, Materials Science and Engineering A, vol. 341, pp. 202–1483, 2003.
[5] M. C. Pereira, J. W. J. Silva, H. A. Acciari, E. N. Codaro, L. R. O. Hein, ”Morphology Characterization and Kinetics Evaluation of Pitting Corrosion of Commercially Pure Aluminium by Digital Image Analysis”, Materials Sciences and Applications, vol. 3, pp. 287–293, 2012.
[6] B. Holme, O. Lunder, ”Characterisation of pitting corrosion by white light interferometry”, Corrosion Science, vol. 49, pp. 391–401, 2007. [7] P. R. Jang, R. Arunkumar, J. S. Lindner, ”Evaluation of aluminium pit
corrosion in Oak Ridge research reactor pool by quantitative imaging and thermodynamic modeling”, Proceedings of the 11th International ICEM Conference, 2007.
[8] H. Li, E. Zhou, D. Zhang, D. Xu, J. Xia, C. Yang, H. Feng, Z. Jiang, X. Li, T. Gu, K. Yang, ”Microbiologically Influenced Corrosion of 2707 Hyper-Duplex Stainless Steel by Marine Pseudomonas aeruginosa Biofilm”, Sci. Rep., vol. 6, pp. 1–12, 2016.
[9] J. Mystkowska, J. A. Ferreira, K. Leszczynska, S. Chmielewska, J. R. Dabrowski, P. Wiecinski, K. J. Kurzydlowski, ”Biocorrosion of 316LV steel used in oral cavity due to Desulfotomaculum nigrificans bacteria”, JOURNAL OF BIOMEDICAL MATERIALS RESEARCH B: APPLIED BIOMATERIALS, vol. 105B, pp. 391–401, 2017. [10] A. Heydorn, A. T. Nielsen, M. Hentzer, C. Sternberg, M. Givskov, B.
K. Ersboll, S. Molin, ”Quantification of biofilm structures by the novel computer program COMSTAT”, Microbiology, vol. 146, pp. 2395–2407, 2000.
[11] L. Karygianni, M. Follo, E. Hellwig, D. Burghardt, M. Wolkewitz, A. Anderson, A. Al-Ahmad, ”Microscope-Based Imaging Platform for Large-Scale Analysis of Oral Biofilms”, Applied and Environmental Microbiology, vol. 78, n. 24, pp. 8703–8711, 2012.
[12] K. M. Thormann, R. M. Saville, S. Shukla, D. A. Pelletier, A. M. Spormann, ”Initial Phases of Biofilm Formation in Shewanella onei-densis MR-1”, JOURNAL OF BACTERIOLOGY, vol. 186, n. 23, pp. 8096–8104, 2004.
[13] C. Hannig, M. Follo, E. Hellwig, A. Al-Ahmad, ”Visualization of ad-herent micro-organisms using different techniques”, Journal of Medical Microbiology, vol. 59, pp. 1–7, 2010.
[14] S. Delsanto, F. Molinari, P. Giustetto, W. Liboni, S. Badalamenti, J. S. Suri, ”Characterization of a Completely User-Independent Algorithm for Carotid Artery Segmentation in 2-D Ultrasound Images”, IEEE Transactions on Instrumentation and Measurement, Vol. 56 , no 4, pp. 1265 - 1274, 2007
[15] Q. Li, S. Ren, ”A Real-Time Visual Inspection System for Discrete Surface Defects of Rail Heads” IEEE Transactions on Instrumentation and Measurement, Vol. 61 , no 8, pp2189 - 2199, 2012
[16] G. Lu, Y. Yan, M. Colechin, ”A digital imaging based multifunctional flame monitoring system”, IEEE Transactions on Instrumentation and Measurement, Vol. 53 , no 4, pp. 1152 - 1158, 2004
[17] S. Corbellini, F. Ferraris, A. Neri, M. Parvis, E. Angelini, S. Grassini, ”Exposure-Tolerant Imaging Solution for Cultural Heritage Monitoring”, IEEE TRANSACTIONS ON INSTRUMENTATION AND MEASURE-MENT, vol. 60, no. 5, pp. 1691–1698, May 2011.
[18] E. Angelini, S. Grassini, D. Mombello, A. Neri, M. Parvis, ”An imaging approach for a contactless monitoring of the conservation state of metallic works of art”, Applied Physics A, vol. 100, pp. 919–925, 2010. [19] S. Grassini, R. Pisano, A.A. Barresi, E. Angelini, M. Parvis, ”Frequency domain image analysis for the characterization of porous products”, MEASUREMENT. Vol 94, pp. 515-522, 2016
[20] L. Lombardo, M. Parvis, E. Angelini, S. Grassini, ”Optical solution for particulate distribution estimation”, 2018 IEEE International Instru-mentation and Measurement Technology Conference (I2MTC), Houston, TX, 2018, pp. 1-6.
[21] Q. Li, X. Chen, H. Zhang, L. Yin, S. Chen, T. Wang, S. Lin, X. Liu, X. Zhang, R. Zhang, ”Automatic Human Spermatozoa Detection in Microscopic Video Streams Based On OpenCV”, 2012 5th International Conference on BioMedical Engineering and Informatics, Chongqing, 2012, pp. 224-227.
[22] Alex Zelinsky ”Learning OpenCV—Computer Vision with the OpenCV Library”, IEEE Robotics & Automation Magazine, Vol. 16, no. 3, pp. 100, 2009
[23] Bradski, G., ”The OpenCV Library”, Dr. Dobb’s Journal of Software Tools, 2000, available at https://github.com/opencv/opencv, last checked on Nov. 3rd, 2018