HAL Id: hal-00707483
https://hal.archives-ouvertes.fr/hal-00707483
Submitted on 6 Feb 2019HAL is a multi-disciplinary open access archive for the deposit and dissemination of sci-entific research documents, whether they are pub-lished or not. The documents may come from teaching and research institutions in France or abroad, or from public or private research centers.
L’archive ouverte pluridisciplinaire HAL, est destinée au dépôt et à la diffusion de documents scientifiques de niveau recherche, publiés ou non, émanant des établissements d’enseignement et de recherche français ou étrangers, des laboratoires publics ou privés.
A novel method to include the free surface in a CFD
model of jet injection into partially-baffled mixing
vessels
Jean-Philippe Torré, Peter Higgins, Catherine Xuereb, D. F. Fletcher
To cite this version:
Jean-Philippe Torré, Peter Higgins, Catherine Xuereb, D. F. Fletcher. A novel method to include the free surface in a CFD model of jet injection into partially-baffled mixing vessels. Progress in Com-putational Fluid Dynamics, Inderscience, 2009, 9 (6/7), pp.368-374. �10.1504/PCFD.2009.027367�. �hal-00707483�
OATAO is an open access repository that collects the work of Toulouse
researchers and makes it freely available over the web where possible
Any correspondence concerning this service should be sent
to the repository administrator:
tech-oatao@listes-diff.inp-toulouse.fr
This is an author’s version published in: http://oatao.univ-toulouse.fr/21866
To cite this version:
Jean-Philippe
and Higgins, Peter and Xuereb, Catherine
and Fletcher, David F. A novel
method to include the free surface in a CFD model of jet injection into partially-baffled mixing
vessels. (2009) Progress in Computational Fluid Dynamics, An International Journ, 9 (6/7).
368-374. ISSN 1468-4349
Official URL: https://doi.org/10.1504/PCFD.2009.027367
A novel method to include the free surface in a CFD
model of jet injection into partially-baffled mixing
vessels
Jean-Philippe Torré
Université de Toulouse, Laboratoire de Génie Chimique,
6 allée Emile Monso, BP 34038, 31029 Toulouse, France School of Chemical and Biomolecular Engineering, University of Sydney,
Sydney, NSW 2006, Australia E-mail: jp_torre@hotmail.com
Peter Higgins
LEAP Australia,
Suite 6, 750 Blackburn Rd., Clayton North, VIC 3168, Australia E-mail: Peter.Higgins@leap.au.com
Catherine Xuereb
Université de Toulouse,
Laboratoire de Génie Chimique, Toulouse, France E-mail: Catherine.Xuereb@ensiacet fr
David F. Fletcher*
School of Chemical and Biomolecular Engineering, University of Sydney,
Sydney, NSW 2006, Australia E-mail: d.fletcher@usyd.edu.au *Corresponding author
Abstract: A novel methodology that can be used to perform simulations of fluid jet injection into a mixing vessel with a deformed free surface is presented and validated. The idea is to first use a two-fluid model to determine the location and shape of the free surface, and then results from the simulation are used to generate a single-phase model that has the same free surface shape. Example simulations are performed using ANSYS CFX for a pilot-scale partially-baffled vessel. Application of the methodology in the study of reaction quenching is presented but it is believed that this methodology has many other possible applications involving fluid or solid injection. Keywords: CFD; computational fluid dynamics; free surface; partially-baffled mixing vessel; quenching; jet injection; solids addition.
Reference to this paper should be made as follows: Torré, J-P., Higgins, P., Xuereb, C. and Fletcher, D.F. (2009) ‘A novel method to include the free surface in a CFD model of jet injection into partially-baffled mixing vessels’, Progress in Computational Fluid Dynamics, Vol. 9, Nos. 6/7, pp.368–374.
Biographical notes: Jean-Philippe Torré completed PhD in Chemical Engineering at the Université de Toulouse and the University of Sydney in 2007 under a cotutelle arrangement, whilst also working as an R&D engineer for Tessenderlo Group. This project involved experimental and numerical work to achieve a better understanding of the quenching of agitated batch reactors. His PhD specialisations include Computational Fluid Dynamics (CFD), fluid dynamics, process safety and mixing processes.
Peter Higgins received his BE in Aeronautical Engineering from UNSW in 1986. Following graduation, he joined the Royal Australian Navy and then in 1990 accepted a position with a defence sub-contractor specialising in depot level engineering services associated with aircraft flight control hydraulic systems. During this period, he was exposed to emerging
computational technologies for 3D design and engineering simulation. In 1997, he joined LEAP Australia, a computational engineering solution provider, as a consultant engineer and product specialist. He currently manages LEAP Australia’s Victorian operation.
Catherine Xuereb graduated from the Institut National Polytechnique de Toulouse in Chemical Engineering in 1986. She received her PhD in 1989, dealing with fluidised beds devoted to a polymerisation reaction. Joining the National Center for Scientific Research (CNRS), Catherine has developed her activity around mixing and blending in reactors and multiphase contactors. She has a wide experience of collaborations with industrial partners and equipment suppliers. In the Laboratoire de Genie Chimique, she is in charge of a team devoted to research in reactor engineering, working on experimental platforms and CFD approaches.
David F. Fletcher graduated from the University of Exeter, UK with a BSc in Mathematics in 1979 and a PhD in 1982. In 2002, he obtained a Habilitation à Diriger des Recherches from the Institut National Polytechnique de Toulouse. After graduation, he worked at the UK Atomic Energy Authority until 1993 before moving to Australia and he is now an Adjunct Professor at the University of Sydney. There, he performs research and consulting in CFD, with a particular emphasis on solving industrial problems for the minerals and process industries. He has 25 years CFD experience, much using the ANSYS CFX software package, and has published over a 140 journal papers in the broad area of CFD and its applications.
1 Introduction
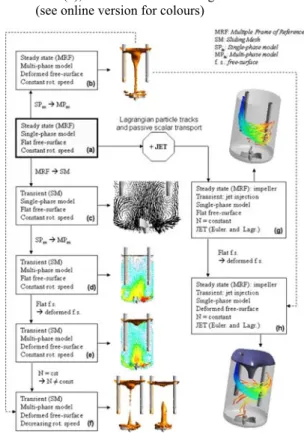
Modelling the quenching of runaway reactions in industrial vessels is complex because of the numerous physical effects that have to be included (McIntosh and Nolan, 2001). For partially-baffled vessels, this is especially the case because of the need to predict the location of the free surface, which has a very significant effect on the flow field. In a series of papers (Torré et al., 2007a, 2007b, 2007c, 2008a, 2008b) we have developed a CFD model (using the commercial software ANSYS CFX11) and validated it using pilot-scale data for the prediction of the free surface when the agitation rate is constant (Torré et al., 2007a) and during agitator slowdown (Torré et al., 2007b). We have validated the calculated velocity fields against PIV data under steady flow conditions (Torré et al., 2007c) and compared the free-surface deformation during agitator stopping with experimental video data (Torré et al., 2007b). Subsequently, we have studied the dynamics and mixing of a jet of fluid injected into the vessel when the free surface is flat (Torré et al., 2008a). Again excellent validation against experimental data was obtained and a correlation to determine the effect of the jet injection conditions on jet penetration was developed (Torré et al., 2008b). An overview of the work performed in the entire project is given in Figure 1, which shows the step-by-step methodology used.
In this paper, we introduce a novel multi-step method that allows us to first predict the free-surface shape in an initial step and then maintain this shape in a single fluid simulation whilst the fluid jet is injected and tracked. The principal motivation to create this ‘two step’ method was the difficulty of developing a simulation model which includes both the jet injection and the free-surface deformation. In addition, such a simulation would be very computationally demanding because the full model would have to solve the multiphase equation system, which allows determination of the free-surface shape, track Lagrangian particles used for determination of the jet trajectory and
solve a scalar transport equation for the concentration field. Whilst the application of interest to us was quenching of a runaway reaction, it should be noted that the procedure described here would be equally applicable to the injection of fluid into a batch reactor used for chemical reaction, addition of solids or crystallisation in vessels that have significant free-surface deformation. The remainder of this paper is devoted to a description of the methodology and the presentation of sample results validating the approach and showing its application.
Figure 1 Schematic showing the experimental and modelling work performed to study quenching of runaway reactions. The work reported in this paper concerns item (h), shown in the bottom right hand corner (see online version for colours)
2 The problem studied
As noted above, the problem studied here relates to the quenching of a runaway reaction in a polymer synthesis reactor. To generate data for validation of the modelling work performed throughout this project, a pilot plant was developed and constructed. Details of the geometry considered and the important dimensional parameters are given in Figure 2 and Table 1, respectively. For further details concerning the pilot reactor geometry and its specifications, see Torré (2007). To enable flow visualisation and for ease of observation a fluid of water was used. The scaling criteria used to determine the conditions studied took the change of fluid properties from those of the complex fluid present in the industrial system into account (for details, see Torré, 2007).
Figure 2 Schematic of the mixing tank, baffles, impeller and fluid injection system: (a) XY view of the mixing vessel; (b) YZ view of the mixing vessel; (c) details of the agitator and (d) injection system (see online version for colours)
(a) (b)
(c) (d)
Table 1 Definition of the important dimensions and geometrical parameters
Symbol Value
Tank diameter T 450 mm Maximum tank height Hmax 1156 mm
Bottom dish height Hd 122.9 mm
Agitator diameter D 260 mm Number of agitator blades nb 3
Agitator blade width wb 58 mm Agitator blade thickness tb 9 mm
Agitator retreat angle θ 15° Agitator clearance c 47.2 mm Baffle length Bl 900 mm Number of baffles nB 2
Baffle width BW 46 mm Baffle thickness Bt 27 mm
Distance baffle – shell Bƍ 38.5 mm Initial liquid height Hliq 700 mm
Injected volume Vj 533 ml Injection pipe diameter d 7.2, 10, 12.5, 15,
17.8 mm Injection pipe length L 300 mm Distance pipe outlet –
free-surface Lƍ
220 mm Bottom height of the PIV
plane
HPIV, min 278 mm
Top height of the PIV plane HPIV, max 738 mm
3 Model description
3.1 Determination of the free-surface shape
The first step in a simulation is to obtain the free-surface shape for the given reactor operating conditions. To do this, a simulation is performed using a two-fluid Eulerian methodology, as described in Torré et al. (2007a). The standard two-fluid equations for conservation of mass and momentum, taking the following form, are used: ( ) ( ) 0 p p p p p t α ρ α ρ ∂ + ∇ ⋅ = ∂ u (1) ( ) ( ) [ ( ( ) )] p p p p eff T p p p p p t p α ρ α ρ α µ α α ρ ∂ + ∇ ⋅ ⊗ = ∂ − ∇ + ∇ ⋅ ∇ + ∇ + + p p p p p ip u u u u u g M (2)
where the subscript p refers to either the gas (g) or liquid (l) phases. The standard k-İ turbulence model was used as it
was found to perform better for this application than the more computationally-expensive Reynolds stress model (Torré et al., 2007c). The equations are closed via the specification of an inter-phase drag force that determines the interaction between the two phases. The form used here is given by g l g 3 ( ) | | ( ) 4 db f CD α ρ α = − − gl g l g l M u u u u (3)
and is appropriate for a dispersed phase of gas in a liquid. The factor f(Įg) takes a value of unity when Įg is below the
maximum packing fraction and ramps linearly to zero when there is no gas present, so that it ensures that drag is only applied in regions where the two fluids are mixed. Whilst the topology of the gas and liquid phases is complex, the key feature we are trying to capture is the location of the free surface between the liquid pool and the gas above it. The interface is characterised by entrainment and disentrainment of gas bubbles that leads to a highly agitated surface (see the video images in Torré et al. (2007a)). To capture this process, we found that use of a constant drag coefficient of 0.44 and a bubble diameter of 3 mm gave good results. The effect of varying these parameters is discussed in Torré (2007). The important point is that this model allows sufficient slip between the gas and liquid that a well-defined free surface is obtained. Without the allowance for slip between the phases (i.e., if a homogenous flow or VOF method were applied) the gas entrained by the impeller would have no possibility of ever escaping the vessel, as it does in reality. An alternative approach would be to use a mixture model and prescribe a slip velocity based on the ideas above. This has the potential to save computational time but was not tested in this study.
The above equations were solved using ANSYS CFX11 (ANSYS, 2007) for the reactor geometry shown in Figure 2. The frozen rotor approach was used to account for the rotating impeller and convergence to a steady state was obtained if the impeller rotation rate was in a suitable range. Full details of the method and validation of the calculated free-surface shape can be found in Torré et al. (2007a) and validation of the computed velocity field against PIV data can be found in Torré et al. (2007c).
It was found that the best fit with experimental data was obtained using an iso-surface where the water volume fraction was set to 0.9 to represent the free surface. This value differs from the expected value of 0.5 because the imaging technique used located the interface to be the zone where there is little gas present. We note, however, that the methodology described here can be applied for any choice of parameter that can define a free-surface location via a set of (x, y, z) coordinates.
3.2 Generation of the single-phase geometry
Given the results of the two-phase simulation, the following procedure was used to develop the single-phase flow geometry:
1 The iso-surface determining the location of the free surface was plotted in CFX Post and the locations of the points on this surface were exported to a text file. The total number of points used to describe the free surface was equal to 15,550 in the case presented here. Only the free surface (obtained with the
inhomogeneous approach described above) having
y > 500 mm from the bottom of the vessel was
considered, to avoid the gas column which links the top region of the vessel to the bottom dish.
2 The point cloud data were imported into the CAD package Pro/ENGINEER (Pro/E) (PTC, 2007). The final set of points kept was a subset of those imported, with errant points (outliers) removed and a much more uniform distribution of points was saved. By orienting the model to give a view from the top, an elliptical selection tool was used to acquire and delete all of the points around the baffles, as the free surface was highly deformed near the walls. Then the remaining filtered point set was used to create a triangular facet mesh, which resulted in a contiguous facet representation of the surface made by joining the points. Finally, the two elliptical holes where the baffles are located were filled using a curvature-continuous facet patch.
3 The STL file (geometry file) resulting from the above procedure was used in the Reverse Engineering Extension (REX) of Pro/E to create a series of curves, which attach automatically to the facet model. A ‘spider’s web’ was created where these lines crossed. A copy of the curve where the lines met the vessel wall was created and offset outwards, by eye, to assist in the creation of an extended surface later.
4 The resulting ‘cobweb’ of curves was written out as an IGES file and then read into a new Pro/E part file. The Interactive Surface Design Extension (ISDX) for Pro/E was used to trace over the ‘cobweb’ scaffold to create high quality, curvature-continuous B-spline curves. The position of the points on the curves and the tangency vectors at the curve ends could be controlled. From these curves, surface patches were generated that inherit their “curvature-continuity across the boundary” attributes from the parent curves.
5 The result was a very smooth quilt that was again written out in a neutral format. The vessel component was opened in Pro/E and the new quilt was read in, and the coordinate system was manipulated to put the surface in the correct place. The quilt was then used in a Boolean operation to remove the upper part of the vessel.
The entire process was undertaken with Pro/E and the REX and ISDX add-ins. Details of these CAD tools can be found in PTC (2007).
3.3 Single-phase modelling
Once the geometry had been created as above it was straightforward to remesh the model (using CFX Mesh to create a tetrahedral mesh with inflation at the walls) and to perform a single fluid simulation. In this case, the free surface was set as a no stress boundary and again the
k-İ turbulence model was used to represent turbulence.
Convergence was straightforward to obtain.
4 Results
In this section, we present the results of the simulations to both validate the approach and to illustrate how it can be used.
4.1 Validation of the approach
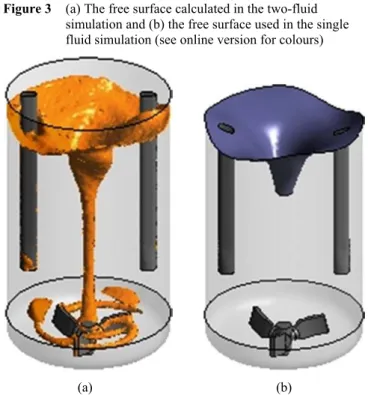
The location of the free surface as calculated in the original two-phase approach and that used for the single-phase flow simulation are shown in Figure 3. The case considered was for an impeller rotation speed of 275 rpm, which gives a significantly deformed free surface. It is evident from this figure that the calculated free surface is very complex and includes gas that has been entrained into the flow via the low-pressure zones around the impeller. For this exercise we ignore this gas, as it does not play a major role in the mixing of the injected jet, as we will see later.
Figure 3 (a) The free surface calculated in the two-fluid simulation and (b) the free surface used in the single fluid simulation (see online version for colours)
(a) (b)
Figure 4 shows the surface mesh on the original free surface and on the free surface modelled in the single-phase simulations. It is evident that a high quality tetrahedral mesh has been applied to the top surface. The presence of inflation meshing around the baffles and mesh concentration around the jet injection point (top right) are evident in the figure.
Figure 4 Details of the mesh on the free-surface shown from above: (a) on the free surface determined via the inhomogeneous two-fluid approach and (b) on the free-surface after the air region has been cut-away. Note the jet injection location in the top right quadrant and the inflation meshing around the baffles and walls
(a) (b)
It is important to establish that the simulation results obtained from the modified geometry are comparable with those obtained from the full inhomogeneous two-fluid model. To do this, a simulation was performed without jet injection. Results for the calculated velocity vectors on two vertical planes are given in Figure 5. It is readily observed that the free-surface strategy has not introduced any significant differences compared with the original case. Although the gas column on the vessel axis is not present in Figure 5(b), the velocities in the central vessel region are comparable. A good agreement is also obtained for the velocities close to the free surface.
Figure 5 The calculated velocity vectors from (a) the inhomogeneous two-fluid model and (b) the single fluid simulation, on two vertical planes. Note that vector projection onto the plane has been performed to highlight the flow structure
(a) (b)
A more quantitative comparison was obtained by examining the velocity components on various lines: three are horizontal located at Y = 200, 400 and 600 mm from the bottom of the tank, and one is a vertical line at a radius of 75 mm from the vessel axis, as shown in Figure 6. Figure 7 compares the velocity components, where the three components of the velocity (Ux, Uy and Uz) are compared on
the four different lines (shown in Fig. 6) located in the baffle plane. Minor differences only are observed and a very good agreement is obtained. It can thus be concluded that the modelling strategy using the single-phase approach gives the same results for the velocity field in the vessel as obtained from the two-fluid approach. As the inhomogeneous model has been shown to provide a free-surface shape and velocity fields in good agreement with experimental data in Torré et al. (2007a, 2007c),
respectively; it may be assumed that using the free-surface cut-away strategy allows the accurate calculation of the velocity field in the vessel.
Figure 6 Location of the lines used for validation of the velocity data presented in Figure 7 (see online version
for colours)
Figure 7 Comparison of the radial Ux, axial Uy and
circumferential (Uz) velocity values on different
locations on the baffle plane (N = 275 RPM) for the inhomogeneous model (black symbols) and the free-surface cut-away strategy (grey symbols): (a)–(c): Y = 200 mm; (d)–(f): Y = 400 mm; (g)–(i): Y = 600 mm and (j)–(l): vertical line at a radius of 75 mm from the vessel axis
(a) (b) (c)
(d) (e) (f)
(g) (h) (i)
(j) (k) (l)
4.2 Jet injection simulation
To illustrate how the procedure can be used in the real application we next performed a simulation to
investigate the injection of a jet of fluid into the mixing vessel, with application to the study of quenching of a chemical reaction. This simulation involves the injection of a fluid with the same physical properties as those of the fluid in the vessel (although this assumption could be relaxed very easily, especially for miscible fluids). The location of the injected fluid is traced via a scalar concentration and also via the tracking of Lagrangian particles that move with the injected fluid (see Torré et al. (2008a) for details).
Figure 8 shows the tracks of the Lagrangian particles at the point in time when injection has just been completed. The interaction of the jet with the rotating fluid in the vessel and the role of the free surface in determination of the jet trajectory are evident.
Figure 9 shows the variation of the tracer concentration on the free surface at various times. This plot shows very clearly how the fluid that contacts the free surface gets pulled around by the flow and is eventually sucked into the central well generated by the vortex. The applicability of the current approach to the modelling of surface released solids is evident from these figures.
Figure 8 Jet injection at a deformed free-surface. Lagrangian jet trajectories coloured by the Lagrangian particle travel time normalised by Tinj, for d = 10 mm, V = 6 m s–1and
N = 275 RPM, plotted at Tinj with 200 particles: (a) XY
lateral; (b) YZ lateral view and (c) top view (see online version for colours)
(a) (b) (c)
Figure 9 Scalar concentration on the free surface of the vessel for times of: (a) 0.25 s; (b) 0.5 s; (c) 0.75 s and (d) 1 s from injection. Note the scale is logarithmic and has been clipped for clarity (see online version for colours)
5 Conclusions
A process has been developed and validated that allows the use of an inhomogeneous two-fluid CFD model to determine the free-surface profile for an agitated vessel and to subsequently perform jet injection simulations using a single fluid approach. Therefore, to simplify the simulation of mixing vessels with a deformed free surface, the process can be decomposed into two steps. Instead of trying to do everything in the same simulation (quasi-impossible) or make the wrong assumption of a flat free surface (as is often done), the proposed methodology is as follows:
• use the inhomogeneous approach to predict the free-surface shape
• use a CAD package to generate a new geometry with a virtual free surface constructed from the simulated free-surface shape
• perform a second simulation to investigate, for example, blending, solids injection, jet mixing, etc.) using the real free-surface shape.
This decomposition means that the second simulation, with the free surface defined as part of the geometry can be run as a single fluid simulation (as illustrated here) or a two-fluid simulation in which liquid droplets or solids (buoyant or non-buoyant) could be injected. It is evident that this methodology provides a computationally efficient process to address a complex problem.
Acknowledgements
The authors would like to express their gratitude to Tessenderlo Group and the ANRT for the financial support of this work (CIFRE/ANRT contract No. 1727/ 1413582.00).
References
ANSYS (2007) ANSYS CFX11 Commercial CFD Software, ANSYS Inc., 275 Technology Drive, Canonsburg, PA 15317, USA, www.ansys.com/cfx
McIntosh, R.D. and Nolan, P.F. (2001) ‘Review of the selection and design of mitigation systems for runaway chemical reactions’, Journal of Loss Prevention in the Process
Industries, Vol. 14, No. 1, pp.27–42.
PTC (2007) ProENGINEER Wildfire 3.0, PTC Corporate Headquarters, 140 Kendrick Street, Needham, MA 02494, USA, www.ptc.com
Torré, J.P. (2007) Quenching Runaway Reactions: Hydrodynamics
and Jet Injection Studies for Agitated Reactors with a Deformed Free-Surface, PhD Thesis, Université de Toulouse
and University of Sydney, Sydney, NSW 2006, Australia.
Torré, J.P., Fletcher, D.F., Lasuye, T. and Xuereb, C. (2007a) ‘An experimental and computational study of the vortex shape in a partially baffled agitated vessel’, Chem. Eng. Sci., Vol. 62, No. 7, pp.1915–1926.
Torré, J.P., Fletcher, D.F., Lasuye, T. and Xuereb, C. (2007b) ‘Transient hydrodynamics and free surface capture of an under-baffled stirred tank during stopping’, Chem. Eng. Res.
Des., Vol. 85, No. A5, pp.626–636.
Torré, J.P., Fletcher, D.F., Lasuye, T. and Xuereb, C. (2007c) ‘Single and multiphase CFD approaches for modelling partially baffled vessels: comparison of experimental data with numerical predictions’, Chem. Eng. Sci., Vol. 62, No. 22, pp.6246–6262.
Torré, J.P., Fletcher, D.F., Lasuye, T. and Xuereb, C. (2008a) ‘An experimental and CFD study of liquid jet injection into a partially-baffled mixing vessel: a contribution to process safety by improving the quenching of runaway reactions’,
Chem. Eng. Sci., Vol. 63, No. 4, pp.924–942.
Torré, J.P., Fletcher, D.F., Touche, I., Lasuye, T. and Xuereb, C. (2008b) ‘Jet injection studies for partially baffled mixing reactors: a general correlation for the jet trajectory and jet penetration depth’, Chem. Engng. Res. Des., Vol. 86, No. 10, pp.1117–1127.
Nomenclature
CD Drag coefficient [–]
db Bubble diameter [m]
D Jet diameter [m]
g Acceleration due to gravity [m/s2]
M Interfacial momentum exchange term [kg/m2.s2]
N Agitator rotation speed [revs/min]
p Pressure [Pa]
r Radial coordinate [m]
t Time [s]
Tinj Time over which ‘killer’ is injected [s]
u Velocity [m/s]
U Velocity components [m/s]
V Velocity of fluid jet at injection [m/s]
Y Vertical distance from the flat free surface (liquid at rest) [m] Greek Symbols α Volume fraction [–] µ Dynamic viscosity [kg/m.s] ρ Density [kg/m3] Subscripts g Gas l Liquid p Fluid index tip Value at tip of impeller