by
November 2008 John E. Parsons
Do Trading and Power Operations Mix? The Case of Constellation Energy Group 2008
Contents
1. INTRODUCTION 2
2. CONSTELLATION ENERGY 1998-2007 6
3. THE LIQUIDITY CRISIS IN AUGUST ‘08 12
Element #1. Constellation’s swift move into the coal business. 12
Element #2. The sharp rise in commodity prices during 2008 12
Element #3. Failure in Constellation’s internal risk management processes. 13
Element #4. Constellation’s handling of the public relations. 14
Element #5. The US financial crisis. 15
4. POWER & TRADING: DO THEY MIX? 16
Integrated Trading Operations 17
Stand-alone Trading Operations 23
Mis-measuring Profitability 27
Constellation’s Changing Strategy for its Commodity Trading Operations 32
5. CONCLUSION 39
Appendix: Credit and Liquidity Crises at Electricity Trading Companies 2000-2002 40
Edison Dynegy Williams Aquila / Utilicorp El Paso Mirant FIGURES 57
Do Trading and Power Operations Mix?
The Case of Constellation Energy Group 2008
John E. Parsons∗
November 2008
Constellation Energy has been a leading performer in the merchant power business since 2001. In addition to its legacy utility, Baltimore Gas and Electric, Constellation is a merchant generator and a wholesale power marketer serving the load of utilities as well as industrial, commercial and retail customers. Constellation has developed sophisticated risk management capabilities and a large trading operation in electric power and related commodities. In a recent reorganization, Constellation gave its trading operations greater organizational independence and prominence. It also increased the scale of its proprietary trading, and used its trading operation as the tool for expanded investments into upstream natural gas and coal and international freight. In August and September of 2008, Constellation experienced a major liquidity crisis that saw its stock price fall by nearly three-quarters. In an emergency search for cash, it was forced to agree to sell itself at the low price. This paper reviews Constellation’s history and the specific events precipitating its liquidity crisis. It then places Constellation’s strategy vis-à-vis its commodity trading operations in the context of the larger history of commodity trading operations and discusses the key financial and strategic questions posed by Constellation’s crisis.
∗
MIT Sloan School of Management and MIT Center for Energy and Environmental Policy Research, E40-435, 77 Massachusetts Ave., Cambridge, MA 02139 USA, E-mail: jparsons@mit.edu
I am indebted to my colleagues at CRA International for providing assistance in gathering much of the data and information used in this analysis. Of course, they assume no responsibility for what I have made of it.
INTRODUCTION
On July 31, 2008, Constellation Energy (Constellation) released its second quarter earnings results, announcing that:
For the second quarter of 2008, we recorded adjusted earnings of $1.82 per share, $1.18 above the adjusted 64 cents per share earned during the second quarter of last year. As we mentioned at our Annual Meeting of Shareholders, these results significantly exceeded our expectations, reflecting strong execution at each of our operating divisions, with particularly strong performance at our Global Commodities Group. We are also reaffirming earnings guidance for 2008 of $5.25 to $5.75 per share.1
Constellation’s stock closed July 31 at $83.16.2 On September 18, less than 2 months later, its stock closed at $24.20 – a drop of nearly $59 or 71% – and the company had announced it had reached an agreement to be acquired by MidAmerican Energy Holdings Company at $26.50 per share.3 The acquisition was clearly executed under the pressure of Constellation’s suddenly dire financial circumstances and need for a capital injection. Figure 1 shows the share price and volume for Constellation’s stock during 2008 up to and including the announcement of the sale.
What had happened in the intervening days between the announcement of higher quarterly earnings and the sale forty-nine days later?4
1
Constellation Energy, Press Release, July 31, 2008, “Constellation Energy Reports Strong Second Quarter 2008 Results.”
2
All stock data from CRSP.
3
Constellation Energy, Press Release, September 18, 2008, “MidAmerican Energy Holdings Company Reaches Tentative Agreement to Acquire Constellation Energy.”
4
The remainder of this section relies primarily on contemporaneous news accounts to describe the events in this short window of time. Constellation’s Preliminary Proxy Statement for the proposed merger with MidAmerican also provides a useful play-by-play retelling of events: see Constellation Energy Group Inc Form Prem14a (Proxy Statement - Merger or Acquistion (preliminary)) Filed 10/17/08 for the Period Ending 10/17/08.
Not mentioned in Constellation’s original earnings announcement nor in its earnings presentation to analysts, but noted in its August 11 second quarter Form 10-Q filing with the SEC, was the fact that the contingent collateral requirement reported in its first quarter filing had been incorrectly calculated. Constellation had previously estimated that in the event that Constellation’s own credit rating were to fall 3 levels, to below investment grade, it would have been required to post additional capital of $1.608 billion. The correct figure of $3.234 billion was more than twice that amount. The error occurred because Constellation had overlooked provisions in certain of its contracts.5
Moreover, the second quarter filing also revealed that between the end of the first and second quarters the size of this contingent collateral requirement had grown another 41% to $4.570 billion. The day after the second quarter filing, the stock dropped 16%, from $73.04 to $61.25 on volume of more than 19 million shares – as compared to an average turnover of less than 2 million shares. The price of credit default swaps insuring Constellation's debt rose from 146 basis points at Monday's close to 169.5 basis points on Tuesday.6
As the days passed, Constellation’s credit and capital situation gradually worsened, despite a decision by one of its largest shareholders, Électricité de France International (EDF), to raise its equity stake from 4.97% to 9.9%. This was a statement of confidence, but since it was to be executed via open market purchases, it added no new capital to the company. On August 14, the rating agency Standard & Poor's announced a
5
Constellation Energy Group, Form 10-Q for the Period Ending 06/30/08, p. 48.
6
“Constellation Energy stock off on collateral fear”, Reuters News, August 12, 2008. All credit default swap quotes are from Reuters.
downgrade one level from BBB+ to BBB, still above investment grade. The agency Fitch followed suit on August 19 and Moody’s put the company’s rating on review. The price of credit insurance on its debt climbed to 196 basis points. On August 27, the company conducted a meeting and conference call with financial analysts to clarify its financial situation and strategy to investors. It pointed to the rapid rise in commodity prices as the major cause of the increasing collateral requirements, especially for its growing trade in coal. The company announced its plan to sell its upstream natural gas assets in order to improve its capital position, and it suggested it was looking to offload a sizeable fraction of its coal business as well. The company also announced that it had obtained a commitment from the Royal Bank of Scotland and UBS for a $2 billion unsecured credit facility.7 The price of credit insurance then fell to 175 basis points and the price of Constellation’s stock was back up to $68.49 on 11 million shares traded.
Over the course of the next two weeks, Constellation’s stock price gradually fell, reaching $58.37 on Friday, September 12. Then, on Monday, September 15, the Lehman Brothers investment bank announced its bankruptcy filing and rumors began circulating that Lehman Brothers was an important counterparty for Constellation and Lehman’s bankruptcy would damage Constellation. The stock closed down 18%, at 47.99. The price of credit insurance rose to 304 basis points. Despite Constellation’s protest that the Lehman bankruptcy would have no material impact on Constellation, investors worried that the broader turmoil in financial markets had to hurt the company’s ability to find counterparties and obtain financing for its collateral needs. Investors even discounted the commitment behind the new credit line from the Royal Bank of Scotland and UBS.
7
Constellation’s stock price fell another 36% on Tuesday, closing at $30.76 on trading of 41 million shares. The price of credit insurance on the company’s debt rose to 478 basis points. Then, on Wednesday, Standard and Poor’s announced it had put the company back on credit watch, noting that some counterparties had curtailed their activities with Constellation and emphasizing the urgency of the company’s need to address its liquidity position. Constellation announced that it had hired Morgan Stanley and UBS to advise it on strategic alternatives that would produce an infusion of cash. Constellation reiterated the strength of its liquidity position and confirmed the previously announced $2 billion credit commitment. It also reaffirmed its third quarter earnings guidance. Nevertheless, by the end of the day Wednesday, September 17, the price had fallen another $5.99, closing at $24.77. The price of credit insurance rose to 660 basis points.
EDF had been rumored to be one possible buyer for Constellation, but on Thursday morning, September 18, EDF announced it had decided against such a move.8 Enter Warren Buffet’s MidAmerican Energy Holdings which announced that same morning that it had agreed to buy Constellation for $4.7 billion in cash or $26.50 per share.9 The agreement included a $1 billion immediate injection of cash in exchange for preferred stock that, upon completion of the necessary regulatory approvals and the closing of the full deal, could later be converted to regular shares.
8
Dow Jones International News, September 18, 2008.
Purchase of Constellation by EDF would have been complicated by regulatory restrictions against a foreign firm owning a nuclear plant in the US.
9
MidAmerican Energy Holdings Company and Constellation Energy, Press Release, September 18, 2008, “MidAmerican Energy Holdings Company Reaches Tentative Agreement to Acquire Constellation Energy.”
The merger into MidAmerican isn’t yet final. Many regulatory approvals await, EDF may yet act to exercise some control and a battle for control mayß yet play out. Or shareholders of Constellation may reject MidAmerican’s bid, accepting the penalties that would have to be paid and the risks involved in moving forward without MidAmerican’s financial support.10 But clearly the first phase of the saga is over. It is worth stepping back and asking how Constellation Energy found itself in this situation and what financial lessons there may be, if any, for other energy companies.
2. CONSTELLATION ENERGY 1998-2007
Constellation Energy is a product of deregulation in the electric power industry. It had its origins in the Baltimore Gas & Electric (BGE) company. While BGE’s primary business was providing electricity and gas in its regulated service territory, already by 1998 BGE had been responding to the early moves towards increased competition in electric generation by developing new lines of business. It created a new subsidiary, called Constellation Power, to purchase and develop unregulated generating assets in a number of markets. It created a power marketing and risk management company, Constellation Power Source (CPS), offering its services to wholesale customers in a variety of North American markets. And it created the subsidiary Constellation Energy Source to provide energy services. At year-end 1998, these non-regulated businesses counted for a total of 21% of BGE’s revenue as compared against 79% from its regulated
10
Indeed, the closing on the previously announced $2 billion credit line from UBS and the Royal Bank of Scotland was delayed, and the amount of the planned commitment was reduced, first to $1.25 billion and then to $1.2 billion. Constellation will have to make up the $750 million shortfall from other sources, including an additional injection from MidAmerican. Constellation Press Release, “Constellation Energy Provides Update on Liquidity and Strategic Initiatives,” Oct 31, 2008, and Constellation Press Release, “Constellation Energy Reports Third Quarter 2008 Results – Provides Update on Steps Taken to Increase Liquidity,” Nov 6, 2008.
electricity and gas business. The non-regulated businesses contributed only 6% of BGE’s net income as compared against 94% from its regulated electricity and gas business.11
In 1999, Maryland passed restructuring legislation enabling competition among electricity suppliers. In response to this, BGE reorganized itself. Constellation Energy Group became the holding company for the regulated BGE and for the non-regulated generation, wholesale power marketing and services businesses. In 2000, Constellation transferred BGE’s generating assets at book value to the non-regulated subsidiaries. This included its two nuclear units at Calvert Cliffs, Maryland, as well as some fossil fuel plants and a small hydro plant in Maryland and Pennsylvania. Together these had a total of 6,240 megawatts of generation capacity, a total projected net book value at June 30, 2000 of approximately $2.4 billion, and represented about one-half of BGE's operating income. With the restructuring, CPS now had responsibility for marketing Constellation’s generation as well as sourcing its sales to BGE. CPS became the vehicle for Constellation’s activities as a wholesale power marketer, trader and provider of risk management services. Together with the generation assets, these activities became known as the merchant energy business.12
At the conclusion of its first full year as a restructured company, the regulated electricity and gas businesses, respectively, accounted for 27% and 8% of Constellation’s assets, 52% and 17% of revenue, and 20% and 9% of net income. The merchant energy business now accounted for 57% of assets, 16% of revenue and 70% of net income. Other
11
Baltimore Gas and Electric Co, Form 10-K for the Period Ending 12/31/98.
12
non-regulated businesses accounted for 8% of assets, 15% of revenue and 1% of net income. The restructured Constellation announced that:
… our primary growth strategies center on the nonregulated domestic merchant energy business with the objective of providing new sources of earnings growth.13
Constellation thereafter moved aggressively to grow its merchant energy business in a competitive electricity market.
Constellation was not alone. As it was executing its restructuring, a number of other firms were moving into the deregulated electricity business, including merchant generation, wholesale power marketing and trading. The stock market was giving very high values to independent merchant companies. During calendar year 2000, Enron’s market capitalization more than doubled. In October of 2000, the Southern Company began the spin-off of its merchant generating business, Southern Energy, later to be named Mirant. The stock value shortly increased more than 50%. Similar spinoffs were announced by Kansas City’s Utilicorp and Houston’s Reliant. Constellation, too, announced its decisions to further its restructuring by splitting into two completely independent companies. One was to be its domestic merchant energy business, under the name Constellation Energy Group. The other was to be a regional retail energy delivery and energy services company, BGE Corp., including the regulated BGE and other non-regulated businesses.14
Before Constellation could carry out this last move, events in 2001 overtook the plan. Enron’s stock price was already tumbling, which was the impetus for the gradual
13
Constellation Energy Group, Form 10-K for the Period Ending 12/31/00.
14
unwinding or collapse of its off-balance sheet structures. Power prices had begun to fall across the country and valuations for power companies were falling dramatically. Constellation itself announced in July that its profits in the second half of the year would be lower than expected: its stock price fell 20% in one day.15
In October 2001, Constellation announced the cancellation of its plan to split into two businesses. It brought in a new President and CEO, Mayo A. Shattuck, III.16 It initiated a cost cutting program, including the sale of certain non-core assets. Constellation’s new management made a decision to stand by its commitment to competitive markets, and so its essential strategy remained unchanged. Over the next number of years, Constellation’s merchant energy business consisted of two major components: generation and wholesale power marketing.17,18
Constellation expanded its nuclear operations outside of its legacy territory with the purchase of the 2-unit Nine Mile Point, New York, plant in 2001. In 2004 Constellation purchased the Ginna nuclear power station in New York. Although not the largest nuclear operator in the US, Constellation became one of the major nuclear operators. In 2007, Constellation formed a joint venture, UniStar Nuclear Energy, LLC
15
Reuters News, July 20, 2001, “Constellation profits up but issues warning.”
16
Constellation Energy, Press Release, October 26, 2001, “Constellation Energy Group Elects Mayo A. Shattuck III New President and CEO; Christian H. Poindexter Continues as Chairman and Constellation Chooses to Maintain Current Holding Company Structure.”
17
Constellation Energy Group, Form 10-K for the Period Ending 12/31/01. The material in the remainder of this section is based on the Form 10-Ks for the years 2001 through 2007, and the Form 10-Qs for the first and second quarters of 2008.
18
Constellation gave various titles to its wholesale power marketing operation. In 2000 and 2001 it was known as Power Marketing. In 2002 and 2003 it was known as Competitive Supply. In 2004 through 2007 it was known as Wholesale Competitive Supply. In 2008 it was split across two units: Customer Supply and Global Commodities.
with an affiliate of EDF for the purpose of developing, owning and operating nuclear power plants in the US and Canada. In June, 2008, the UniStar joint venture completed its filing for a combined license application to construct a new unit at the Calvert Cliffs site. UniStar had previously announced its intention to apply for a license for the Nine Mile Point site as well. Constellation also gradually expanded its fossil fuel capacity, first with 1,100 MW of gas capacity in 2001, another 2,145 MW in 2002 and 830 MW in 2003. These plants were located in a number of states, several outside of Constellation’s legacy territory. One of these gas fired plants was sold in 2005, and several were sold in 2006, reversing 94% of the previous expansion in gas fired capacity. Total generation capacity owned by Constellation had increased from 6,544 MW at year-end 2000, to a high of 12,532 MW at year-end 2004, back down to 8,728 MW at year-end 2007.
The wholesale power marketing side of Constellation’s business was built on the foundation of its role in sourcing power for its regulated subsidiary, BGE. Constellation then moved to offer load supply contracts to other utilities as well. In 2002, it acquired NewEnergy from AES, expanding its offerings to large commercial and industrial customers across the US. And later it began to include retail supply aggregators in its customer base. At year-end 2002, Constellation was serving 18,700 MW of peak load. This was 1.65 times the generation capacity it owned. In addition to growing both businesses internally, Constellation followed the NewEnergy acquisition with a series of acquisitions of load serving businesses, in electricity and also in natural gas. By year end 2007, Constellation was serving 32,700 MW of peak load or 3.75 times the generation capacity it owned in 2007.
As a component part of its wholesale power marketing business, Constellation ran a commodities trading operation.19 Constellation’s trading operation managed the sale of power from its generating units, managed the purchase of fuels for its generating units, sourced power and natural gas to service its load contracts, performed overall portfolio management, including the hedging of its commitments, designed and executed structured commodity contracts for other customers, and actively traded a proprietary portfolio, i.e., of positions for profit. The commodities trading business gradually expanded its focus into the upstream natural gas and the coal business, among others.
From 2001 through the second quarter 2007, Constellation fulfilled on its strategic plans and chalked up many quarters of successful performance. Figures 2, 3 and 4 show how the share of net assets, revenue and income shifted toward the merchant energy business and away from the regulated entity over time. By year-end 2007, merchant net income was 85% of Constellation’s total net income, with the balance being from its regulated electricity and gas units.20 From 2001 through 2007, the company’s stock regularly outperformed its comparables, as shown in Figure 5. Unfortunately, much of this performance was erased with the price collapse in August and September of 2008.
19
Over the years, Constellation used a changing set of labels for what I term the trading operations. These have included risk management, portfolio management and trading, among others. In this paper, I use the term trading operations very broadly to encompass a number of complementary activities that generally accompany wholesale power marketing. These would include risk analytics, risk management consulting services, trade execution, structuring transactions, dynamic hedging and portfolio management, among others. My usage is not meant to be shaped by Constellation’s varying usage over time. Rather, it is generic and so encompasses similar operations at other companies. In time, Constellation appears to have used the term trading exclusively to refer to its proprietary trading, i.e., not to hedging transactions, but to
transactions intended to capture a profit, whether in the form of an arbitrage or through the intentional exposure to risk. When I mean to speak of proprietary trading as opposed to other types of trading, I specifically say so.
20
3. THE LIQUIDITY CRISIS IN AUGUST ‘08
What caused Constellation’s liquidity crisis in August, 2008? We address this from two perspectives. In this section, we focus simply on the proximate cause of the crisis. Then in the next section we discuss the larger strategic picture that embedded the possibility of the crisis and discuss the special management challenges posed by commodities trading operations.
The proximate cause of Constellation’s liquidity crisis has five elements.
Element #1 was Constellation’s swift move into the coal business. Of course, Constellation has long had to source coal for a few of its own electric generating stations. But gradually Constellation began to expand the range of commodities that it traded as a separate profit making line of business. By 2004, Constellation’s Form 10-K report noted its trading in both coal and natural gas, although it didn’t yet separately quantify the size of these operations. In the 2005 Form 10-K Constellation reports delivering 12.6 million tons, in 2006 the figure is 26 million tons, and in 2007 it is 28 million tons.
Element #2 was the sharp rise in commodity prices during 2008, especially for coal. The CSX coal price index more than doubled during 2008. These price rises created large swings of contracts in- or out-of-the-money, depending upon which side of the transaction the party was on. According to Constellation, many of its contracts that went out-of-the-money had clauses requiring margin payments, while many of its contracts that went in-the-money did not. Therefore, Constellation experienced a net cash draw, even when the net mark-to-market position was little changed.
calculation of the VaR per physical unit traded for various commodities and for various dates from year-end 2006 into 2008. The rise in the VaR is notable, especially for coal at year-end 2007 and throughout the first half of 2008. This rise means that the credit requirements for any given physical position are larger, other things equal.
Moreover, many of the counterparties that Constellation did business with in the coal industry were below investment grade, so that as the positions went in-the-money, Constellation had to recognize increasing credit exposure to low rated counterparties. Figure 7 shows the increasing proportion of Constellation’s exposures that were below investment grade. This increase was due in part, but not entirely, to Constellation’s move into the coal business. During the first quarter of 2008, Constellation experienced a major default by one of its coal counterparties, and this seriously impacted its earnings that quarter. This was the first direct wholesale credit loss Constellation had reported in its history.21
Of the $4.4 billion in collateral Constellation posted on July 31, 2008, the company reported that 25-35% of it was for its coal supply business, a business that had hardly existed four years ago.22 This large increase in Constellation’s coal business, and the sharp rise in coal prices set Constellation up for the third element in the proximate cause.
Element #3 was a failure in Constellation’s internal risk management processes. Many commodity contracts contain provisions whereby additional collateral must be
21
Constellation Form 10-Q for the Period Ending 3/31/08, p. 26, and “Constellation Energy 2008 Analyst Meeting, August 27, 2008,” p. 27.
22
provided should the company’s credit rating drop, with different amounts of collateral being required contingent on the number of levels the rating is dropped. This is an entirely standard feature of this sort of contract, and the contingent capital required is something a company has to stand ready to provide if it is going to be in this line of business. Constellation had long voluntarily reported in its quarterly and annual financial reports the aggregate contingent collateral required for downgrades up to and including a downgrade to below investment grade. However, it turns out that Constellation’s risk management system was not capturing the contingent collateral required by one class of so-called non-standard contracts connected to Constellation’s newly expanded coal business.23
Taken together, these factors led to Constellation’s significant under-reporting of its contingent collateral requirement in the first quarter of 2008: a reported collateral call of $1.608 billion in the event of a downgrade below investment grade, as opposed to the correct figure of $3.234 billion. By the second quarter of 2008, this contingent collateral figure had risen by another $1.336 billion.
Element #4. Constellation’s handling of the public relations surrounding these facts was also problematic. The second quarter earnings release on July 31 contained figures that reflected on Element #2, the rise in collateral being used by the coal operations, but the figures were inadequately explained. For example, as the mark-to-market value of the contracts rose, the gross value of both the asset and the liability side of its books expanded. Simultaneously, cash flow seemed to be reduced. By the nature of
23
Constellation Form 10-Q for the Period Ending 3/31/08, p. 26, and “Constellation Energy 2008 Analyst Meeting, August 27, 2008,” p. 27.
mark-to-market accounting, considerable suspicion can arise in such circumstances. The forensics were left to analysts and investors who started noticing key details in this or that figure, but, without the full background information, had difficult putting together an explanation for why the financials appeared as they did.
That misstep was compounded by Constellation’s complete failure to mention Element #3, the error in calculating contingent collateral, in its July 31 press release of its second quarter earnings. Mention was also omitted during the Analyst meeting that day. This information only came out when Constellation filed its Form 10-Q with the SEC on August 11, and without any accompanying release. Once again, analysts and investors were left to discover this fact on their own, and were offered nothing more than the short description of the error that appeared in the Form 10-Q. The growth in the contingent collateral, correctly calculated, that occurred between the end of the first and second quarters was unexplained. Once analysts and others noted the large contingent collateral exposure, outsiders began to speculate on Constellation’s financial health, but without Constellation’s own plans and message being a leading part of the discussion. Constellation only addressed this issue in the analyst meeting that it scheduled for later that month.
Element #5. At this point, Constellation’s problem intersected with the wider financial crisis facing the US economy.
For Constellation the next shoe to fall was the Lehman bankruptcy. Lehman was an important player in commodity markets. Rumors started to circulate that Constellation was significantly exposed to Lehman.
More importantly, however, Constellation’s sudden need for capital arose at a moment when the US credit markets were experiencing a massive contraction. Where was Constellation going to get the credit it needed? No one was sure. Prior to the analysts meeting at the end of August, Constellation negotiated a commitment for a $2 billion credit line from the Royal Bank of Scotland and UBS. But there were persistent rumors and speculations that the line was being pulled or would never come through, and Constellation was unable to ever convince many in the market that the commitment was secure.
Constellation found itself desperate for capital just when capital was extremely scarce and very, very costly.
4. POWER & TRADING: DO THEY MIX?
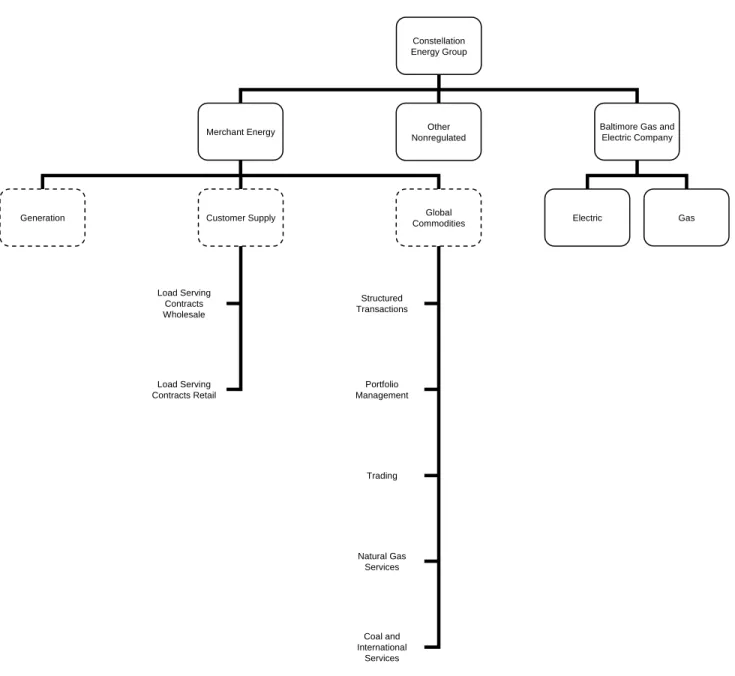
In the years before the liquidity crisis, Constellation had been in the process of reorganizing its reporting structure. The trading operation, which had previously been a component part of an integrated wholesale power marketing business, was now pulled out and promoted to be a distinct reporting unit alongside generation, customer supply and the regulated utility. This gave it a new prominence in the firm’s results. The reporting structures used in 2001-2003 and 2004-2007 are shown in Figures 8 and 9. The new reporting structure that formally debuted in 2008 is shown in Figure 10. The new reporting structure had been previewed at the January 2007 Analyst Presentation of 2006 results and was pre-announced in the publication of the 2007 Form 10-K. In the January 2007 Analyst Presentation, the business of the newly separate trading operation was analogized to that of an energy hedge fund or a merchant back. The companies suggested
as comparables for the trading operation were Bear Stearns, Goldman Sachs and Lehman Brothers.
The trading operation was to be an important engine of growth for the company. It was the skills of the trading operation that were to provide the foundation for Constellation’s expanded diversification into other energy businesses, including upstream natural gas and the coal and international freight business.
Constellation’s reorganization and its promotion of the trading operations as a distinct line of business on which it would lean for growth represented a major business decision. To understand the significance, it is necessary first to develop a clearer understanding of the different business models in which the functional capabilities of trading and risk management play a role, and to understand some of the difficulties that have plagued other power companies that have tried to turn their trading operations into a separate profit center. Then we can take a look at Constellation’s approach.
Integrated Trading Operations
From 2001 through 2007, Constellation presented its core strategy as running a completely integrated merchant energy business, with its trading operations being an essential component of its wholesale power marketing business and its generation. For example, Constellation’s 2003 Form 10-K says that:
Constellation Power Source, our wholesale marketing and risk management operation, dispatches the energy from our generating facilities, manages the risks associated with selling the output and obtaining fuels, and structures transactions to meet customers’ energy and risk management requirements.
In reporting revenue, expenses and gross margin, the risk management, portfolio management and trading activities were combined together with the rest of the load
serving activities into a single wholesale power marketing number reported as Competitive Supply as shown in Figure 8 for 2001-2003 and Figure 9 for 2004-2007.
What is a wholesale power marketing business, and how do the trading operations fit into it? Constellation’s major customer channel consisted of local utilities which have an obligation to provide whatever quantity of electric power their customers demand, at all times and in all quantities. The local utility’s total load varies by the hour of the day, the day of the week and the month of the year. It varies throughout the geography of its service territory. Constellation, as the wholesale power marketer, would agree to source this load. The first task is to properly understand the utility’s load requirement. This involves a significant investment in information technology. Large quantities of data must be processed to identify the expected level of load at each point in time and geographic location, to understand the statistical regularities of the demand from millions of customers as well as the patterns of volatility. And, of course, the information technology itself is nothing without the human and organizational capital required to organize, analyze and make sense of the data. The second task is to master the administrative task of arranging delivery of the power, knowing the protocols and procedures of the markets in which it operates and delivers power, measuring and monitoring delivery and prices, and executing the relevant back office tasks to bill the utility and pay for the sourced power. The third task is to know the wholesale marketplace and the cost of sourcing power, who is selling power where and what to pay for it. The fourth task is to be able to offer the power on price terms that are useful to its customers. This involves providing some short-term insurance in the form of relatively fixed price terms for the power it will deliver. Sourcing fluctuating quantities of power
from a volatile wholesale market and delivering it at fixed prices requires a sophisticated risk management operation. Constellation would have to evaluate the risk impounded into the contract terms it negotiates with the utility and be able to repackage these risks and offload them into the financial marketplace through a sophisticated hedging program. Constellation’s risk management operation needed to be able to assess what price the financial market places on risk, and use that information to determine the pricing terms the company can offer to potential customers. Included among the risks that the company must evaluate is the credit risk of the counterparties with which it does business, since that credit risk will mostly remain on Constellation’s books. The wholesale power marketer must have a strong enough balance sheet to hold the counterparty credit risk that it accepts.
Together, these four capabilities provide the justification for the wholesale power marketer assuming the local utility’s responsibility for sourcing its load, and they determine the margin it can charge for providing this service. In this business model, the trading operations are not a separate profit center, but a component part of the load serving business. The single margin earned by the load serving business captures the return on all of the capabilities that combine to make the business possible, from the marketing skills to the back office capabilities to the trading skills.
Obviously similar load supply services can be offered directly to industrial and commercial customers. The pattern of load is different, and the terms of the contract that will be negotiated are different. To enter this marketing channel, the wholesale power marketer needs to adapt its capabilities. There is a greater need for a marketing staff that can understand individual customer needs. But in other regards, the nature of the business
is very similar. Large industrial and commercial customers sometimes have greater flexibility to respond to fluctuating wholesale prices by adjusting their demand for power, and the ability to work with customers to exploit this flexibility, know when it will be needed and how to value it are important parts of the wholesale power marketer’s competitive skills. This is especially true as wholesale market regulations are revised to encourage and financially reward demand response. The wholesale power marketer can further expand its business by offering power directly to retail customers, circumventing the local utility where retail choice is permitted. This involves yet another set of marketing skills, but also builds on the same foundation of information technology, market access and risk management capabilities.
These same skills can also be applied to the generation side of the business, as Constellation had always done. The wholesale power marketer will cooperate with the generating unit to set the company’s plan for generation and will assume much of the responsibility for the logistics of delivering the power into the wholesale market. The wholesale power marketer will also enter into long-term contracts with other generation companies. While the generation company will retain the responsibility for the day-to-day operation and maintenance of the plant, the contracts will give the wholesale power marketer significant control over the sale of the plant’s power. Finally, the wholesale power marketer will maintain a contact list of other generators that it will look to on a shorter-term basis to obtain power, and it will also look to the very short-run and anonymous wholesale marketplace for power. Each of these different sourcing channels relies upon the same set of functional capabilities described above in the wholesale power marketer’s relationship with local utilities and other power buyers.
What the wholesale power marketer offers as a service, the generation company or local utility can try to do for itself, and some do. To execute on this task, the company will need to have its own trading operation, of course. It will need to hire traders, make investments in software, it will need to know the relevant markets and players, and so on. The trading operation will be a cost center providing a support function to the central business units of the firm, just as the accounting department and the marketing department and the IT department are support functions in many firms. When trading is self-sourced, even when trading is central to the company’s profitability, trading is not a stand-alone profit making operation, but an integrated part of the power generation or load supply business. There is no separate profit from trading.
A company that illustrates this organizational structure is AEP, American Electric Power, a utility with a base in the Ohio, West Virginia, Indiana, Kentucky, Michigan, Tennessee and Virginia, as well as a base in Texas, Oklahoma, Arkansas and Louisiana. During Enron’s heyday, AEP had aggressively moved to expand its trading operations, looking to trading to be a profit center of its own. But with Enron’s bankruptcy and the related upheavals in the wholesale electricity markets, AEP aggressively moved to trim its trading operations. More importantly, AEP moved to clearly align the operations purely to facilitate the generation and supply obligations of its local operating units. Trading was employed to raise the margins on generation and lower the cost of supply and to serve as a source of intelligence for the proper valuation of investment and
operating decisions. Trading was not to be conducted in any markets that AEP was not involved in, and trading was not evaluated as a separate profit making unit.24
Companies will vary as to how central a role the trading operations play in this integrated business. One generation company, for example, may use the trading operation simply as the passive outlet to the wholesale market, with the trading operation playing no role in shaping the strategy of the generator. While trading may yield some amount of ‘intelligence’ about the marketplace and prices, for this hypothetical company there is relatively modest feedback from the trading department and the operations of the company’s generating units. Generation is planned independently of the trading operation, and the trading operation is utilized to execute on these decisions.25 Another generation company may make trading a more central and active element in its strategy to maximize the value of generation. Electricity prices fluctuate dramatically, demonstrating that a kilowatt hour is not just a kilowatt hour: it depends on where and when it is delivered. Different generating units can produce different profiles of power. Some can be turned on and off more quickly, and units can be designed, retrofitted and operated to maximize their flexibility. Maintenance and shutdowns can be scheduled when the power is least valuable. All of these management decisions need to be made based upon a constant stream of information and analysis about the value of power in the competitive wholesale market. The trading operation is both the locus for that intelligence, and the
24
AEP Annual Report, 2005 and AEP 2005 Form 10-K. Risk magazine Special Report. Corporate risk: Profiles, A taste of corporate risk, May 2004, Volume17, No5.
25
For an example of generation companies that leave money on the table by not exploiting adequately intelligence about the marketplace and better bidding strategies in the wholesale power market, see Ali Hortacsu and Steven Puller, “Understanding Strategic Bidding in Multi-Unit Auctions: A Case Study of the Texas Electricity Spot Market”, RAND Journal of Economics, 39(1): 86-114, Spring 2008.
tool for maximizing the access and matching the low cost supply with the high margin demand. In order to capture the value of the trading operation, trading must be tightly integrated with generation. Managers who are running the generators need to be responsive to the information coming from the marketplace, and that means they must be responsive to information coming from the trading operation.
Just as an active, integrated trading operation can improve margins on generation, so, too, can it improve margins earned serving load. For example, customer power profiles can be very complicated; portfolios of customers can be constructed with profiles that are easier and cheaper to serve or that yield the highest margin sales. A good trading operation provides more precise information about the cost of serving different loads and so enables the wholesale power marketer to better price its services.
In this integrated model, trading benefits the firm indirectly. In the more passive version, trading is simply a tool for realizing the margins from generation or from customer supply. In the more active version, trading helps to maximize the margins. In both cases, the value of the trading operation is captured through the returns on generation and the returns on customer supply. There is no independent profit earned on trading.
Stand-alone Trading Operations
Some companies operate trading operations that are not tightly connected to specific generation assets or load serving obligations in the way described above. These standalone trading operations deal in the wholesale marketplace in isolation from any of their parent company’s own generation capacity or load serving obligations. They may
buy and sell purely financial obligations. Or they may buy and sell contracts with physical obligations to deliver, but they must close out of the positions before the obligation to deliver becomes real. These operations are the ones that most closely mimic the trading desks of a Wall Street bank. They act as a financial intermediary, providing liquidity to the marketplace and helping to make-the-market.
Indeed, a number of banks operate commodities trading operations of this sort, including Morgan Stanley and Goldman Sachs. A good example of a power company with this type of trading operation is Sempra Energy, based in San Diego. Like many electricity companies, Sempra had its origins in the traditionally regulated San Diego Gas and Electric Company and the Southern California Gas Company, and it continues to operate those two units to this day. Sempra also has a deregulated electric power generation company, as well as gas pipeline, storage and LNG units. Finally, Sempra has a commodities trading unit. This unit is entirely separate from the other units. It has its main trading floor in Connecticut, not in California. It trades in electricity, natural gas, petroleum, but also in metals. Sempra’s commodities trading business had its origins in Drexel, Burnham & Lambert and AIG Trading Corporation. Sempra’s commodity trading unit is evaluated on the basis of its own profitability and through 2007 the unit was reported on the financials as a separate segment. In April 2008, Sempra spun the commodities trading business off into a separate joint venture partnership with the Royal Bank of Scotland, now called RBS Sempra Commodities, which adds emphasis to the point that the trading operations are fully strategically independent from the rest of Sempra’s businesses.
Many stand-alone trading operations do have some physical assets. They may get involved in actual physical delivery whether occasionally or regularly. But these physical assets are a subsidiary element of the business. They are there to support the ability of the trading desk to enter in and out of trades. The ability to physically take or make delivery facilitates a large volume of trading that doesn’t actually involve physical delivery.
Within the stand-alone trading operation business model, there are several different strategies for turning a profit. One strategy involves making a market in standardized instruments. In this case the company earns a small margin on each trade either by capturing the bid-ask spread or by charging a commission. It drives profit by expanding the volume of trades. An alternative strategy is to market highly structured instruments and transactions, in which case the company earns its profit through high fees for service on a small number of these specialized deals.
In both cases, the company attempts to offset any risks in the transaction so that it is not exposed. The broker avoids taking stepping into the transaction, and captures a profit only by being able to find parties for both sides of individual transactions who are willing to swap risk with one another. The dealer arrives at roughly the same endpoint, but by an intermediate step. On any individual transaction, the dealer takes one side of the position, but attempts to maintain a book of many transactions that in aggregate offset one another and therefore have little risk on net. The company that crafts the structured transaction is also stepping into one side of the transaction, but has identified up-front a set of hedging transactions it can enter into to offload the risk.
A third strategy for a stand-alone trading operation is to actually take an exposed position, betting its own capital on a proprietary portfolio of risky positions. Here the
company is seeking to directly profit off of its superior information about price movements or other key risk factors.
This third strategy is very different from either of the other two. Instead of minimizing the company’s exposure to a risk factor, this third strategy relies on the company purposefully accepting additional exposure. Where the first two strategies involve hedging, this third strategy is speculation.
Many people erroneously imagine that this third strategy of speculative investing in a proprietary portfolio is the major activity and source of profit at the major investment banks, and they downplay the role of deal flow, i.e., they downplay the role of the first two strategies. In a few cases, such as hedge funds, the proprietary portfolio is the whole story and speculative trading is the source of profit. But generally, as Braas and Bralver have documented in the case of trading in foreign exchange and fixed income instruments, even the major trading desks of Wall Street banks make most of their money from these other skills and not from speculative trading.26
Although the trading operations of an integrated wholesale power marketer and those of a stand-alone or pure financial intermediary differ in important regards, they nevertheless rely on some of the same underlying assets to build their franchise. Both must maintain expertise in risk management, knowledge of the wholesale marketplace, information technology, and administration. Both are involved in marketing, although the channels are quite different. These skills enable both the wholesale power marketer and the stand-alone trader to capture a return on deal flow. But their customer base, the assets
26
managed and their market focuses are very different. It is the superficial similarity of some of the common functions that leads many to blur the distinctions between the business models with which different trading operations are associated.
Obviously, it would be possible to develop the capabilities for trading inside the integrated model, and then to transfer them to operating a stand-alone business. But there is more to each model than a sophisticated analytic model. Each involves mastery of different markets, clients and so on.
Mis-measuring Profitability
Commodities trading operations at electric power companies have had a rocky relationship throughout the short period of time since electricity markets have begun to operate outside the old framework of vertically integrated rate-of-return regulated utilities. Why? What has been the source of the problems, and what is the proper role for trading? How is this related to Constellation’s liquidity crisis?
There are two related problems that recur. The first is a misunderstanding of how trading operations generate value due to a misplaced focus on proprietary trading. The second is a tendency to underestimate the risk and capital requirements associated with proprietary trading, leading to an exaggeration of its profitability. As a consequence, many companies lose focus on the elements of a trading operation that add value. The new focus on risky and unproven proprietary trading crowds out and endangers the successful integration of trading with either generation or load serving. More troublesome, however, is the fact that the inherent financial risks of proprietary trading do not comfortably share a balance sheet with the more stable generation and wholesale
marketing businesses. The new liquidity risks pose a special danger to the long-term financial health of a generation and wholesale power marketing business.
This misunderstanding drove the strategy choices of several merchant generation and wholesale power marketers leading up to the industry collapse of 2001 and 2002. The resulting collapse forced a full scale retrenchment away from stand-alone trading operations. Why?
The years 2000, 2001 and 2002 were tumultuous years for the electric power business. The California electricity crisis erupted in 2000, and ended in allegations of market manipulation. In 2001 Enron’s stock price began to fall, precipitating the collapse of its off-balance sheet structures and the revelation of its accounting fraud. Following on the heels of Enron’s bankruptcy were charges of fraud at Dynegy, El Paso and others. The wholesale price of power also fell during this time period, and a number of merchant generation companies saw collapsing margins that led to credit rating downgrades. In several cases, the companies saw their rating fall below investment grade, including Mirant, Aquila, Williams, Dynegy and El Paso. To avoid getting bogged down in the details of each company’s specific situation, I discuss these in more detail in an Appendix to this paper. I continue here with the general lessons to be drawn from the episode.
The credit rating drop forced these companies to focus on the capital required for trading in a way that until then they had not. This is because an investment grade credit rating is required to run a trading operation, while it is not necessary to continue as a generator. Without an investment grade credit rating, counterparties are unwilling to trade with the company or they demand very high levels of collateral. The trading companies could have tried to post the necessary collateral. Alternatively, a number of companies
considered alternative financial structures that would give their trading operations an above investment grade credit rating while the generation unit would operate with a lower credit rating. However, in most cases, the companies found that the capital required proved too costly.27 Prior to the ratings downgrade, the companies had run large proprietary portfolios that were not being fully charged for the risk capital the portfolios were implicitly consuming. So long as the proprietary trading could be conducted on the balance sheet funded by debt charged against the generation assets, the returns on proprietary trading appeared to be high. But as soon as the trading units had to capitalize their activities themselves, the returns did not appear so good. Once forced to shoulder the capital costs fully on their own account, several of the proprietary portfolios were closed down and the residual trading operation was reduced to a support function for the generation or other operations of the company.
This episode illustrates a persistent problem that arises whenever a trading operation stops being an integrated part of a single business, as in wholesale power marketing, and begins to operate as its own profit center. So long as a trading operation is a component part of an integrated business, the capital demands of the underlying business tend to be relatively constant and predictable. Once trading becomes an independent operating unit and profit center, and, in particular, if trading is focused significantly on running a proprietary portfolio of speculative trades, the unit’s capital demands can be erratic. A proprietary portfolio often entails an implicit contingent capital claim. If the business is trading in truly liquid, purely financial instruments, this is not a problem since the size of the book can be quickly adjusted to match the capital available.
27
The sole and temporary exception among the companies discussed here was Edison Mission Marketing and Trading. See the Appendix for more details.
No contingent capital calls arise. But if the business is focused in physical and less liquid positions, the difficulty of adjusting the size of the book makes this contingent capital claim real. This is why the problem has arisen more often for commodities trading firms than for other, purely financial trading operations. Commodities trading firms tend to deal more in illiquid positions and in physical markets.
It is essential to recognize this contingent capital claim in evaluating the profitability of the trading business properly, but this can be very difficult to do. The concept of Value-at-Risk is one attempt to do so, but it is still an imperfect tool, and too often misleading in commodity trading businesses.
If the proprietary portfolio were a stand-alone operation with its own balance sheet, then any errors in appreciating the size of the contingent capital claim would be felt directly by the equity holders of the proprietary portfolio, as it should be, and would have no effect beyond the trading operations themselves.28 But where these trading operations share a balance sheet with the other business units, it is easy for the trading operations to be expanded on the basis of the debt capacity of the full balance sheet without the trading operations ever being charged for the contingent claim on capital that they are making. Counterparties to the trading operations will look to the assets of the non-trading businesses as backing for the contingent credit implicitly extended in the form of trades.
28
It is useful to contrast the cases of Ameranth Advisors, a hedge fund that collapsed in 2006 in the wake of a failed speculative bet on natural gas futures, and the case of Metallgesellschaft, an industrial
conglomerate that nearly went bankrupt in 1993-1994 in the wake of a failed speculative bet on crude oil futures. Ameranth, as a hedge fund, was organized with the express purpose of taking speculative bets. There is some argument about whether it was wise to take the outsize position in a single market. But the failure of the firm was relatively simple to carry out. The business that was dissolved was the very business that had made the failed bet. There was no secondary impact from the bankruptcy on other operations of the firm. In the case of Metallgesellschaft, the speculation had been made by a relatively obscure division of the company. The liquidity crisis that arose threatened the continuing operation and investments in the many other core manufacturing operations of the firm. See Antonio Mello and John Parsons, “The Maturity Structure of a Hedge Matters: Lessons from the Metallgesellschaft Debacle,” Journal of Applied Corporate
The trading operation is able to expand the size of its book without obviously requiring that the company go out and raise new capital. All too often corporate management does not properly debit the trading operations for the full cost of capital from running the trading operations.
A related problem arises for a commodities trading business that shares operating control of the company’s assets with other business units. The trading business tends to exploit the physical assets or supply and related commitments of the other business units as it executes its proprietary trades. Because it claims to be leveraging unused assets, it is not charged a ‘fair’ price for its use. This leveraging almost never involves simply making use of unused facilities. Moreover, because the trading operation, in its other capacity, is supposed to be providing market intelligence and helping to shape the investment and operating decisions of the firm, its interest in the performance of its proprietary portfolio reshapes the recommendations made. There is feedback with the trading operations having input to the original investments made in these facilities, and to the terms of contract rights, and the trading operation’s use of these facilities alters how the facilities are used generally, crowding out or compromising other uses. The additional costs are charged to the other operating business units, although the investments are made for the purpose of expanding or benefitting the proprietary trading. The management of the trading operation often takes a leading role in shaping the strategy for the integrated business, although the trading unit’s own performance is evaluated on the basis of only one piece of the overall business.
Constellation’s Changing Strategy for its Commodity Trading Operations
A number of different figures reflect Constellation’s increasing emphasis on proprietary trading as a source of growth.
First, is the growing volume of profit attributable to proprietary trading. Although Constellation’s trading operations were originally integrated both with generation and wholesale power marketing in the fashion described earlier, it had always run a small proprietary trading portfolio as an element of the business.29 However, the results of this proprietary trading were never separately reported in Constellation’s financials. As Constellation moved to restructure its financial reporting and promote the trading operations, it began to report gross margin on its proprietary trading portfolio.30 In doing so, it also produced historical figures for 2003, 2004 and 2005. Figure 11 shows these gross margin results. Between 2003 and 2007, the gross margin attributed to proprietary trading grows by an annual average rate of 74%. Including Constellation’s forecasted gross margin out to year-end 2008, the average annual growth rate would be 52%.
Second, is the growing amount of risk attributable to proprietary trading. Figure 12 shows Constellation’s calculated Value-at-Risk on its proprietary trading portfolio
29
For example, the 2001 Form 10-K report says that CPS also trades “to take advantage of arbitrage opportunities that exist across different markets.” In 2003, the wording of this addition changed to “Within our trading function we allow limited risk-taking activities for profit. These activities are actively manager through daily value at risk and liquidity position limits.” In 2005, this wording changed to “As part of our risk management activities, we trade energy and energy-related commodities and deploy risk capital in the management of our portfolio in order to earn additional returns. These activities are managed through daily value at risk and stop loss limits and liquidity guidelines, and could have a material impact on our financial results.” All of these phrases betoken proprietary trading. Nevertheless, these activities remained a minor element of Constellation’s total business.
30
Constellation reports results for Portfolio Management and Trading. The results for portfolio
management represent gains on management of the hedged portfolio of sales of generation and supply of load. By definition, gains on the management of a hedged portfolio are the same thing as profits on a proprietary portfolio, so I treat this as one and the same thing.
together with the Value-at-Risk on its total mark-to-market portfolio which includes some of the hedges of its generation and load serving contracts. The data is shown quarterly from 2004 through the second quarter of 2008. A VaR based on a 99% confidence interval and a 1-day holding period is shown, together with a VaR based on a 95% confidence interval and a 1-day holding period. The average annual growth from 2004 through the second quarter of 2008 is 69%, a startling rate over a 3 and one-half year period.31
Third, is the growing contingent collateral requirement at Constellation. Figure 13 shows this trend. For example, looking back over the years 2002-2004, the average contingent collateral call in the event of a rating downgrade to below investment grade was $731 million, while over the years 2005-2007 the average contingent collateral call was $1,424 million. So even before the misreporting in 2008 and the rise in risk associated with the coal contracts, the average level of the contingent collateral call had nearly doubled. Then in the first two quarters of 2008 it doubled again.32 Not all of this is associated exclusively with the proprietary trading portfolio. Every part of Constellation’s business could have contributed to this contingent collateral requirement. At the end of the second quarter of 2008, Constellation explained that generation was responsible for 10-15% of collateral required, load serving was responsible for 25-35%,
31
The figure shown is taken directly from the “Constellation Energy 2008 Analyst Meeting Supporting Materials,” August 27, 2008. The corresponding annual and quarterly values for the average 99% VaR on the trading portfolio and both the average 99% VaR and the average 95% VaR on the total mark-to-market portfolio can be found in the Form 10-Ks and Form 10-Qs for the various years 2004-2007 and quarters 2008Q1 and 2008Q2. The growth rate reported is based on these values.
32
Constellation Form 10-Ks for the respective years and Form 10-Qs for the quarters in 2008. For 2004 and 2005, a downgrade to below investment grade was a two step downgrade, while for the other years it was a three step downgrade.
coal and international freight for 25-35% and proprietary trading for 25-35%.33 We don’t know the corresponding breakdown for contingent collateral.
Fourth, is the actual level of liquidity Constellation maintained on its balance sheet as a necessary precaution. Figure 14 is a chart produced by Constellation showing its cash balances plus its available lines of credit which are its two sources of liquidity. Also shown is the used portion of its lines of credit. The difference between them measures its Excess Liquidity. Clearly the Excess Liquidity was overall increasing through time. The large increase at year end 2006 is due to cash receipts from the sale of the natural gas generation units and a timing mismatch with the planned use of this cash to pay down debt and fund capital expenditures. Constellation refers to the portion of the Excess Liquidity associated with this timing mismatch as Transitional Liquidity and refers to the net of Excess and Transitional as the Net Available Liquidity. By the end of 2007 the Transitional Liquidity is almost entirely gone, so that the difference between the Net Available Liquidity and the Excess Liquidity are nearly identical. Figure 15 shows the Net Available Liquidity from 2001 through the second quarter of 2008. Between 2003 and 2007 Constellation was increasing its net available liquidity.
The liquidity Constellation maintained on its balance sheet is a choice of management, and not a perfect reflection of the underlying risk of the business. Management may have over or underestimated the liquidity required, or have been fast or slow to respond to increasing or decreasing risk by provisioning the balance sheet. For example, in 2008, Constellation added to its credit lines, but immediately drew beyond
33
these additional lines, so that the Net Available Liquidity declined, despite the increasing risk exposure of its expanded trading operations.
Now that we have the larger picture of how Constellation was repositioning its trading operation with respect to its overall business strategy, we can explore whether this shift contributed at all to the company’s liquidity crisis and forced sale. The key questions at hand are:
• Were the proprietary trading and the larger Global Commodities operation truly as profitable as Constellation’s management understood it to be? Did Constellation properly calculate the risks in the proprietary trading portfolio and the larger Global Commodities operation, and so attribute to them enough risk capital?
• Did the proprietary trading and the larger Global Commodities operation put risks onto Constellation’s balance sheet that undermined the other parts of Constellation—the generation, load supply and regulated utility? Would it have been wiser to have separately capitalized the proprietary trading and the larger Global Commodities operation?
We look at each of these in turn.
The question of how to determine the right attribution of capital to different divisions or lines of business may seem relatively easy for certain industries, especially where each line of business has a large fixed asset base. But in certain industries the attribution of capital to different divisions or lines of business can be a vexing problem. One notable example is insurance. A multi-line insurance company must decide how to price each type of insurance. One component of the price set for each line is a return to the capital that the company must maintain to cover losses in the respective lines. But diversification across lines affects the total level of capital that must be maintained. The same problem exists for an investment bank with multiple trading desks. How should it determine the amount of capital charged to each desk? There is a large literature that has
developed to sort through this problem in both of these cases.34 The principles at hand for these two cases should have a general application to other types of businesses, such as Constellation and the wholesale power marketing industry more generally. But to date, there has been little if any literature showing how to make this application in practice.
Back in the years 2001 and 2002, we discovered that some of the merchant generators developing a trading business had not even made a rudimentarily adequate measure of the risk capital attributable to proprietary trading. Constellation certainly was a step ahead of that historical error. The January 2007 Analyst Presentation showed a preliminary analysis of the pro-forma risk capital required to support each of the three separate parts of the merchant business. Constellation estimated that the Commodities unit required between $900 million and $1.1 billion in risk capital. Compared against the forecasted 2007 EBITDA for this business of $342 million, as Constellation made the calculation, this would imply an extraordinary 31% rate of return on equity. Constellation’s benchmark for the required rate of return on equity in this line of business was 14-20%. Constellation believed that its forecasted 2007 EBITDA was conservative. It had calculated a realized EBITDA on the Commodities unit in 2006 of $553 million, and so was adjusting the forecast downward to recognize that 2006 had been an unusually good year.35
The publicly reported financials do not provide an adequate foundation with which to either critique or to validate Constellation’s own calculation of the capital
34
A good place to start is Merton, Robert C. and Andre Perold. 2001. “Theory of Risk Capital in Financial Firms” pp 438–454 in The New Corporate Finance, Where Theory Meets Practice, Edited by Donald H. Chew, Jr., McGraw-Hill and Myers, Stewart C. and James A. Read Jr. 2001. “Capital Allocation for Insurance Companies”, Journal of Risk and Insurance, Vol 68 no. 4, pp 545–580.
35