Publisher’s version / Version de l'éditeur:
The Journal of Physical Chemistry C, 114, 49, pp. 21042-21050, 2010-11-22
READ THESE TERMS AND CONDITIONS CAREFULLY BEFORE USING THIS WEBSITE.
https://nrc-publications.canada.ca/eng/copyright
Vous avez des questions? Nous pouvons vous aider. Pour communiquer directement avec un auteur, consultez la première page de la revue dans laquelle son article a été publié afin de trouver ses coordonnées. Si vous n’arrivez pas à les repérer, communiquez avec nous à PublicationsArchive-ArchivesPublications@nrc-cnrc.gc.ca.
Questions? Contact the NRC Publications Archive team at
PublicationsArchive-ArchivesPublications@nrc-cnrc.gc.ca. If you wish to email the authors directly, please see the first page of the publication for their contact information.
NRC Publications Archive
Archives des publications du CNRC
This publication could be one of several versions: author’s original, accepted manuscript or the publisher’s version. / La version de cette publication peut être l’une des suivantes : la version prépublication de l’auteur, la version acceptée du manuscrit ou la version de l’éditeur.
For the publisher’s version, please access the DOI link below./ Pour consulter la version de l’éditeur, utilisez le lien DOI ci-dessous.
https://doi.org/10.1021/jp106788u
Access and use of this website and the material on it are subject to the Terms and Conditions set forth at
Molecular-dynamics and first-principles calculations of raman spectra
and molecular and electronic structure of hydrogen clusters in
hydrogen clathrate hydrate
Wang, Jianwei; Lu, Hailong; Ripmeester, John A.; Becker, Udo
https://publications-cnrc.canada.ca/fra/droits
L’accès à ce site Web et l’utilisation de son contenu sont assujettis aux conditions présentées dans le site LISEZ CES CONDITIONS ATTENTIVEMENT AVANT D’UTILISER CE SITE WEB.
NRC Publications Record / Notice d'Archives des publications de CNRC:
https://nrc-publications.canada.ca/eng/view/object/?id=cb29850d-1238-4dc1-91e7-c58be9d7fabd https://publications-cnrc.canada.ca/fra/voir/objet/?id=cb29850d-1238-4dc1-91e7-c58be9d7fabdMolecular-Dynamics and First-Principles Calculations of Raman Spectra and Molecular
and Electronic Structure of Hydrogen Clusters in Hydrogen Clathrate Hydrate
Jianwei Wang,*,†Hailong Lu,‡John A. Ripmeester,‡ and Udo Becker†
Department of Geological Sciences, UniVersity of Michigan, 1100 North UniVersity AVe., Ann Arbor, Michigan, 48109, United States, and Steacie Institute for Molecular Sciences, National Research Council Canada, 100 Sussex DriVe, Ottawa, Ontario K1A 0R6, Canada
ReceiVed: July 21, 2010; ReVised Manuscript ReceiVed: October 25, 2010
Molecular-dynamics simulations and first-principles calculations are employed to understand vibrational spectroscopy and molecular and electronic structure of the encaged hydrogen molecules in hydrogen clathrate hydrate. The molecular-dynamics simulations, using empirical potentials, are performed to generate collections of the clathrate water cages with different hydrogen occupancies. The first-principles calculations, using Density Functional Theory with B3LYP hybrid density functionals for exchange and correlation, are carried out to optimize the structures and to calculate the Raman shift and activity of the stretching mode of the encaged hydrogen molecules. The Raman spectra are computed by a weighted moving average over a number of different structural configurations for different hydrogen occupancies. The results show that experimentally observed Raman peaks around 4120-4125 cm-1are from small cages with single H
2occupancy and peaks
around 4125-4150 cm-1from those in the large cages with one to four H
2molecules. The Raman peaks of
hydrogen molecules in the doubly occupied small cages are expected to be around or above the gas phase frequency 4155 cm-1. Molecular structural analysis shows that the single hydrogen molecule in the small
cages and single to quadruple hydrogen molecules in the large cage are encaged in loose cages, while double hydrogen molecules in the small cage are confined in a tight cage. Normal-mode analysis shows that there is limited vibrational coupling for H2 molecules in doubly to quadruply occupied large cages while a strong
vibrational coupling is observed in the doubly occupied small cage. The isovalue maps of total electron density and electrostatic potential suggest significant electron sharing between hydrogen molecules and water molecules, and important interaction between hydrogen and water oxygen atoms for confining the hydrogen clusters. The results help explain experimentally observed Raman spectra of hydrogen clathrates and provide new insights into the confinement effect by the water host framework on vibrational, molecular, and electronic properties of hydrogen molecules in the cages of clathrate hydrates.
Introduction
Hydrogen clathrate hydrates are inclusion compounds with hydrogen molecules occupying cages that are formed by hydrogen-bonded water molecules. The local hydrogen-bonding network of hydrogen clathrates is similar to that in ice Ih. The structures have been determined as being of clathrate hydrate type II.1Due to their comparably high hydrogen-storage capacity
(up to ∼5 wt %), hydrogen hydrates have a great potential to be used as a H2storage medium for clean energy technology.1-5
Unlike any other materials for hydrogen storage, hydrogen clathrate has only water and hydrogen molecules in the structure, and after combustion, hydrogen clathrate only releases water, so it is environmentally friendly. However, hydrogen clathrates are not well understood, and controversies remain about the H2
cage occupancy and the characterization of hydrogen-containing hydrates in general.5This lack of understanding prevents further
research and development of the hydrogen clathrate hydrates for energy applications since the H2cage occupancy directly
affects the hydrogen storage capacity.
Experimental results and theoretical calculations provide a consistent picture on the occupancy of the large cages, each of which can accommodate up to four H2(or D2) molecules in
pure H2(or D2) clathrate hydrate.1,2,6-8In contrast, conflicting
explanations of experimental results have been reported regard-ing maximum H2occupancy in the small cages in both pure
hydrogen hydrate1,6 and binary tetrahydrofuran (THF or
(CH2)4O)-hydrogen hydrates.3,4,9Inconclusive results have also
been reported from different theoretical studies. Patchkovskii and Tse,2Inerbaev et al.,10and Sebastianelli et al.11proposed
double occupancy, while Alavi et al.7and Papadimitriou et al.12
suggested single occupancy. On incorporating quantum correc-tions into the empirical potential, Alavi et al.7 carried out
molecular-dynamics simulations and concluded that a number of different cage-occupancy configurations are close in con-figurational energy,13such that one may expect that, in a bulk
sample, a number of these may in fact coexist. Indeed, recent experiments using Raman spectroscopy support a mixture of different hydrogen occupancies in the large cages.14,15However,
uncertainty regarding the optimal hydrogen occupancy in the small cages remains. Although most of the recent experiments support single occupancy in the small cages,3,14-16it is not clear
that hydrogen clathrate with hydrogen doubly occupied small cages is possible as previously reported in a high-pressure experiment.1There is also some uncertainty about the Raman
frequency range of hydrogen molecules in the doubly occupied small cages. This situation prevents appropriate Raman
char-* To whom correspondence should be addressed, jwwang@umich.edu.
†University of Michigan.
‡National Research Council Canada.
J. Phys. Chem. C 2010, 114, 21042
10.1021/jp106788u 2010 American Chemical Society Published on Web 11/22/2010
acterization of hydrogen clathrates and their research and applications.
Molecular modeling of the vibrational spectrum of the encaged H2molecules would provide the theoretical basis and
insights into these controversies. In addition, the fact that multiple H2molecules with very short H2-H2distances exist
inside the cages suggests a significant confinement effect and unconventional interactions. However, the nature of the forces that keep hydrogen molecules entrapped and that stabilize the clathrates remains elusive. It is also not clear as to what extent quantum effects control the occupancies and stabilities of the H2clusters. As a result, theoretical investigations are needed to
unravel the fundamental basis for hydrogen clustering in the clathrate cages.
In order to better understand the vibrational spectroscopy, the molecular and electronic structure, and the interactions between H2and H2O molecules and among the H2clusters in
the hydrogen clathrate, quantum-mechanical calculations on collections of isolated hydrogen-filled cages from pure H2
clathrate are carried out. Raman spectra, the molecular structure of hydrogen and water, total electron-density isovalue maps, and electrostatic-potential isovalue surfaces are calculated. The results provide a theoretical view of what roles the intermo-lecular electron sharing, intermointermo-lecular vibrational coupling, and electrostatic potentials from water play in confining highly condensed H2 clusters in the clathrate. Raman shifts and
vibrational coupling of the H2clusters in clathrate cages will
also provide important insights on different confinement effects of enclathrating H2molecules with respect to pressurizing the
molecules in condensed-phase hydrogen or hydrogen-filled ice phases.
Methods
Hydrogen clathrate has a type II hydrate structure (Figure 1a) with a space group Fd3m and two types of cages: the large one (L) is a hexakaidecahedron (51264) with 28 H
2O (Figure
1b) and the small one (S) is a pentagonal dodecahedron (512)
with 20 H2O (Figure 1c). The crystal structural unit cell has
136 H2O, with 16 S and 8 L cages. In the calculations, the initial
structure of the H2O framework is based on a refined sII
structure as obtained from X-ray single crystal diffraction,17and
the original guest molecules are replaced with H2molecules
near the centers of the S and L cages. The initial positions of water hydrogen atoms are randomly chosen while keeping each water molecules with two hydrogen atoms. In order to eliminate net dipole moment for the system with such a configuration, empirical-potential energy minimizations and molecular dynam-ics simulations at constant volume and finite temperature (NVT) are performed on a supercell with 2 × 2 × 2 unit cells of sII structure, using the GROMACS package,18the SPC/E model
for H2O,19,20and a simple point charge model for H2.7,21During
the simulations, the water oxygen atoms are fixed. With this procedure, the net dipole moment for the system is reduced to a minimum. The NPT runs without fixing oxygen positions are then equilibrated for 500 ps at 150 K and 200 MPa, within the stability field of the hydrogen hydrate;1 subsequently, the
equilibrated supercell is quenched. Because calculations with acceptable accuracy using first-principles techniques for the simulation supercell with over 500 atoms are currently not feasible, each of the cages with filled hydrogen molecules is isolated from the supercell. (These cages are treated using a quantum-mechanical cluster approach in this study (see below)). The structures of the cages are then optimized with the same force fields by energy minimization. For the energy
minimiza-tion, a steepest-descent algorithm is used. For the MD simula-tions, the time step is 0.5 fs. The cutoff distance for van der Waals’ interaction is 1.0 nm. The fast particle-mesh Ewald method is used for the electrostatic interaction.22 The time
constant for temperature coupling is set at 0.1 ps and the time constant for pressure coupling is 1.0 ps. Temperature coupling is achieved by using a Nose-Hoover extended ensemble. The isotropic Parrinello-Rahman scheme is used in pressure coupling. LINCS, an algorithm that resets bonds to their correct lengths after an unconstrained update, is used in the MD simulations. For general information on MD simulations and applications, please refer to books about MD simulation methods23,24 and our recent articles on MD applications.25-32
The density functional theory (DFT) calculations are per-formed on the empirical potential optimized cages with a two-level ONIOM model,33which is implemented in the
GAUSS-IAN 03 package.34,35In this model, atoms selected for the
high-level calculation have a larger basis set than those for the low level. In this study, the high level includes only the H2molecules
and the low level includes the H2O molecules. Closed-shell
spin-restricted DFT calculations are performed with B3LYP hybrid density functional for exchange and correlation,36 6-31++
G(2d,2p) basis set for the high level and 3-21+G(d,p) for the
Figure 1. Structure of clathrate hydrate sII. Red balls are oxygen atoms, and light gray balls are hydrogen atoms. One large cage and one small cage are highlighted with larger balls. Dotted blue lines are hydrogen bonds. (a) Crystal structure of sII hydrate. (b) A larger cage with four encaged hydrogen molecules. (c) A small cage with two encaged hydrogen molecules.
low level. Both the H2O framework and H2clusters are kept
flexible, and no constraints are applied to fix atomic positions or molecular orientations during the structural optimizations. This flexibility allows more accurate calculations of the Raman spectrum. However, the average size of each type of cages will also change and the effect on the properties of the hydrogen molecules will be discussed. Convergence is tested against criteria for the maximum force component, root-mean-square force, and maximum step component. The threshold for the maximum force is 0.00045 au, root-mean-square force 0.0003 au, and maximum displacement 0.0018 au. For each of the occupancies in the L cages (L0-L4), 11 cages are successfully
optimized. For the S cages, 19 S2, 29 S1, and 29 S0cages are
successfully optimized. These cages are collections of the structural configurations of L and S cages with different H2
occupancies.
With the optimized structures, Raman vibrational frequencies are computed by determining the second derivatives of the energy with respect to the Cartesian coordinates and then transforming to mass-weighted coordinates.34 The vibrational
analysis is achieved by diagonalizing the vibrational matrix
where Hij is the vibrational matrix, miis the mass of the ith atom, qiis the displacement of this atom in the x, y, and z directions, Etotalis the total energy of the system, Ukis the kth vibrational mode, and the eigenvalue λk is related to the vibrational frequencies by eq 3. This results in 3N - 6 vi-brational frequencies with three translational frequencies and three rotational frequencies for a system with N atoms. All translational frequencies and rotational frequencies are close to zero or less than 10 cm-1
. After projecting out translational and rotational modes, any imaginary frequency was checked and the related mode was visualized before the calculated frequen-cies were used for computing the average Raman spectrum. If an imaginary frequency is present in the frequency output, it has to be less than a few tens of wavenumbers (e.g., 50 cm-1),
which is usually around the upper limit of a translational mode using numerical integration.34If a calculation results in one or
more large imaginary frequencies (over 50 cm-1
), reoptimization with tight criteria was applied. Out of 92 calculations used for computing the averaged Raman spectra, there are three imagi-nary frequencies above 50 cm-1(from 65 to 95 cm-1). These
three modes do not involve major structural changes. Consider-ing that the systems are relatively large and weakly bonded by hydrogen bonds and van der Waals interactions, a small number of imaginary modes indicates that the optimizations have converged well enough for understanding the trend of vibrational properties of hydrogen in the hydrate, although better frequency calculations to eliminate any imaginary frequencies would be possible with significant additional computational effort.
Similar calculations using different basis sets and SPC/E empirical potentials for the low-level H2O molecules have also
been carried out. The absolute values of the Raman frequencies and differences between Raman peaks are noticeably dependent
on the basis sets or empirical potentials used for the low-level species. However, for all calculations, the relative Raman peaks shift directions (blue shift or red shift with respect to each other) are consistent. The basis set used for the results reported in this study reproduces the experimental Raman spectra well with affordable computational cost. Raman spectra in the H2
stretch-ing region are computed as a movstretch-ing average of calculated Raman frequencies, weighted with Raman activities, and normalized using the stoichiometric numbers of the cages in the compound. Although the numbers of the structural configu-rations are relatively small, statistically meaningful Raman spectra are obtained as discussed in the next sections. Electron density and electrostatic potential surface maps are generated from the optimized self-consistent field calculations.
Results and Discussion
Raman Spectra of the Encaged Hydrogen Molecules.The calculated Raman spectra are shown in Figure 2a, along with two experimental results from the literature (spectra b and c in Figure 2).1,37 A summary of the calculated spectra has been
reported.38Details of explanations and discussions of the spectra
are provided here along with some basic understanding for completeness. The calculated frequencies are scaled by a scaling factor because of well-documented systematic errors of the method.39,40The scaling factor for the methods employed in this
study is estimated to be 0.9367, the ratio between 4155 cm-1
of observed free H2gas and 4436 cm -1
of the calculated H-H stretching frequency of free isolated single H2. In the calculated
spectra (Figure 2a), the lowest frequency peak around 4100 cm-1
is from H2in the S1cages. The four peaks from 4125 to 4145 Hij) 1
√
mimj ∂2E total ∂qi∂qj (1) HijUk ) λ kUk (2) λ k )(2πυk) 2 (3)Figure 2. Raman spectra of hydrogen molecules in hydrogen clathrate hydrate. (a) Calculated spectra from quantum-mechanical calculations. The spectra are plotted as moving averages (the window size for averaging, 4 cm-1). The calculated frequencies are scaled by a factor
of 0.9367, the ratio between 4155 cm-1of free H
2gas and 4436 cm-1
of the calculated H-H stretching frequency of free isolated single H2.
Experiments by (b) Mao et al. (2002) and (c) Strobel et al. (2007). S1,
singly occupied small cage; S2, doubly occupied small cage; L1, L2,
L3, and L4, singly, doubly, triply, and quadruply occupied large cages.
The vertical dashed line indicates 4155 cm-1for free H 2gas.
cm-1
are from the L4cages. Two peaks from 4150 and 4157
cm-1are from the S2cages. Peaks from 4100 to 4145 cm-1are
from the L1, L2, and L3cages. For the two experimental spectra
shown in Figure 2b,c, the shapes and relative intensities vary significantly, although both of them were taken on samples of pure hydrogen hydrate.1,37However, the peak positions are, in
general, consistent between the two experiments (Figure 2b,c).1,37
The low-frequency end around 4120-4125 cm-1 of the
experimental spectra is assigned to H2in the S1cages and the
high-frequency end around 4125-4150 cm-1 to H
2in the L
cage (Figure 2), consistent with recent Raman spectroscopic studies of hydrogen clathrate.14,15However, overlap between
S1and L1-4peaks may occur as suggested by the calculations
(Figure 2a). This assignment is also consistent with assigning Raman peaks between 4120 and 4125 cm-1
to the H2singly
occupied small cages in THF hydrogen clathrate.37
Our calculated spectra are in qualitative agreement with the experimental observations in terms of relative peak positions and all the peaks from the S1and L1-4 cages are red-shifted
with respect to 4155 cm-1
of H2in the low-density gas phase.
Absolute values of the frequencies are, however, underestimated by ∼20 cm-1
for S1and ∼15-5 cm-1
for L1-4. The
underes-timations may originate from the isolation of the cages from the crystal, which causes the distances between guest gas and water molecules to be reduced because of neglecting intercage hydrogen bonding (more discussion later). The discrepancy between observations and the calculations may also arise from the limitations of the DFT method from its inaccuracy in describing weak dispersive intermolecular interactions and the effects from the static calculations at 0 K (e.g., the athermal limit). Ab initio calculations at the MP2 level or quantum Monte Carlo methods might provide a better description of the dispersive interactions of the systems. It is also noteworthy to mention that cage-occupancy-induced Raman-peak splittings cannot account for all features in the experimental Raman spectra. Incomplete reaction, sample inhomogeneity, and mul-tiple peaks due to a mixture of H2 molecules at different
rotational states (e.g., para-H2and ortho-H2) at finite temperature
contribute significant complications and variations of the observed Raman spectra. The quantum nature of the rotational states of the hydrogen molecules cannot be incorporated in the static DFT calculations presented here. In addition, the calculated spectrum is relatively broader than the observed spectrum because there are only a limited number of configurations considered. Nevertheless, as a qualitative guide for the relative trend of the observed Raman spectra, the calculated spectra are sufficient to be used for interpreting experimental results.
As shown in Figure 2, the Raman frequencies for the S2cages
are around 4150 and 4157 cm-1, well separated from the S1and
L4peaks. Considering the underestimates of the calculated
frequen-cies of the encaged H2, the Raman frequencies from the doubly
occupied small cage (S2) are expected to be around or above 4155
cm-1
, blue-shifted with respect to the gas phase hydrogen. The highest frequencies in the experimental spectra of pure hydrogen clathrates occur at ∼4150 cm-1
, suggesting that the characteristic peaks of S2are not present in the previous experiments.1,14,15,37A
more recent experimental result showed that, in addition to the Raman peaks from 4120 to 4150 cm-1
, there are two additional Raman peaks at ∼4153 and ∼4159 cm-1of the encaged
hydro-gen,41 which are around or above 4155 cm-1
of the gas phase frequency. These two peaks can be interpreted by the presence of two hydrogen molecules in the S2cages.41
We also note that the fine structure in the low-frequency band (4120-4125 cm-1
) of the experimental spectra is
time-depend-ent over a period of days to weeks if the sample is stored in liquid nitrogen, with the high-frequency shoulder around 4125 cm-1
becoming stronger with respect to the main peak around 4120 cm-1
, consistent with a recent study of hydrogen clathrate at low temperature.14,15This kind of behavior can be attributed
to very slow ortho- to para-H2 conversion, which involves a
change of H2 nuclear spins at lower temperature of samples
made at higher temperature.
Raman Shift and Confinement Effect.The red shift in H2
vibrational frequencies in hydrogen hydrate with respect to the gas phase observed in the experiments and predicted in our calculations is also observed for adsorbed hydrogen molecules at inorganic surfaces and for other gas molecular species in clathrate hydrate systems. For instance, H-H stretching is red-shifted by 60 cm-1for H
2molecules adsorbed in the cages of
zeolites42and red-shifted by 31 cm-1for those adsorbed at the
internal surface of Vycor glass.43In CH
4clathrate hydrate, C-H
stretching is red-shifted by 14 and 4 cm-1
in the large and small cages, respectively.44,45 At moderate pressure, a vibrational
frequency decrease of a molecule, perturbed by its local environment, often indicates a softened vibrational mode and a stretched intramolecular bond from the equilibrium of the isolated molecule. The molecule sees a potential energy surface where an attractive interaction with host molecules or surfaces is dominant. This is formalized in the so-called loose-cage tight-cage model.44,46In hydrogen clathrate, H
2vibrons in S1have
the largest red shift in the spectra (Figure 2), indicating that the molecules are loosely confined in a highly attractive potential field with little intermolecular repulsion. In L4, a smaller red
shift implies that the four H2molecules are still loosely confined
and the repulsive interactions play a small role to offset the attraction. The frequencies of H2 in L3, L2, and L1 are
successively shifted to lower wavenumbers from L4, indicating
that the repulsive interactions gradually decrease. The vibrons in S2, on the other hand, are actually blue-shifted, suggesting
that the attractive interaction is balanced by repulsive interactions between two H2and between H2and H2O in a tightly confined
space. Such a blue shift of Raman frequency of an encaged molecule in clathrate is not uncommon. For instance, for encaged propane (C3H8) in sII hydrate, the Raman stretching
frequency of the C-H in the large cage is blue-shifted by 7 cm-1
.47For CO
2in the large cage of sI, a blue shift of 96 cm -1
was observed for the C-O stretching mode.47The blue shift
for H2in S2indicates the two hydrogen molecules are confined
in a tight cage and the repulsive interaction is dominated. The relative shift of Raman frequencies of an encaged molecule in clathrates with respect to its gas phase is sensitive to the local molecular environment inside the cage.
Vibrational Coupling of Encaged Hydrogen Molecules.
Visualization of vibrational modes of the encaged hydrogen molecules reveals that there is a fundamental difference in intermolecular vibrational coupling between hydrogen molecules in S2and among those in L2-4. For the H
2molecules in L2-4,
the orientations of the H2molecules are geometrically frustrated
since it is difficult to achieve energetically equivalent geometric positions or same site symmetry for the nonspherical H2
molecules. There is very limited vibrational coupling, and each H2vibration is independent of the rest of the H2molecules. In
contrast, for the two H2in S2, a strong vibrational coupling is
observed in the calculations. All Raman calculations of 19 S2
cages, without exception, show that the mode around 4150 cm-1
originates from the out-of-phase vibration of the two H2. The
mode around 4157 cm-1corresponds to the in-phase vibration.
A schematic picture shows the in-phase and out-of-phase vibrational coupling in Figure 3.
The vibrational coupling of two hydrogen molecules in the S2cage is surprising for a molecular cluster. In solid molecular
hydrogen, in-phase coupled vibration is probed by Raman and out-of phase coupled vibration is probed by IR.48The difference
between IR and Raman frequencies provides a measure of intermolecular coupling.49At zero pressure, the difference is 3
cm-1
(out-of-phase minus in-phase frequencies), and it increases with increasing pressure (about 10 cm-1at 5 GPa).48The
out-of-phase vibration has a higher frequency in solid molecular hydrogen.48Our calculations for hydrogen molecules in clathrate
give a value of -7 cm-1
for the difference, with the in-phase vibration having a higher frequency. This result indicates a relatively strong coupling but with a completely different coupling scheme than the one in high-pressure solid H2. The
fundamental difference between the confinement effect and pressure effect is also evidenced by the fact that encapsulating hydrogen in clathrates mostly results in a stretching mode red shift while pressurizing solid hydrogen or hydrogen in ice always causes a blue shift.48,50,51
Structure of the Cages and Encaged H2 Clusters. The geometries of the DFT-optimized cages are similar to the hexakaidecahedron (L cage) and pentagonal dodecahedron (S cage) from X-ray crystallographic structures. However, the cages are deviated from the experimental geometries. The reason for such deviation is that experimental cage geometries are highly symmetric and averaged structures over an ensemble of different configurations while only a small number of cages are used in the simulations without symmetry constraint. In addition, the isolated cages lack of intercage hydrogen bonding interaction, which contributes to the deviation from those in the crystal
Figure 3. A schematic picture of in-phase and out-of-phase vibrational coupling of two diatomic molecules. The arrows are vibrational directions.
Figure 4. Statistical distributions of the distances from the center of the cages to the cage vertices of the water oxygen atoms: (a) the small cages and (b) the large cages. The vertical bars are the distances from the X-ray refined crystal structure.1,52
Figure 5. A comparison of the cage shape between a doubly occupied small cage (left) and a singly occupied small cage (right). The dashed circles are used as eye guides. The elongation of the doubly occupied cage is shown in the direction parallel to the line connecting the two H2molecules.
Figure 6. H2quadruply occupied large cage. The four H2molecules
are close to the four hexagons of the 51264cage. A depth cueing view
shows front and back molecules with different color saturation. The arrows point to the centers of the hexagons.
phase. The deformations can be qualitatively described by comparing calculated and experimental distances between the center of the cage and the oxygen atoms at the vertices of the cage. As shown in Figure 4, distributions of the distances are shown for different cages with different cage occupancies. For the small cages (Figure 4a), the values range from 3.4 to 4.2 Å as compared with three distances at 3.69, 3.79, and 3.90 Å as determined in experiments. The coordinates of the reference crystal structure are taken from refined X-ray structural data for the hydrate sII structure52and the unit cell parameter (17.047
Å) is from the synthesized hydrogen clathrate.1As the hydrogen
occupancy increases from S0and S1to S2, the distribution is
noticeably shifted to longer distances. For the large cages (Figure 4b), the distance is distributed from 4.0 to 4.9 Å, as compared with three distances at 4.56, 4.64, and 4.66 Å in the experimental crystal structure. As the hydrogen occupancy increases from L0, L1, L2, L3, to L4, the distribution is also noticeably shifted
to longer distances. By visualizing the optimized structures for both large and small cages, we do not observe significant geometric deviations from the crystal structure except for the small cages with two hydrogen molecules. For S2, the cages
are noticeably elongated along one direction, shown as two peaks around 3.62 and 3.96 Å in Figure 4a, which is parallel to the direction of connecting the centers-of-mass of the two hydrogen molecules. Therefore, the overall geometry for most of the optimized small cages (S2) deviates from a perfect
pentagonal dodecahedron. Figure 5 shows the S2cage
deforma-tion as compared with the S1cage. The estimated
root-mean-square deviations of the oxygen atom coordinates of the optimized S2cages from the X-ray structure are 0.02 Å for the
oxygen at 3.69 Å from the cage center, 0.01 Å for those at 3.79 Å, and 0.02 Å for those at 3.90 Å, with an average value of 0.02 Å.
Because isolated cage models are used, the intercage hydrogen bonding is neglected in the calculations, resulting in a systematic decrease in the size of the cages as compared with those in the crystal. The calculated average distances between the center of the cage and oxygen atoms at the vertices are smaller by 0.5-1.0% for the small cages and 1.8-2.3% for the large cages. This causes errors in the calculated Raman frequencies as compared with experimental observations as discussed before. The underestimations discussed previously on the Raman frequencies can be partially explained by the change of the cage
Figure 7. Correlation of the hydrogen intramolecular bond length with Raman vibrational stretching frequency. Up triangles are H2in S1; down
triangles are H2 in S2; circles are H2 in L1; squares are H2 in L2;
diamonds are H2in L3; hexagons are H2in L4. The error bars are 1
standard deviation. The actual estimated errors are about 1 order of magnitude smaller. The vertical thin dashed line is the calculated H-H bond length of isolated H2. The thick dashed line shows the overall
trend of Raman frequency as a function of H-H distance.
Figure 8. Electrostatic potential surfaces of the large (a and b) and small cage (c and d). Purple is for positive potentials and brown is for negative potentials. The isovalue is in atomic units at 0.06 (a and c) and 0.04 (b and d). The arrows point to negative potential regions within the cages.
size. Decrease in the distance between water oxygen atoms and encaged hydrogen molecules resulting from cage size reduction increases the negative potential on the hydrogen molecules from the lone pair region of the water oxygen atoms. This can cause the H2molecules to be in a more attractive potential field and
results in smaller Raman frequencies. This is evident from the fact that the underestimation is less (5 cm-1) for the fully
occupied L4 cage and more (15 cm-1
) for L1, where larger
underestimation is observed for the cage with greater cage size decrease. However, because the models and methods are consistent throughout the calculations for different types of cages with different occupancies, the trends and relative differences among Raman frequencies of different cages and occupancies are expected to be reliable even if the absolute values are only qualitative.
Structural analysis from our ab initio calculations shows that the H2 molecules are highly condensed in S2 and L4 cages,
consistent with previous experimental results and theoretical calculations.2,6,11In L4, four H
2molecules in the large cage form
a slightly distorted tetrahedron. Each of the H2molecules is
located near a face of a hexagon formed by the host water framework (Figure 6). In L3, the three hydrogen molecules in a
large cage form a triangle. Most of the H2molecules are still
near a hexagon formed by the host water framework but not as close as those in L4 cages. For large cages with two H
2
molecules and one H2molecule, no apparent association with
the hexagon is observed for hydrogen molecules inside the cages. For L4 cages, the calculated average H
2-H2 distance
between the centers of mass is 2.94 ( 0.11 Å, which is in
excellent agreement with 2.93 Å from a neutron diffraction study of D2 clathrate,6 and with 2.90-3.13 Å from a
quantum-chemistry study of H2clathrate.2Our theoretical calculations
are also in accord with the neutron diffraction result6that the
four H2 molecules in L4 form a tetrahedron. It needs to be
mentioned that this structural configuration is based on static calculations at the athermal limit. At higher temperatures, however, the thermal energy may partially or fully activate H2
rotational and translational motions.6For S2cages, the calculated
average H2-H2distance is 2.51 ( 0.03 Å, in good agreement
with a value of 2.57 Å from quantum diffusion Monte Carlo (DMC) calculations,11and 2.58 Å from a quantum-chemistry
calculation.2The H
2intramolecular bonds in L1-4 and S1are
stretched from the calculated gas phase equilibrium value, from 0.7436 Å to 0.7443 Å in L4, to 0.7449 Å in L3, to 0.7458 Å in
L2, to 0.7465 Å in L1, to 0.7468 Å in S1cages, or ∼0.1-0.4%
longer in L4-1and 0.4% longer in S1cages. The intramolecular
bonds in S2are compressed to 0.7427 Å or 0.1% shorter. The
vibrational frequency of the hydrogen-stretching mode correlates strongly with the hydrogen intramolecular bond length as shown in Figure 7. As the H-H bond length decreases, the frequencies increase linearly. Except for those in S2, all the encaged
hydrogen molecules are stretched with respect to the free molecules and the vibrational frequencies are red-shifted. This result is consistent with the argument discussed earlier that H2
molecules are loosely trapped in S1 and L4-1, and two H 2
molecules are tightly confined in S2. This is also consistent with
a Raman peak assignment that H2vibrons in S1and L4-1have
lower frequencies than those in S2cages.38
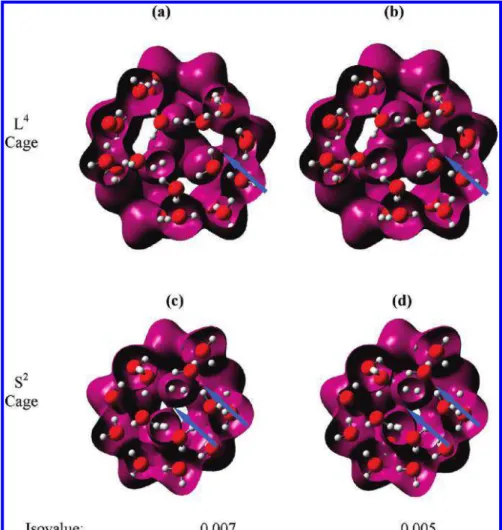
Figure 9. Electron density surfaces of the large (a and b) and small cages (c and d). Red balls are oxygen atoms and white balls are hydrogen atoms. The isovalue is in atomic units at 0.007 (a and c) and 0.005 (b and d). The arrows point to electron sharing regions within the cages.
Electrostatic Potential and Electron Density. The short intermolecular distances at 2.94 Å in L4and 2.51 Å in S2in the
clathrate are a dramatic decrease from an intermolecular distance (3.78 Å) in solid H2at low temperature.53This is equivalent to
a decrease of the intermolecular distances by ∼22% and ∼34% in L4 and S2 cages, respectively, or, corresponding volume
compressions by 53% and 71%, indicating fundamentally different intrinsic intermolecular interactions in hydrogen clath-rate as compared with those in solid H2. Interactions between
H2and an electrostatic potential field from water oxygen and
interactions arising from electron sharing among H2molecules
within the H2clusters are important for confining them in the
cages.
The electrostatic-potential isovalue maps are shown in Figure 8. There are noticeable negative electrostatic potential regions inside the cage in L4, near the O side of H
2O at an isovalue of
0.06 au (Figure 8a), and they become significant at an isovalue of 0.04 au (Figure 8b). The same trend for the electrostatic potential is also observed for S1and L1-3 cages. In contrast,
negative potential regions are absent inside the S2cage (Figure
8c,d) at the same isovalues. These two isovalues are chosen to demonstrate the changes of electrostatic potential. The difference indicates that the electrostatic potential from O of H2O
contributes more to the attractive interaction of H2molecules
in L4than in S2. This attractive interaction in L1-4 and S1is
also evidenced by the fact that the H2molecules are stretched
and that the H2 vibrons are not coupled with each other and
significantly softened with respect to the vibrons of free H2
molecules. The total electron density isovalue maps (Figure 9) show that the electron density surfaces in L4 are connected
between H2and H2O but not between H2molecules at isovalues
of 0.005 and 0.007 au (Figure 9a,b). The similar trend for the electron density is also observed for S1and L1-3cages. While
the surfaces in S2are noticeably connected between H
2and H2O
and between two H2 at an isovalue of 0.007 au, these
connections become substantial at an isovalue of 0.005 au (Figure 9c,d). Although the shared electron density is small, the result indicates that electron sharing between the H2
molecules in S2is more pronounced than in L4-2, arising from
the shorter intermolecular distance and stronger electronic interaction. As comparing electron density overlap in S1with
S2, and L1with L4, more overlap is observed in S2than in S1
and in L4 than in L1-3. A previous study shows that, in a
structure II hydrate, a significant electron density overlap between guest molecule and host water electron densities indicates instability for the hydrate.54Such significant overlap
is not evident for S1-2and L1-4occupancies (Figure 9). Accurate
thermodynamic stability assessment of different occupancies in the hydrate needs free energy calculation.
In summary, by combining quantum-mechanical calculations with classical molecular-dynamics simulations, average structure and vibrational spectra of H2in hydrogen clathrate are obtained.
The results show that the H2molecules in the large cages and
singly occupied small cages are stretched and the vibrational mode is softened and uncoupled. In the doubly occupied small cages, the H2 molecules are slightly compressed with the
vibrational frequencies close or above that of the free gas. The very short intermolecular distance between the two H2in the
small cages leads to strong vibrational coupling. The calculations suggest that doubly occupied small cages in the clathrate would be signaled by the presence of Raman peaks around or higher than 4155 cm-1. Innovative experimental methods may provide
an opportunity to test the theoretical prediction and to raise the hydrogen capacity from ∼3.4 wt % for the H2hydrate with S1
+ L4 occupancy configuration to ∼5 wt % with S2 + L4
configuration. The present work also shows a way to model a configurationally sensitive system with a collection of structures for better statistical average, which alleviates artificial effects from models based on a single structure.
Acknowledgment.This research was supported in part by the National Science Foundation through TeraGrid resources provided by NCSA and NICS. We acknowledge the support by the National Science Foundation NIRT Grant (EAR-0403732).
References and Notes
(1) Mao, W. L.; Mao, H.-K.; Goncharov, A. F.; et al. Science 2002,
297, 2247–2249.
(2) Patchkovskii, S.; Tse, J. S. Proc. Natl. Acad. Sci. U.S.A. 2003, 100, 14645–14650.
(3) Lee, H.; Lee, J.-W.; Kim, D. Y.; et al. Nature 2005, 434, 743– 746.
(4) Strobel, T. A.; Taylor, C. J.; Hester, K. C.; et al. J. Phys. Chem. B
2006, 110, 17121–17125.
(5) Struzhkin, V. V.; Militzer, B.; Mao, W. L.; et al. Chem. ReV. 2007,
107, 4133–4151.
(6) Lokshin, K. A.; Zhao, Y. S.; He, D. W.; et al. Phys. ReV. Lett.
2004, 93, 125503.
(7) Alavi, S.; Ripmeester, J. A.; Klug, D. D. J. Chem. Phys. 2005,
123, 024507.
(8) Sebastianelli, F.; Xu, M.; BaCic, Z. J. Chem. Phys. 2008, 129, 244706–244709.
(9) Ogata, K.; Hashimoto, S.; Sugahara, T.; et al. Chem. Eng. Sci. 2008,
63, 5714–5718.
(10) Inerbaev, T. M.; Belosludov, V. R.; Belosludov, R. V.; et al.
Comput. Mater. Sci. 2006, 36, 229–233.
(11) Sebastianelli, F.; Xu, M. Z.; Elmatad, Y. S.; et al. J. Phys. Chem.
C 2007, 111, 2497–2504.
(12) Papadimitriou, N. I.; Tsimpanogiannis, I. N.; Papaioannou, A. T.; et al. J. Phys. Chem. C 2008, 112, 10294–10302.
(13) Alavi, S.; Klug, D. D.; Ripmeester, J. A. J. Chem. Phys. 2008,
128, 064506.
(14) Giannasi, A.; Celli, M.; Ulivi, L.; et al. J. Chem. Phys. 2008, 129, 084705-084710.
(15) Strobel, T. A.; Sloan, E. D.; Koh, C. A. J. Chem. Phys. 2009, 130, 014506-014510.
(16) Florusse, L. J.; Peters, C. J.; Schoonman, J.; et al. Science 2004,
306, 469–471.
(17) Kirchner, M. T.; Boese, R.; Billups, W. E.; et al. J. Am. Chem.
Soc. 2004, 126, 9407–9412.
(18) van der Spoel, D.; Lindahl, E.; Hess, B.; et al. Gromacs user manual Version 3.3; University of Groningen, 2005; www.gromacs.org.
(19) Berendsen, H. J. C.; Postma, J. P. M.; van Gunsteren, W. F.; et al. Interaction models for water in relation to protein hydration. In
Intermo-lecular Forces; Pullman, B. , Ed.; Riedel: Dordrecht, 1981; pp 331-342. (20) Berendsen, H. J. C.; Grigera, J. R.; Straatsma, T. P. J. Phys. Chem.
1987, 91, 6269–6271.
(21) Silvera, I. F.; Goldman, V. V. J. Chem. Phys. 1978, 69, 4209– 4213.
(22) Essmann, U.; Perera, L.; Berkowitz, M. L.; et al. J. Chem. Phys.
1995, 103, 8577–8593.
(23) Allen, M. P.; Tildesley, D. J. Computer simulation of liquids; Clarendon Press: Oxford., 1987.
(24) Frenkel, D.; Smit, B. Understanding Molecular Simulation from
algorithms to applications; Academic Press: New York, 2002.
(25) Wang, J. W.; Kalinichev, A. G.; Kirkpatrick, R. J.; et al. Chem.
Mater. 2001, 13, 145–150.
(26) Wang, J.; Kalinichev, A. G.; Amonette, J. E.; et al. Am. Mineral.
2003, 88, 398–409.
(27) Kirkpatrick, R. J.; Kalinichev, A. G.; Wang, J. W. Mineral. Mag.
2005, 69, 289–308.
(28) Kirkpatrick, R. J.; Kalinichev, A. G.; Wang, J. W.; et al. Molecular modeling of the vibrational spectra of interlayer and surface species of layered double hydroxides. In Application of Vibrational Spectroscopy to
Clay Minerals and Layered Double Hydroxides; Kloprogge, J. T., Ed.; The Clay Mineral Society: Aurora, CO, 2005; Vol. 13; pp 239-285.
(29) Wang, J.; Kalinichev, A. G.; Kirkpatrick, R. J. Geochim.
Cosmo-chim. Acta 2006, 70, 562–582.
(30) Wang, J.; Rustad, J. R.; Casey, W. H. Inorg. Chem. 2007, 46, 2962– 2964.
(31) Kalinichev, A. G.; Wang, J. W.; Kirkpatrick, R. J. Cem. Concr.
Res. 2007, 37, 337–347.
(32) Wang, J.; Kalinichev, A. G.; Kirkpatrick, R. J. J. Phys. Chem. C
2009, 113, 11077–11085.
(33) Vreven, T.; Morokuma, K. J. Comput. Chem. 2000, 21, 1419–1432. (34) Frisch, M. J.; Trucks, G. W.; Schlegel, H. B.; et al. Gaussian 03
online manual; Gaussian, Inc.: Wallingford, CT, 2003.
(35) Foresman, J. B. Exploring chemistry with electronic structure
methods, 2nd ed.; Gaussian, Inc.: Pittsburgh, PA, 1996. (36) Becke, A. D. J. Chem. Phys. 1993, 98, 5648–5652.
(37) Strobel, T. A.; Koh, C. A.; Sloan, E. D. Fluid Phase Equilib. 2007,
261, 382–389.
(38) Wang, J.; Lu, H.; Ripmeester, J. A. J. Am. Chem. Soc. 2009, 131, 14132–14133.
(39) Merrick, J. P.; Moran, D.; Radom, L. J. Phys. Chem. A 2007, 111, 11683–11700.
(40) Wong, M. W. Chem. Phys. Lett. 1996, 256, 391–399. (41) Lu, H.; Wang, J.; Liu, C.; et al. Manuscript in preparation. (42) Kazansky, V. B.; Jentoft, F. C.; Karge, H. G. J. Chem. Soc., Faraday
Trans. 1998, 94, 1347.
(43) Huber, T. E.; Huber, C. A. Phys. ReV. Lett. 1987, 59, 1120 LP– 1123.
(44) Subramanian, S.; Sloan, E. D. J. Phys. Chem. B 2002, 106, 4348– 4355.
(45) Greathouse, J. A.; Cygan, R. T.; Simmons, B. A. J. Phys. Chem.
B 2006, 110, 6428–6431.
(46) Buckingham, A. D. Proc. R. Soc. London, Ser. A 1958, 248, 169. (47) Sum, A. K.; Burruss, R. C.; Sloan, E. D. J. Phys. Chem. B 1997,
101, 7371–7377.
(48) Mao, H.-K.; Hemley, R. J. ReV. Mod. Phys. 1994, 66, 671. (49) van Kranendonk, J. Solid hydrogen; Plenum: New York, 1983. (50) Hirai, H.; Ohno, S.; Kawamura, T.; et al. J. Phys. Chem. C 2007,
111, 312–315.
(51) Machida, S.-i.; Hirai, H.; Kawamura, T.; et al. J. Chem. Phys 2008,
129, 224505–224505.
(52) Mak, T. C. W.; McMullan, R. K. J. Chem. Phys. 1965, 42, 2732– 2737.
(53) Ishmaev, S. N.; Sadikov, I. P.; Chernyshev, A. A.; et al. J. Exp.
Theor. Phys. 1983, 84, 394.
(54) Greathouse, J. A.; Cygan, R. T.; Bradshaw, R. W.; et al. J. Phys.
Chem. C 2007, 111, 16787–16795. JP106788U