Publisher’s version / Version de l'éditeur:
ACS Applied Materials and Interfaces, 5, 8, pp. 2870-2880, 2013-03-13
READ THESE TERMS AND CONDITIONS CAREFULLY BEFORE USING THIS WEBSITE.
https://nrc-publications.canada.ca/eng/copyright
Vous avez des questions? Nous pouvons vous aider. Pour communiquer directement avec un auteur, consultez la première page de la revue dans laquelle son article a été publié afin de trouver ses coordonnées. Si vous n’arrivez pas à les repérer, communiquez avec nous à PublicationsArchive-ArchivesPublications@nrc-cnrc.gc.ca.
Questions? Contact the NRC Publications Archive team at
PublicationsArchive-ArchivesPublications@nrc-cnrc.gc.ca. If you wish to email the authors directly, please see the first page of the publication for their contact information.
NRC Publications Archive
Archives des publications du CNRC
This publication could be one of several versions: author’s original, accepted manuscript or the publisher’s version. / La version de cette publication peut être l’une des suivantes : la version prépublication de l’auteur, la version acceptée du manuscrit ou la version de l’éditeur.
For the publisher’s version, please access the DOI link below./ Pour consulter la version de l’éditeur, utilisez le lien DOI ci-dessous.
https://doi.org/10.1021/am302951k
Access and use of this website and the material on it are subject to the Terms and Conditions set forth at
Low-Temperature approach to highly emissive copper indium sulfide
colloidal nanocrystals and their bioimaging applications
Yu, Kui; Ng, Peter; Ouyang, Jianying; Zaman, Md. Badruz; Abulrob,
Abedelnasser; Baral, Toya Nath; Fatehi, Dorothy; Jakubek, Zygmunt J.;
Kingston, David; Wu, Xiaohua; Liu, Xiangyang; Hebert, Charlie; Leek,
Donald M.; Whitfield, Dennis M.
https://publications-cnrc.canada.ca/fra/droits
L’accès à ce site Web et l’utilisation de son contenu sont assujettis aux conditions présentées dans le site LISEZ CES CONDITIONS ATTENTIVEMENT AVANT D’UTILISER CE SITE WEB.
NRC Publications Record / Notice d'Archives des publications de CNRC:
https://nrc-publications.canada.ca/eng/view/object/?id=10633ab5-bcb2-48c1-95b0-7e32cbd1efd6
https://publications-cnrc.canada.ca/fra/voir/objet/?id=10633ab5-bcb2-48c1-95b0-7e32cbd1efd6
Low-Temperature Approach to Highly Emissive Copper Indium
Sulfide Colloidal Nanocrystals and Their Bioimaging Applications
Kui Yu,*
,†Peter Ng,
†Jianying Ouyang,
†Md. Badruz Zaman,
†,‡,§Abedelnasser Abulrob,
‡Toya Nath Baral,
‡Dorothy Fatehi,
‡Zygmunt J. Jakubek,
†David Kingston,
⊥Xiaohua Wu,
⊥Xiangyang Liu,
†Charlie Hebert,
†Donald M. Leek,
†and Dennis M. Whitfield*
,‡†
Emerging Technologies,
‡Life Sciences, and
⊥Engineering, National Research Council of Canada, Ottawa, Ontario, K1A 0R6,
Canada
*
S Supporting InformationABSTRACT:
We report our newly developed
low-temper-ature synthesis of colloidal photoluminescent (PL) CuInS
2nanocrystals (NCs) and their in vitro and in vivo imaging
applications. With diphenylphosphine sulphide (SDPP) as a S
precursor made from elemental S and diphenylphosphine, this
is a noninjection based approach in 1-dodecanethiol (DDT)
with excellent synthetic reproducibility and large-scale
capability. For a typical synthesis with copper iodide (CuI)
as a Cu source and indium acetate (In(OAc)
3) as an In source,
the growth temperature was as low as 160 °C and the feed
molar ratios were 1Cu-to-1In-to-4S. Amazingly, the resulting
CuInS
2NCs in toluene exhibit quantum yield (QY) of ∼23% with photoemission peaking at ∼760 nm and full width at half
maximum (FWHM) of ∼140 nm. With a mean size of ∼3.4 nm (measured from the vertices to the bases of the pyramids), they
are pyramidal in shape with a crystal structure of tetragonal chalcopyrite. In situ
31P NMR (monitored from 30 °C to 100 °C)
and in situ absorption at 80 °C suggested that the Cu precursor should be less reactive toward SDPP than the In precursor. For
our in vitro and in vivo imaging applications, CuInS
2/ZnS core−shell QDs were synthesized; afterwards, dihydrolipoic acid
(DHLA) or 11-mercaptoundecanoic acid (MUA) were used for ligand exchange and then bio-conjugation was performed. Two
single-domain antibodies (sdAbs) were used. One was 2A3 for in vitro imaging of BxPC3 pancreatic cancer cells. The other was
EG2 for in vivo imaging of a Glioblastoma U87MG brain tumour model. The bioimaging data illustrate that the CuInS
2NCs
from our SDPP-based low-temperature noninjection approach are good quality.
KEYWORDS:
CuInS
2nanocrystals, quantum dots, diphenylphosphine sulphide, in vitro imaging, in vivo imaging
1. INTRODUCTION
Colloidal semiconductor nanocrystals (NCs), such as I−III−VI
CuInS
2NCs which are cadmium-free and lead-free, have
attracted significant attention for their potential in a wide range
of applications.
1−12With a bulk exciton Bohr radius of ∼4.1
nm, CuInS
2NCs could exhibit significant quantum
confine-ment effect (QCE) when they are smaller than ∼8 nm;
furthermore, with a bulk direct bandgap of ∼1.5 eV (827 nm),
CuInS
2NCs could be tuned to emit from the visible to
near-infrared (NIR) spectral range. Recently, in vivo imaging of mice
sentinel lymph node suggested that CuInS
2/ZnS NCs exhibited
reduced toxicity, as compared to CdTeSe/CdZnS QDs.
8Thus,
with high absorption coefficients, CuInS
2NCs are good
candidates as fluorescent contrast agents for biolabeling/
imaging.
7−12Various synthetic methods to emissive CuInS
2NCs have
been reported and are summarized in Table S1 in the
Supporting Information.
7,13−25These methods required
reaction temperatures as high as 200−240 °C, and the resulting
CuInS
2NCs typically exhibit emission quantum yields (QYs) ≤
10%. Thus, there is a significant demand for the development of
lower temperature synthesis of brighter CuInS
2NCs.
Diphenylphosphine (DPP), a commercially available secondary
phosphine, has been applied actively in our laboratories and a
few other groups to promote various semiconductor NCs
including PbSe,
26−29PbSeS,
30−32PbSeTe,
32PbSTe,
32ZnSe,
33ZnSeS,
34CdS,
35and CdSe,
36,37with high particle yield and
high synthetic reproducibility via a noninjection-based
approach in 1-octadecene (ODE) at low temperature.
Herein, we report our newly developed, low-temperature,
non-injection-based one-pot approach to
highly-photolumines-cent CuInS
2NCs. The synthesis was carried out in
1-dodecanethiol (DDT, CH
3(CH
2)
11SH, RSH) instead of
ODE, with diphenylphosphine sulfide (SDPP) as a sulfur
Special Issue: Forum on Biomedical Applications of Colloidal Photoluminescent Quantum Dots
Received: December 3, 2012
Accepted: February 21, 2013
Published: March 13, 2013
precursor made from elemental S and DPP. To the best of our
knowledge, the present study is the first using SDPP to
synthesize CuInS
2NCs at temperature as low as 160 °C.
Extensive optimization of experimental parameters such as
various Cu (I), Cu (II), and In (III) source compounds,
Cu-to-In-to-SDPP feed molar ratios, SDPP concentrations, and
alternative solvents/ligands (including ODE, oleic acid (OA),
and oleylamine (OLA)) suggested an optimal approach in
DDT with the feed molar ratio of 1CuI-to-1In(OAc)
3-to-4SDPP, as shown by eq 1. The resulting CuInS
2NCs dispersed
in toluene exhibited QY as high as 23%. Structural and
compositional characterizations by transmission electron
microscopy (TEM), X-ray diffraction (XRD), X-ray
photo-electron spectroscopy (XPS), and energy-dispersive X-ray
spectroscopy (EDX) were performed. The resulting CuInS
2NCs are gradiently-alloyed with Cu locating more on the inner
part and In more on the outer layer. Both in situ
high-resolution
31P NMR with
1H decoupling and in situ absorption
measurements testify that the reactivity of CuI/DDT toward
SDPP in DDT is lower than that of In(OAc)
3/DDT.
Furthermore, in situ high-resolution
31P NMR suggests that
the combination of Cu−S and In−S monomers leads to
nucleation/growth of the alloyed CuInS
2NCs, as shown in
Scheme 1.
+ + →
‐ ‐ ‐ ‐ °
CuI/DDT In(OAc) /DDT SDPP CuInS NCs (1Cu to 1In to 4S, 160 C, in DDT)
3 2
(1)
The developed CuInS
2NCs were applied to in vitro and in
vivo imaging, with well-established cancer model systems. After
coating with a ZnS shell, the resulting CuInS
2/ZnS NCs were
transferred into water and then bio-conjugated with single
domain antibodies (sdAbs). As outlined in our previous
papers,
38,39sdAbs, such as EG2 and 2A3, have favorable
chemical and physical properties for QD-based bio-imaging
applications. EG2 was raised against the epidermal growth
factor receptor (EGFR), which is a known tumor marker. 2A3
was raised against carcinoembryonic antigen-related cell
adhesion molecule 6 (CEACAM6), a known tumor associated
antigen of pancreatic cancer.
40,41In the present study,
pancreatic cancer cell lines were used to assess in vitro imaging
with QD-2A3 bio-conjugates, and a Glioblastoma U87MG
delta EGFR model for in vivo imaging of brain cancer in mice
with QD-EG2 bioconjugates.
2. RESULTS AND DISCUSSION
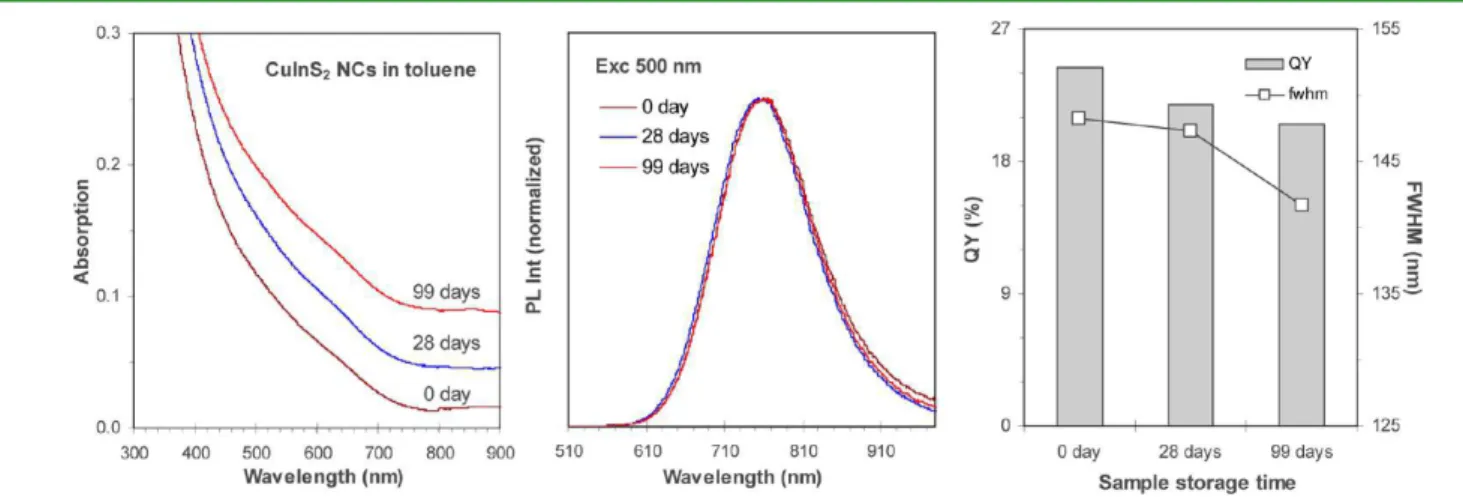
Figure 1 shows the optical properties of one CuInS
2NC
ensemble from our low-temperature noninjection approach
shown in eq 1. The growth was at 160 °C for 120 min, with a
[Cu + In] concentration of 106 mmol/kg in DDT and 1CuI/
DDT-to-1In(OAc)
3/DDT-to-4SDPP feed molar ratios. The
as-synthesized sample emitted at 768 nm with its
photo-luminescent (PL) QY in toluene estimated to be ∼23.2%
(based on dye Oxazine 170 in ethanol with 60% QY).
42The
CuInS
2NCs exhibited good storage stability, as monitored after
dark storage at −30 °C for ∼3 months.
Figure S1A in the Supporting Information shows the
temporal evolution of the optical properties of the
as-synthesized CuInS
2NCs from another batch of the eq 1
approach with the same 1CuI/DDT-to-1In(OAc)
3/DDT-to-4SDPP feed molar ratios but a [Cu + In] concentration of 72
mmol/kg in DDT. Eleven samples were taken from 50−160
°
C, and the nucleation/growth took place at temperature lower
than 50 °C. A persistent increase in photoemission QY is
worthy of notice, as demonstrated in Figure S1A (bottom left)
in the Supporting Information. Such an increase from Sample 5
(120 °C/15 min) to Sample 11 (160 °C/120 min) is similar to
what was observed during the growth of Zn
xCd
1−xS gradiently
alloyed QDs
43and CdTe/CdSe core−shell QDs.
44Figure S1B
in the Supporting Information demonstrates the good synthetic
Scheme 1. Schematic Drawing of the Formation of the
CuInS
2NCs via the Combination of the Two Monomers of
Cu−S and In−S. The Valence of Cu and In Is Not Addressed
Here. The Combination of Monomers Leading to
Nucleation and Growth Was Proposed before for Binary and
Ternary NC Systems
26,27,34,37Figure 1.Optical properties of the resulting CuInS2NCs from the eq 1 approach with [Cu + In] 106 mmol/kg in DDT and 1CuI-to-1In(OAc)3
-to-4SDPP feed molar ratios. The growth was at 160 °C for 120 min, and the PL QY was estimated to be ∼23% for the as-synthesized NCs. The absorption (left, offset) and emission (middle, normalized) measurements were performed at 0 day (as-synthesized), and after 28 and 99 days storage in the dark at −30 °C, with one identical sample concentration of 3 μL of the crude reaction mixture dispersed in 1.0 mL of toluene.
reproducibility with the comparison of the two synthetic
batches, namely the relatively large-scale batch shown in Figure
1 and the relatively small-scale batch shown in Figure S1A in
the Supporting Information. The former was 1.5 times of the
[Cu + In] concentration and 3.5 times of the volume of the
latter. Although two samples were taken from the former and
11 samples from the latter, both the two samples with 120 min
growth at 160 °C exhibited emission peaking at ∼760 nm with
∼
144 nm FWHM.
It should be pointed out that, for the eq 1 approach, the Cu
and In precursors could be in the form of Cu-SR and
[In]-(SR)
n(n = 1−3, RSH = DDT), respectively, after the two
mixtures of CuI and DDT, and In(OAc)
3and DDT were kept
at 65 °C under a strong vacuum (∼50 mTorr) for at least 1 h.
We symbolize preferably CuI/DDT as the Cu precursor and
In(OAc)
3/DDT as the In precursor, due to the possible
presence of I
−and OAc
−without purification. Furthermore,
being a sulphur precursor, SDPP is much more reactive than
DDT, as evidenced by the substantial decrease in nucleation
temperature. As shown in Figure S1C (top left) in the
Supporting Information, with DDT as a sulphur source and
with CuI and In(OAc)
3as the respective Cu and In sources, the
nucleation of CuInS
2NCs in ODE took place at ∼180 °C.
Therefore, the optimal growth temperature with SDPP as the
sulfur source could be reduced to 160 °C, which is appreciably
lower than the typical CuInS
2NC growth temperature of 200−
240 °C.
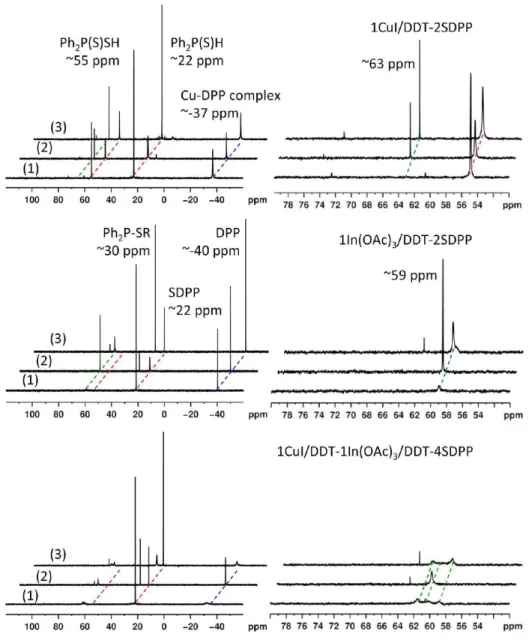
7,13−25Figure 2 presents
31P NMR spectra with
1H decoupling in
situ collected from three reaction mixtures of 1CuI/DDT +
2SDPP (top), 1In(OAc)
3/DDT + 2SDPP (middle), and 1CuI/
DDT + 1In(OAc)
3/DDT + 4SDPP in DDT (bottom). 85%
H
3PO
4was used as an external standard and the spectra were
collected when the temperature was increased from 30 °C (1)
to 100 °C (2) and back to 30 °C (3). As shown in the top-right
part of Figure S2 in the Supporting Information, three
phosphorous-containing species were readily detected in the
SDPP stock solution made from a mixture of 1S-to-1DPP (feed
molar ratio); they are SDPP (Ph
2P(S)H, ∼22 ppm)
34,35as a
Figure 2.In situ31P NMR with1H decoupling of three reactions of 1CuI/DDT-2SDPP with [Cu] ∼74 mmol/kg (top), 1In(OAc)
3/DDT-2SDPP
with [In] ∼21 mmol/kg (middle), and 1CuI/DDT-1In(OAc)3/DDT-4SDPP with [Cu + In] ∼38 mmol/kg (bottom). The spectra (left) were
collected when the temperature was increased from 30 °C (1) to 100 °C (2) and back to 30 °C (3), as indicated. The regions of 50−80 ppm in the right panel display probable Cu−S and In−S complexes formed.
major component (76%), diphenyldithiophosphinic acid
(Ph
2P(S)SH, ∼55 ppm)
34,45as a minor component (11%),
together with DPP (13%, approximately −40 ppm).
26,27,29Also,
trace amounts of one unknown species (∼61 ppm) and
Ph
2P(S)OH (∼73 ppm)
46were detected, the latter of which
could be the result of the oxidation of Ph
2P(S)H.
As shown in the top panel of Figure 2, the
1CuI/DDT-2SDPP reaction mixture at 30 °C (1) exhibits appreciable peaks
at −36.9 ppm (a Cu-DPP complex),
47,4822.8 ppm (Ph
2
P(S)-H), 54.9 ppm (Ph
2P(S)SH), 60.6 ppm (the unknown from the
SDPP stock solution), and 72.5 ppm (Ph
2P(S)OH). The
formation of the Cu-DPP complex is supported by two
mixtures of 1CuI/DDT-to-3DPP and 1CuI/DDT-to-6DPP
with low-temperature in situ
31P NMR measurements which are
presented in the left panel of Figure S2A in the Supporting
Information. The two spectra (1) and (3) collected at 30 °C
before and after heating to 100 °C illustrate the decrease of
Ph
2P(S)SH with a little change of Ph
2P(S)H, and the
appearance and increase of the ∼63 ppm peak (CuS
2PPh
2).
49,50As shown in middle panel of Figure 2, the In(OAc)
3/DDT-2SDPP reaction mixture at 30 °C (1) displays three noticeable
peaks at −40.3 ppm (DPP), 21.3 ppm (Ph
2P(S)H), and 58.9
ppm ([In]-(S
2PPh
2)
xwith 1 ≤ x < 3). The chemical shift of
In(S
2PPh
2)
3in CDCl
3was reported to be δ = 68.9 ppm.
51The
sharp DPP (approximately −40 ppm) peak suggests the
absence of an In-DPP complex. The disappearance of the
peaks of ∼73 ppm (Ph
2P(S)OH), ∼61 ppm, and ∼55 ppm
(Ph
2P(S)SH), together with the decrease of the ∼23 ppm peak
(Ph
2P(S)H), indicates the high In(OAc)
3/DDT reactivity. The
increase in the peak of ∼59 ppm and the DPP peak of ∼40
ppm stands for the formation of [In]-(S
2PPh
2)
xaccompanied
by the release of DPP, together with an increase of a substantial
peak at ∼29.5 ppm, which is assigned to Ph
2P-SR.
52The above
31P NMR study shown in Figure 2 illustrates that
the reactivity of In(OAc)
3/DDT is higher than that of CuI/
DDT, which could be explained by the hard-soft-acid-base
(HSAB) principle.
53Cu
1+is considered as a soft acid, In
3+a
hard acid, and DDT a soft base.
14,18Accordingly, the Cu-SR
bond should be stronger than the In-SR bond, and CuI/DDT is
less reactive than In(OAc)
3/DDT. Such reactivity difference
could be demonstrated by in situ absorption shown in Figure 3,
where nucleation did not take place for the 2CuI/DDT-4SDPP
mixture at 80 °C (left), but did for the 2In(OAc)
3/DDT-4SDPP (middle) and 1CuI/DDT-1In(OAc)
3/DDT-4SDPP
(right) mixtures at 80 °C.
As shown in the bottom panel of Figure 2, the
1CuI/DDT-1In(OAc)
3/DDT-4SDPP reaction mixture seems to be a
simple superimposition of the 1CuI/DDT-2SDPP (top) and
In(OAc)
3/DDT-2SDPP (middle) reactions. Spectrum (3)
discloses phosphorus-containing species including CuS
2PPh
2(∼62 ppm), In(S
2PPh
2)
x(∼59 ppm), Ph
2P-SR (∼29 ppm),
Ph
2P(S)H (∼22 ppm), and the Cu-DPP complex (∼-34 ppm).
The absence of addition reactions conveys essential information
on the probable formation mechanism of the CuInS
2alloyed
NCs, namely the combination of individual Cu−S and In−S
monomers formed leading to nucleation/growth shown in
Scheme 1.
27See the absorption and emission of the resulting
CuInS
2NCs shown in the bottom-right part of Figure S2 in the
Supporting Information; the ready formation of the CuInS
2NCs at low temperatures is worthy of notice. At the same time,
the relative peak shapes of approximately −37 ppm in the top
and bottom of Figure 2 of Spectrum (2) collected at 100 °C
and Spectrum (3) at 30 °C are interesting. The significant
difference of approximately −37 ppm at 30 °C of the two
Spectra (3) indicates two different environments, where the
phosphorous-containing species moved faster in Figure 2, top
(without the formation of nanoparticles) than in Figure 2,
bottom (with the formation of nanoparticles). At 100 °C, the
environment effects decreased with two sharp approximately
−
37 ppm peaks in the top and bottom of Figure 2. The
sharpness of NMR peaks is sensitive to environment and
conformational exchange.
To explore the growth, we performed another batch that was
similar to that shown in Figure 1 but with [Cu + In] 141
mmol/kg, and samples were taken at 100 °C/15 min (Sample
1), 160 °C/15 min (Sample 2), and 160 °C/120 min (Sample
3). The optical properties of the three samples are presented in
Figure S4A in the Supporting Information, together with
dark-fi
eld TEM images in Figure S4B in the Supporting Information.
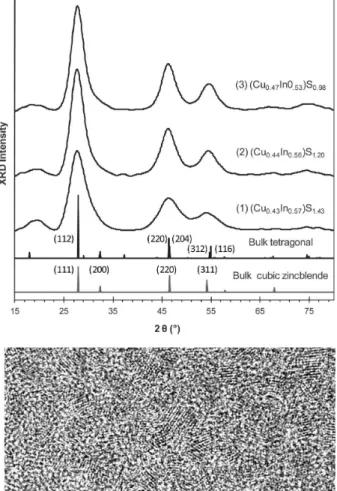
Figure 4, top, shows the powder X-ray diffraction (XRD)
patterns of the three samples purified, together with that of
bulk CuInS
2. The CuInS
2NCs seem to have a tetragonal
chalcopyrite crystal structure, as suggested by the XRD pattern
and the pyramidal shape revealed by TEM (see Figure S1B in
the Supporting Information). Along the growth from 100 °C to
160 °C, the XRD peaks become narrower, indicating an
Figure 3.In situ observation of the nucleation/growth of the NCs from three batches at 80 °C. With a [Cu + In] concentration of 10 mmol/kg, the three batches are 2CuI/DDT-4SDPP (left), 2In(OAc)3/DDT-4SDPP (middle), and 1CuI/DDT-1In(OAc)3/DDT-4SDPP (right). The absorption
increase in size. It is well-known that Cu
+and In
3+have similar
radii;
13thus, these three samples exhibited similar diffraction
peak positions.
Table 1 summarizes the diameters of the nanocrystals
estimated from the diffraction peak (112) of ∼2.8 nm (Sample
1), ∼3.2 nm (Sample 2), and ∼3.4 nm (Sample 3), together
with their compositions studied by energy dispersive X-ray
spectroscopy (EDX) and X-ray photoelectron spectroscopy
(XPS). The three samples exhibited similar EDX Cu/(Cu + In)
atomic ratios in the range of 0.45±0.02. Furthermore, such Cu/
(Cu + In) atomic ratios obtained from the
1CuI/DDT-to-1In(OAc)
3/DDT-to-4SDPP batch also suggest that the overall
amount of In is more than that of Cu and support that the
reactivity of CuI/DDT is lower than that of In(OAc)
3/DDT, in
agreement with our
31P NMR (Figure 2) and in situ absorption
(Figure 3) measurements.
At the same time, the three samples exhibited XPS Cu/(Cu +
In) atomic ratios of 0.21 for Sample 1 and 0.30 for Samples 2
and 3. With EDX more sensitive to bulk and XPS to surface,
the larger values of EDX than XPS Cu/(Cu + In) atomic ratios
suggest inhomogeneity of the distribution of Cu and In,
together with an increase of In from the center of a NC toward
the surface. Note that we reported ZnCdS gradiently alloyed
NCs with more reactive Cd rich in the inner region of a NC
and less reactive Zn rich on the outer region of a NC.
43Cd is
much more reactive than Zn; such an increase in less reactive
Zn from the center to the surface is easier to understand.
CuInS
2NCs with In rich on their outer region were
documented and supported by EDX and XPS.
22The Cu
vacancy has been acknowledged as one of the main defects in
CuInS
2NCs.
54,55The filling of Cu vacancy by In or Zn
(through cation exchange) has been employed to achieve
higher PL emission QYs; such substitution may widen the band
gap at the same time.
22,25Here, In
3+may substitute efficiently
the Cu
1+vacancy especially on the NC surface because of
diffusion during reaction; such a compositional feature of our
CuInS
2NCs with the probable gradient distribution of more
In
3+on the surface rather than Cu
1+could be the very reason
for the relatively high PL QY.
Figure 4, bottom, demonstrates a typical TEM image of the
sample presented in Figure 1. The CuInS
2NCs exhibit high
crystallinity with a mean size of 3.4 ± 0.4 nm estimated from
the pyramidal shape.
18,56The composition of this sample was
determined by EDX to be Cu
0.44In
0.56S
1.17.
For the bright CuInS
2NCs from the eq 1 approach,
extensive efforts were carried out, as shown in Figures S3A in
the Supporting Information to S3K. See Figure S3A, B in the
Supporting Information for the CuI/DDT-to-In(OAc)
3/DDT
feed molar ratio effect, Figure S3C in the Supporting
Information for 1CuI/DDT-to-1In(OAc)
3/DDT-to-xSDPP
feed molar ratio effect, Figure S3D−F in the Supporting
Information for the nature of the reaction medium effect, and
Figure S3G−K in the Supporting Information for the effect of
the different Cu and In source compounds explored. For the
four batches shown in Figure S3B in the Supporting
Information with the feed molar ratios of
xCuI-(2-x)In-(OAc)
3-4SDPP, where x = 1.5, 1, 0.5, and 0.2, Batch
1CuI-1In(OAc)
3-4SDPP is superior regarding the quantum yield of
the 160 °C/120 min samples. This should be related to the fact
that In(OAc)
3/DDT is more reactive than CuI/DDT. For the
fi
ve batches shown in Figure S3C in the Supporting
Information with the feed molar ratios of 1CuI-1In(OAc)
3-xDPPS, where x = 0.5, 1.2, 2, 4, and 8, again, Batch
1CuI-1In(OAc)
3-4SDPP is superior regarding the quantum yield of
the 160 °C/120 min samples.
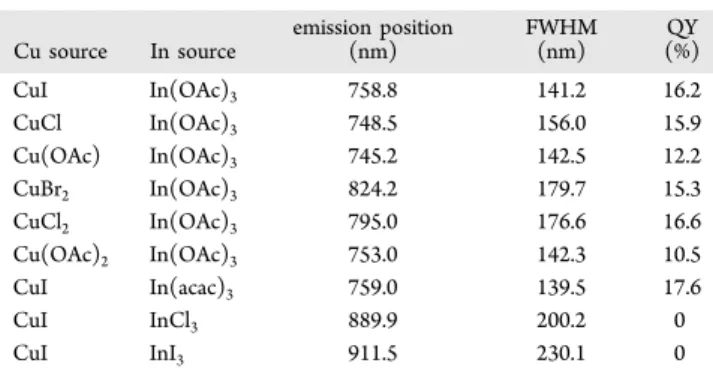
Table 2 summarizes the emission properties of the 160 °C/
120 min samples from the six synthetic batches shown in Figure
S3D, E in the Supporting Information. With the feed molar
Figure 4.(Top) Powder XRD patterns of the samples taken at 100 °C/15 min (1), 160 °C/15 min (2), and 160 °C/120 min (3), together with that of bulk tetragonal (JCPDS 85-1575) and cubic zincblende CuInS2as references indexed. The compositions estimated
by EDX are indicated. (Bottom) Typical high-resolution TEM image of the 160 °C/120 min CuInS2NCs; the scale bar is 5 nm.
Table 1. Compositions and Sizes of the Three Samples
Shown in Figure 4 XRD Spectra
sample growth compositionsEDX compositionsXPS XRD meansizes (nm) (1) 100 °C/15 min Cu0.43In0.57S1.43 Cu0.21In0.79S1.46 2.8
(2) 160 °C/15 min Cu0.44In0.56S1.20 Cu0.30In0.70S1.47 3.2
ratios of 1CuI-to-1In(OAc)
3-to-4SDPP, the increase of ODE in
DDT led to the decrease of the PL efficiency. Also, the
presence of OA or OLA in DDT resulted in the decrease of the
PL efficiency. Here OLA may react with SDPP,
37to solvate the
metal reagents,
57and increase the polarity of the reaction
media, leading to delayed nucleation. Therefore, DDT was
identified as the sole ligand and solvent to achieve controlled
nucleation/growth of CuInS
2NCs. Table 3 summarizes the
emission properties of the 160 °C/120 min samples from the
nine synthetic batches shown in Figure S3G−J in the
Supporting Information. Interestingly, EDX suggested
(Cu
0.45In
0.55)S
1.20from Batch 76DDT-to-24ODE (Table 2
with ∼13% QY) and (Cu
0.46In
0.54)S
1.19from Batch
CuI-to-In(acac)
3(Table 3 with ∼18% QY). These CuInS
2NCs
including those shown in Table 1 exhibit a strong deviation
from the ideal 0.5-to-0.5-to-1 chalcopyrite composition; such
deviation should have direct consequences on the optical
properties of the NCs.
Finally, we applied our CuInS
2NCs for in vitro and in vivo
bioimaging applications, based on our previous experience with
single-domain antibodies (sdAbs) for selective and efficient
cancer detection.
38−41ZnS coating was performed first and
then bio-conjugation with sdAbs EG2 or 2A3. Usually, for a
mean size core of ∼3.4 nm, its resulting core-shell NC was
estimated to be ∼6.6 nm leading to the shell thickness of ∼1.6
nm. EG2 is a IIama sdAb, which was raised against a
widely-known tumor marker, epidermal growth factor receptor
(EGFR); in the present study, EG2 was used for in vivo
brain tumor imaging. 2A3 was derived from a IIama sdAb
library to target carcinoembryonic antigen-related cell adhesion
molecule 6 (CEACAM6), a biomarker of pancreatic cancer; in
the present study, 2A3 was used for in vitro pancreatic cancer
cell imaging. Figure 5 demonstrates successful bioconjugation,
for example, with EG2, via the reduced mobility of
bio-conjugated versus non-bio-conjugated CuInS
2/ZnS QDs in agarose
gel electrophoresis.
See Figure S5 in the Supporting Information for the
characterization before and after ZnS coating and subsequent
bio-conjugation. For the ZnS coating,
7a mixture of zinc oleate
and zinc ethylxanthate was usually added dropwise to a reaction
fl
ask consisting of the CuInS
2NCs at 220 °C. An increase in PL
QYs to up to 60 % accompanied by blueshift in emission from
∼
770 nm to ∼710 nm was observed, as shown in Figure S5A in
the Supporting Information. The blueshift can be interpreted
by a reduction of the core size due to the cation exchange
between Zn and Cu/In.
16,22XRD of the core and core/shell
NCs, and bulk CuInS
2and bulk ZnS is shown in Figure S5B in
the Supporting Information. The diffraction peak positions of
the core/shell NCs locate between those of CuInS
2and ZnS.
The EDX compositions of the core and core/shell NCs are
Table 2. Summary of the Emission Properties of the 160 °C/
120 min Samples from the Six Flask Reactions Shown in
Figure S3D, E in the Supporting Information
reaction media emission position (nm) FWHM (nm) QY (%) DDT 100 758.8 141.2 15.7 DDT:ODE (76:24) 801.7 148.8 12.3 DDT:ODE (52:48) 815.8 159.0 8.3 DDT:ODE (26:74) 857.8 195.4 2.2 DDT:OA (74:26) 779.9 141.5 11.5 DDT:OLA (76:24) 705.9 115.7 1.7
Table 3. Summary of the Emission Properties of the 160 °C/
120 min Samples from the Nine Flask Reactions Shown in
Figure S3G−J in the Supporting Information
Cu source In source emission position(nm) FWHM(nm) (%)QY CuI In(OAc)3 758.8 141.2 16.2 CuCl In(OAc)3 748.5 156.0 15.9 Cu(OAc) In(OAc)3 745.2 142.5 12.2 CuBr2 In(OAc)3 824.2 179.7 15.3 CuCl2 In(OAc)3 795.0 176.6 16.6 Cu(OAc)2 In(OAc)3 753.0 142.3 10.5 CuI In(acac)3 759.0 139.5 17.6 CuI InCl3 889.9 200.2 0 CuI InI3 911.5 230.1 0
Figure 5.Agarose gel electrophoresis of EG2-CuInS2/ZnS NCs for 20 min (left) and 50 min (right) using Tris-acetate-EDTA (TAE) buffer. Lanes
1−4 are EG2-CuInS2/ZnS NCs purified (1), EG2-PEG-CuInS2/ZnS NCs purified (2), EG2-CuInS2/ZnS unpurified NCs (3), and CuInS2/ZnS
shown in Table S2 in the Supporting Information. Very
interestingly, Zn should have replaced In more than Cu, due to
the decrease in the In atomic ratio from 0.56 (core NCs) to
0.35 (core−shell NCs). Such Zn replacement of In more than
Cu should be related to the gradient structure of the core NCs,
which is rich in In on the surface. The TEM image of the core/
shell NCs shown in Figure S5B in the Supporting Information
demonstrates high crystallinity and low size distribution.
For the bioconjugation, surface ligand exchange was
performed first to transfer the CuInS
2/ZnS core-shell NCs
after purification into aqueous environments. For in vitro
imaging of pancreatic cancer cells, dihydrolipoic acid (DHLA)
was used for the surface ligand exchange and 2A3 for the
bio-conjugation. For in vivo imaging of brain tumor cancer cells,
mercaptoundecanoic acid (MUA) was used for the surface
ligand exchange and EG2 for the bio-conjugation. The ligand
exchange and bioconjugation procedures are illustrated in
Figure S5C in the Supporting Information. The EDC method
58to bioconjugate 2A3 to MUA-capped NCs and EG2 to
DHLA-capped NCs was successful. The optical properties of the
corresponding QDs used for in vitro imaging (Figure 6) and in
vivo imaging (Figure 7) are summarized in Figures S6 and S7 in
the Supporting Information, respectively. The QY of our
CuInS
2/ZnS core−shell NCs decreased from ∼45% to 8% after
aqueous phase transfer and bioconjugation; the NCs with ∼8%
QY emitting at ∼656 nm and ∼790 nm were sufficiently bright
for our bioimaging.
Figure 6 shows in vitro imaging BxPC3 pancreatic cancer
cells with 2A3 bio-conjugated CuInS
2/ZnS NCs and non
bio-conjugated CuInS
2/ZnS NCs. The filter which was used only
transmitted the short wavelength tail portion of the
luminescence band, the signal-to-noise ratio was sufficiently
large to yield images with good contrast. The images shown in
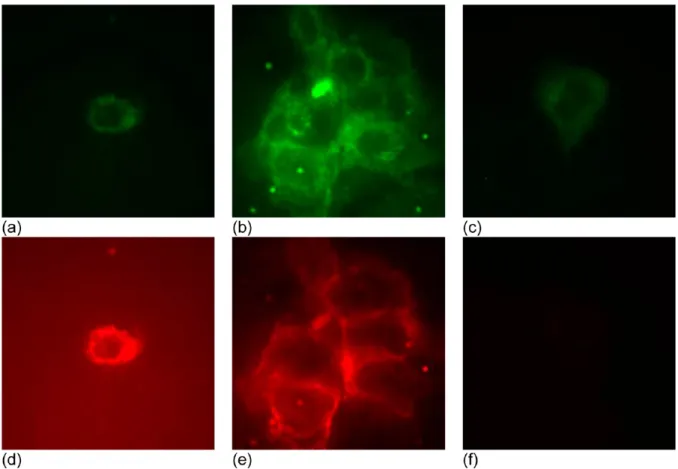
Figure 6.In vitro false color images (80 × 80 μm2) of (a−c) autofluorescence excited at 488 nm and detected in the 516−556 nm range, green with
the same intensity scale, and (d−f) QD fluorescence excited at 543 nm and detected in the 604−644 nm range, red with the same intensity scale. (a, d) Single BxPC3 pancreatic cancer cell with 2A3-sdAb-CuInS2/ZnS NCs, (b, e) clump of BxPC3 cells with 2A3-sdAb-CuInS2/ZnS NCs, and (c, f)
single BxPC3 cell with CuInS2/ZnS NCs. Washing was performed before taking the images. (a−c) Autofluorescence excited at 488 nm (all three
images are shown with the same intensity range). (d−f) QD fluorescence excited at 543 nm (all three images are shown with the same intensity range). The images are cropped to an 80 × 80 μm2area.
Figure 7.In vivo optical images demonstrate the biodistribution of the EG2 bioconjugated (left) and non-bioconjugated (right) CuInS2/ZnS
NCs after their 4 h intravenous injection, as well as enhanced targeting of the bioconjugated CuInS2/ZnS NCs in an orthotopic brain
glioblastoma tumor model, as compared by the intensity difference at the two sites pointed by the two arrows. The other bright spots correspond to excretion through the liver.
Figure 6 demonstrate that the CuInS
2/ZnS NCs without 2A3
are not targeted and are barely detectable (Figure 6f)
,indicating that nonspecific adsorption is minimal. The intensity
of autofluorescence, represented by false-coloured green, is
comparable in the top panel images. The intensity of the
near-IR fluorescence, signified by false-coloured red, is significantly
stronger in images d and e in Figure 6 than in image f, because
of the binding of the 2A3 bioconjugated CuInS
2/ZnS NCs on
the surface of the cancer cells. Thus, the 2A3 conjugation was
accomplished and the resulting CuInS
2/ZnS NCs have the
potential to detect CEACAM6 for the early-stage diagnostics of
pancreatic cancer. Note that previously presented western blot
data demonstrated that 2A3 binds specifically to cells
expressing CEACAM6 and does not bind to CEACAM6-free
cells.
41Figure 7 shows in vivo imaging brain tumor cancer cells with
EG2 bio-conjugated CuInS
2/ZnS NCs and non bio-conjugated
CuInS
2/ZnS NCs. The bioconjugated CuInS
2/ZnS NCs were
injected into one nude mice nine days after introducing 75,000
U87MG delta EGFR Glioblastoma cells, and the non
bioconjugated CuInS
2/ZnS NCs were injected into another
nude mice as a control. It is clear that, for the mice injected
with the bio-conjugated CuInS
2/ZnS NCs, the fluorescence
intensity at the tumor site is much greater than that of mice
injected with the non-bio-conjugated CuInS
2/ZnS NCs, and
remains at a high level after 4 h of intravenous injection. Note
that the intensity scale is logarithmic. The region with bright
signal in the dorsal side of the mouse corresponds to the liver of
the mouse. Liver is a major organ of the reticulo-endothelial
system. Many of the NCs end up in the liver, leading to the
high fluorescent signal. The difference in brightness of the liver
region in the two figures may be due to different clearance and
pharmacokinetics of the NCs when they are bio-conjugated or
not to the sdAb. Thus, the EG2 conjugation was successful and
the resulting CuInS
2/ZnS NCs are unambiguously capable of in
vivo imaging in the near IR window.
3. CONCLUSIONS
Diphenylphosphine sulfide (SDPP) was used as a sulphur
source to synthesize brightly-emissive CuInS
2NCs via a
low-temperature non-injection one-pot approach in
1-dodecane-thiol (DDT), which is the sole ligand and solvent. The low
nucleation/growth temperature is due to the high reactivity of
SDPP. At the same time, the relatively low CuI/DDT reactivity
as compared to that of In(OAc)
3/DDT results in a gradient
structure with an In-rich surface; thus, the resulting CuInS
2NCs exhibited high QY of 23%. The exploration of the
chemical mechanism of the SDPP and SeDPP based
approaches to QDs is an ongoing effort in our laboratories.
66An enhanced QY to 50−60% was achieved via ZnS shell
coating; the resulting core-shell NCs were transferred into
aqueous phases for the subsequent bio-conjugation with sdAbs.
In vitro pancreatic cancer cell imaging was performed, together
with in vivo brain tumor targeted imaging, demonstrating high
specificity of cancer targeting with high detection sensitivity.
4. EXPERIMENTAL SECTION
4.1. Chemicals.All chemicals used are commercially available and were used as received. Copper(I) iodide (CuI, 98%), copper(I) chloride (CuCl, 99.995+%), copper(I) bromide (CuBr, 98%), copper(I) acetate (Cu(OAc), 97%), indium(III) acetate (In(OAc)3,
99.99%), indium(III) chloride (InCl3, 98%), zinc acetate dihydrate
(Zn(OAc)2·H2O, 99.999%), zinc chloride (ZnCl2, 99.999%),
potassium ethyl xanthogenate (96%), 1-dodecanethiol (DDT, 98%), oleic acid (OA, tech. 90%), oleylamine (OLA, tech. 70%), 1-octadecene (ODE, tech. 90%), mercaptoundecanoic acid (MUA, 98%), tetramethyl ammonium hydroxide (TMAH, 25 wt % in H2O),
1-ethyl-3-[3-dimethylaminopropyl]carbodiimide (EDC), N,N′-dicy-clohexylcarbodiimide (DCC, 99%), N-hydroxysuccinimide (NHS) were purchased from Sigma-Aldrich. Diphenylphosphine (DPP, 99%), copper(II) bromide (CuBr2, 99%), copper(II) chloride (CuCl2,
anhydrous, 98%), copper(II) acetate (Cu(OAc)2, anhydrous, 97%),
indium(III) iodide (InCl3, 99.999%) and indium(III) acetylacetonate
(In(acac)3, 98%) were purchased from Strem Chemicals. Sulfur
(precipitated) was purchased from Anachemia. Solvents used for purification were anhydrous, including toluene (99.8 %), hexane (≥99 %), and methanol (99.8 %), which were purchased from Sigma-Aldrich, along with acetone (99.5 %, ACP in Montreal, dried over 4 Å molecular sieves).
4.2. Synthesis of CuInS2NCs.The SDPP stock solution (0.66 M)
was prepared in a glovebox by adding DPP (1.6 mL, 9.1 mmol) to a vial containing sulphur (0.289 g, 9.0 mmol). The resulting mixture was gently heated with the cap sealed until a clear, colorless solution was obtained, and then was allowed to cool, whereupon a white solid appeared. Toluene (12.0 mL) was then added, and the mixture was gently heated until a clear, colorless solution was obtained.
In a typical synthesis of CuInS2NCs, CuI (0.20 mmol, 38 mg) and
In(OAc)3 (0.20 mmol, 58 mg) were added to a three-neck
round-bottom flask equipped with a condenser, thermometer, and magnetic stir bar. DDT (6.25 mL) was added with rigorous stirring, and then degassed at room temperature. When vigorous bubbling subsided, the temperature was increased to 65 °C and degassed further for 1 h. If a clear, yellow solution was not observed, the mixture was heated at 120 °C under N2until this was obtained, and then degassed again at 60 °C
for 1 h. The temperature was lowered to 50 °C and the DPPS stock solution (1.07 mL, 0.71 mmol) was added under N2. The reaction was
then degassed once more for 0.5 h to remove toluene. Under a flow of purified N2, the reaction mixture was heated up from 50 °C to 160 °C
in a stepwise manner. To monitor the growth kinetics, 11 samples (∼100 μL each) were taken with their temperature/growth periods of 50 °C/30 min (1), 60 °C/15 min (2), 80 °C/15 min (3), 100 °C/15 min (4), 120 °C/15 min (5), 140 °C/15 min (6), 160 °C/15 min (7), 160 °C/30 min (8), 160 °C/60 min (9), 160 °C/90 min (10), 160 °C/120 min (11). In some cases, 10 samples were collected without the sampling at 160 °C/90 min. The absorption and PL emission (excited at 500 nm) spectra were collected with diluted samples, which included 5 μL of crude growth mixtures dispersed in 1 mL toluene.
4.3. 31P NMR with 1H Decoupling. The measurements were
performed on a Bruker AV-III 400 spectrometer operating at 161.98 MHz for31P. An external standard 85% H
3PO4was used.
CuI-DDT stock solution (75 mmol/kg) was made from CuI (76 mg, 0.4 mmol) and DDT (6.25 mL), whereas In(OAc)3-DDT stock
solution (25 mmol/kg) was made from In(OAc)3(58 mg, 0.2 mmol)
and DDT (9.38 mL). The mixtures were degassed separately at 60−70 °C till a clear solution was obtained and then transferred into a glovebox filled with N2. DPPS stock solution in toluene-d8(0.66 M)
was prepared in a similar manner as that in toluene by mixing S (48 mg, 1.5 mmol) and DPP (0.26 mL, 1.5 mmol) in toluene-d8(2.0 mL).
For the top NMR spectra in Figure 2, 0.48 mL (0.03 mmol) of CuI-DDT stock solution was added into a 5 mm NMR tube, followed by 0.08 mL (0.053 mmol) of DPPS stock solution, leading to [Cu] of ∼74 mmol/kg. For the middle NMR spectra in Figure 2, 1.95 g of (0.05 mmol) In(OAc)3-DDT stock solution was added into a 10 mm
NMR tube, followed by 0.13 mL (0.09 mmol) of DPPS stock solution, leading to [In] ∼21 mmol/kg. For the bottom NMR spectra in Figure 2, 0.30 mL (0.02 mmol) of CuI-DDT stock solution was added to a 5 mm NMR tube, followed by 0.76 g (0.02 mmol) of In(OAc)3-DDT
stock solution and 0.10 mL (0.066 mmol) of DPPS stock solution, leading to [Cu + In ] of ∼38 mmol/kg. All the samples were prepared in the glovebox filled with N2.
4.4. In situ Observation of the Temporal Evolution of Absorption.All the absorption spectra were collected on a Cary 5000 UV/VIS/NIR spectrometer using a 1 nm data interval and a scan rate
of 600 nm/min. The reaction mixtures were loaded in 3.5 mL cuvettes and the growth time started to count after the cuvettes were placed in the instrument with the set up of reaction temperature and spectra collecting time intervals. The light path was 10 mm.
4.5. ZnS Shell Coating. The zinc oleate stock solution (0.25 mmol/g) was prepared by mixing Zn(OAc)2·2H2O (2.19 g, 10.0
mmol), oleic acid (6.21 g, 22.0 mmol), and ODE (33 g) in a 100 mL three-neck round-bottom flask equipped with a condenser and thermometer. The mixture was gradually heated to ∼100 °C with stirring under vacuum until no vigorous bubbling was observed. The temperature was increased to 140 °C under N2until a clear solution
was obtained. The temperature was decreased to ∼100 °C and degassed once more for ∼1 h. At this point, the reaction was allowed to cool to room temperature under N2.
Shell coating of the CuInS2NCs with ZnS was carried out in situ
without purification of the core, following literature procedures.7 A
portion of the CIS core material (∼0.10 mmol) was degassed at 60 °C for 1 h in a three-neck round-bottom flask with a condenser. In a separate reaction vessel, the zinc oleate stock solution (0.84 mmol, 3.36 g) was degassed at ∼90 °C for 1 h, and a solution of zinc ethylxanthate (0.10 mmol, Zn(ex)2, prepared from ZnCl2 and
potassium ethyl xanthogenate.59) in 0.10 mL of dimethylformamide
(DMF) and 1.0 mL of toluene was added with stirring, forming the ZnS precursor solution. The core material mixture was heated to 220 °C under N2, and the ZnS precursor solution was added dropwise over
30 min (addition was performed over 45 min for larger batches). After the addition was complete, the reaction was heated for a further 10 min then cooled to room temperature. The core synthesis and shell coating have both been successfully scaled up by a factor of five by volume without a significant decline in optical properties.
4.6. Characterization. Absorption spectra were collected with a Cary 500 UV-vis-NIR spectrophotometer. PL emission spectra were collected with a Horiba Jobin Yvon FluoroMax-4 NIR spectrofluor-ometer. Both optical measurements used a 1 nm data interval. Built-in Origin 8 was used for the integration of emission peaks to determine peak positions, fwhm, and areas. The PL QY was estimated by comparing the emission intensity of dilute samples in toluene (optical density of ∼0.1 at the excitation wavelength of 500 nm) with that of oxazine 170 (lit. QY 60%) in ethanol.42The difference of the refractive index of the two solvents was corrected for the QY estimation.
Prior to following characterizations, intensive purification was done for samples. Purification was carried out by dispersing the crude mixture in toluene and methanol (∼1:1:1 by volume), followed by centrifugation (6000 rpm for 12 min). After removal of the supernatant, the remaining solids were dispersed in a minimum amount of hexane. The dispersion was centrifuged to remove insoluble particles and transferred to a clean centrifuge tube. Acetone was added to this dispersion to induce precipitation of the NCs, and was then separated by centrifugation. The supernatant was removed and the remaining crystals were dried under a N2stream.
Powder X-ray diffraction (XRD) patterns were recorded at room temperature on a Bruker Axs D8 X-ray diffractometer using Cu Kα radiation in a θ−θ mode. The generator was operated at 40 kV and 40 mA. Data were collected in a range between 15 and 80° (2θ) with a step size of 0.1° and a counting time of 7 s per step. An XRD sample was prepared by depositing a concentrated NC dispersion in hexane on a low background quartz plate.
Transmission electron microscopy (TEM) samples were prepared by depositing diluted NC dispersions in hexane onto 400-mesh thin-carbon-coated Cu grids, followed by drying in air. The samples were examined in a JEOL JEM-2100F electron microscope equipped with a scanning unit (STEM) operating at 200 kV. High resolution TEM (HRTEM) images were obtained using a Gatan UltraScan 1000 CCD camera, and high angle annular dark field scanning TEM (HAADF-STEM) images were obtained using a Gatan ADF detector. The NC sizes were obtained by manually analyzing ∼100 individual NCs. The atomic composition of the NCs was studied by the energy dispersive X-ray spectroscopy (EDX) in the STEM mode using an Oxford INCA Energy TEM 200 attached to the JEM-2100F. The EDX samples were
prepared by concentrated NC dispersions in hexane deposited onto 300-mesh thin-carbon-coated Mo grids, followed by drying in air.
X-ray photoelectron spectroscopy (XPS) was performed using a Kratos Axis Ultra XPS equipped with a monochromated Al Kα X-ray source. The instrument pressure in the analysis chamber was 2.0 × 10‑9
Torr during analysis. Survey scans were conducted using a pass energy of 160 eV, while high resolution scans were carried out at 20 eV using an analysis area of approximately 300 × 700 μm2. Peak fitting was
performed using CasaXPS (ver. 2.2.107) data processing software. Shirley background correction procedures were used as provided by CasaXPS. Curve fitting procedures used for high resolution spectra presented in this report employed a Gaussian-Lorentzian function. High resolution analyses were calibrated to adventitious C 1s signal, at 285 eV. Quantification was performed using sensitivity factors provided by CasaXPS’s Scofield element library.
4.7. Surface Ligand Exchange.Ligand exchange was performed with purified CuInS2/ZnS core−shell NCs. For in vitro imaging,
dihydrolipoic acid (DHLA, 208 mg, 1 mmol, prepared following literature method60) was dissolved in 2 mL of methanol containing ∼80 mg of NaOH. To this solution, ∼70 mg of Zn(NO3)2•6H2O
(0.24 mmol) was added and the mixture was stirred vigorously until a clear solution was obtained. To 2 mL of such a solution was added 0.1 mL of a CuInS2/ZnS stock solution, which was prepared by adding 2
mL dry toluene to ∼40 mg of the purified NCs, and the mixture was stirred at room temperature for 24 h and then centrifuged (4000 rpm/ 30 min). The precipitates were washed with ∼500 μL methanol (precipitates were partially dissolved in methanol) and then centrifuged again. Precipitates were dispersed in water and filtered using 0.45 μm and 0.22 μm pore size syringe filters (some QDs may not be filtered out).
For in vivo imaging, MUA (0.93 g, 4.3 mmol) was added to 10 mL of methanol and shaken vigorously. Tetramethyl ammonium hydroxide (TMAH) was slowly added until a pH of 9−10 was attained, and then this solution was stirred for 1 h. A portion of this basic solution (3 mL) was added to 0.1 mL of a CuInS2/ZnS stock
solution, which was prepared by adding 2 mL of dry toluene to ∼40 mg of the purified NCs. The reaction was stirred vigorously for 3−24 h and monitored by observing the amounts of precipitate in the vessel. At the end of the reaction, the mixture was centrifuged and the supernatant was decanted. Chloroform was added to the decanted supernatant and the aqueous and organic phases were separated after shaking thoroughly.
4.8. Bioconjugation. The purified CuInS2/ZnS QDs were
bioconjugated with sdAbs 2A3 and EG2 for in vitro and in vivo imaging, respectively. For in vitro imaging, the DHLA-capped CuInS2/
ZnS stock solution (∼1 × 10⁻⁵mmol) was mixed with a PBS solution
consisting of sdAb 2A3 (2.5 mg/mL sdAb/PBS), where 2A3 is estimated to be ∼1 × 10⁻⁵mmol based on a molecular weight of ∼15
K. Then 20 mL (∼1 × 10⁻⁴mmol) of EDC and 10 mL (∼1 × 10⁻⁴
mmol) of NHS were added at room temperature and the mixture was stirred vigorously for no more than 1h. The resulting bioconjugates, unpurified and purified, were used for biological applications. The purification was carried out with a 30,000 MWCO centrifuge filter device. The feed molar ratio of QD:sdAb is 1:1, so the purified bioconjugates should have a molecular weight greater than 30 kDa. Only the bioconjugates and not the reactants should be retained on the filter used.
For in vivo imaging, the MUA-capped CuInS2/ZnS NC stock
solution (0.4 mL, ∼4 × 10⁻⁵mmol) was mixed with 0.4 mL of a PBS
solution containing the sdAb EG2 (2.5 mg/mL EG2/PBS). To this was added EDC (0.020 mL, ∼1 × 10⁻⁴mmol) and NHS (0.010 mL,
∼1 × 10⁻⁴mmol), and the resulting mixture was stirred vigorously for
1 h. The resulting bioconjugates, both purified and unpurified, were used for the bioimaging. The purification was carried out with a 30 000 MWCO centrifuge filter device, as above.
4.9. Gel Electrophoresis.1% Ultra Pure Agarose (Invitrogen) gel was used. Once the gel was solidified, the samples were loaded on the gel and the electrophoresis was performed for 20 and 50 min using a Tris-acetate-EDTA (TAE) buffer. Afterwards the samples were visualized by using eXplore Optix pre-clinical imager at 750 nm.
4.10. In vitro Imaging.The BxPC3 human pancreatic cancer cell line was used, which was obtained from American Type Culture Collection (ATCC). The cells were cultured in RPMI (Gibco) medium supplemented with 10% fetal bovine serum (Roche) at 37 °C, 5% CO2in 6-well plates (Falcon) with a sterile coverslip in each well.
When the cells were about 70% confluence by the next day, they were fixed on the coverslips by using 10% formaldehyde in PBS for 10 minutes. Then, cells were washed three times with PBS and then incubated with 2% skimmed milk in PBS for 2 h. After washing with PBS, cells were incubated with 2A3 conjugated or unconjugated CuInS2/ZnS NCs for 1 h and washed three times with PBS. It is
important to note that the cells were washed after labeling so that unconjugated QDs that were not targeted to the cells are washed off. Two sets of fluorescence images were recorded for each sample with an Olympus IX-81 fluorescence microscope equipped with Photo-metrics Cascade 512B EMCCD camera. The images were acquired using a 60x oil immersion objective and the same excitation and detection conditions were applied for each set. In the first set, the samples were excited at 488 nm and weak autofluorescence was detected in the 516−556 nm range (Figure 6 top). In the second set, the samples were excited at 543 nm (Figure 6 bottom). The samples treated with 2A3 conjugated CuInS2/ZnS QDs showed strong fluorescence signal in the 604-644 nm range, whereas no fluorescence was observed for the samples treated with unconjugated CuInS2/ZnS. Similarly, no fluorescence was observed in the 604-664 nm range for untreated cells upon irradiation at 543 nm. Typical images are shown in Figure 6 and presented with false color, the 488 nm excitation images in green and the 543 nm excitation images in red. The same color images are presented using the same intensity scale to facilitate fluorescence intensity comparison between 2A3 conjugated and unconjugated samples.
4.11. In vivo Imaging. Firstly, intracranial models of U87MG.EGFRvIII glioblastoma in nude mice were used. All animal procedures were approved by the NRC-IBS Animal Care Committee and were in compliance with the Canadian Council of Animal Care. CD-1 nude mice (males, 6−8 weeks old) were purchased from Charles River Canada. The animals were housed in cages, maintained on a 12 h light/dark schedule at a temperature of 22 °C and a relative humidity of 50 ± 5%. Food and water was available ad libitum. U87MG.EGFRvIII carrying the deletion mutant of EGFR (EGFRvIII) cells was cultured in DMEM supplemented with 10% fetal calf serum and maintained in a humidified 5% CO2 atmosphere at 37 °C. This
EGFRvIII mutation confers enhanced tumorgenicity in vivo,61 and
there is differential expression of the EGFR protein compared to the U87MG parental cell line.62Cells were harvested by trypsinization in
EDTA/trypsin, washed in PBS, and centrifuged three times at 200 g for 2 min. Cell number was determined and mice were anesthetized with isofluorane anesthesia and the scalp was swabbed with alcohol. The skin was incised and a 10 μL Hamilton syringe was used to inoculate a 5 μL cell suspension (75000 cells) into the corpus striatum in the left hemisphere (3.0 mm deep; 1 mm anterior and 2.0 mm lateral to the bregma). The U87MG.EGFRvIII implanted tumors were allowed to grow for 9 days before the beginning of imaging experiments.
Secondly, in vivo brain tumor fluorescence imaging was carried out with near-infrared CuInS2/ZnS NCs bioconjugated with sdAb EG2 as
targeted NCs and CuInS2/ZnS as non-targeted NCs. Mice bearing 9
day old U87MG.EGFRvIII intracranial brain tumors were injected with QD via the tail vein (20 μL of 1 μM solution). Animals were subjected to in vivo imaging studies using a small-animal time-domain eXplore Optix MX2 preclinical imager (Advanced Research Tech-nologies, Montreal, QC, Canada), as described previously.63−65In all
imaging experiments, a 488 nm pulsed laser diode was used for excitation, and the fluorescence emission was collected at 750 nm. Each animal was imaged whole body at various time points after i.v. injection. The data were recorded as temporal point-spread functions (TPSF) and the images were reconstructed as fluorescence concentration maps. Total fluorescence intensity data from ROIs placed around the tumor region, were subsequently analyzed using the
OptiView software package (Advanced Research Technologies, Montreal, QC, Canada).
■
ASSOCIATED CONTENT
*
S Supporting InformationAdditional
31P NMR spectra, XRD patterns, TEM images,
absorption and PL spectra of the CuInS
2nanocrystals. This
material is available free of charge via the Internet at http://
pubs.acs.org.
■
AUTHOR INFORMATION
Corresponding Author
*
Phone: 1-(613)-993-5265; 1-(613)-993-9273. E-mail: Dennis.
Whitfield@nrc-cnrc.gc.ca (D.M.W.); kui.yu@nrc.ca (K.Y.). Fax:
1-(613)-998-7833.
Present Address
§
M.B.Z. is at Advanced Medical Research Institute of Canada,
Division of Medical Sciences, Northern Ontario School of
Medicine, Laurentian University, Health Science North, 41
Ramsey Lake Road, Sudbury, Ontario, Canada P3E 5J1.
Notes
The authors declare no competing financial interest.
■
ACKNOWLEDGMENTS
The authors thank Mr. Donald Van Loon and Mr. Vivier
Lefebvre for the financial support from National Defence and
Canadian Forces on “Development Novel Synthesis Technique
for Cd-Free Environmentally-Friendly CuInS
2Quantum Dots”.
The authors acknowledge the financial support from the
Defence Research and Development Canada Centre for
Security Science Chemical, Biological, Radiological/Nuclear,
and Explosives Research and Technology Initiative, CRTI
3780-2011-30va-01 “Cadmium-free Quantum Dots for
Bio-logical Agent Detection via Quantum Dot-based
Immunochro-matographic Strip (ICS) Technology”, and CRTI 09-0511RD
“Next-generation stand-off radiation detection using
nano-sensors”. The former was managed by Dr. Diana Wilkinson and
the latter by Mr. Ian Summerell and Dr. Jack Cornett. Also, the
work was supported by NRC-Taiwan Initiative Program
managed by Madam Lorena Maciel at the NRC International
Relations Office, “Molecular Imaging for Cancer Diagnostics:
Nanobodies meet Nanoparticles” and “Nanoprobe enabled
multi-scale multi-modal molecular imaging for cancers by
combined higher harmonics photoacustics and
optical-MicroCT tomography”.
■
REFERENCES
(1) Tan, Z.; Zhang, Y.; Xie, C.; Su, H.; Liu, J.; Zhang, C.; Dellas, N.; Mohney, S. E.; Wang, Y.; Wang, J.; Xu, J. Adv. Mater. 2011, 23, 3553− 3558.
(2) Zhang, Y.; Xie, C.; Su, H.; Liu, J.; Pickering, S.; Wang, Y.; Yu, W. W.; Wang, J.; Wang, Y.; Hahm, J.; Dellas, N.; Mohney, S. E.; Xu, J. Nano Lett. 2011, 11, 329−332.
(3) Song, W.-S.; Yang, H. Chem. Mater. 2012, 24, 1961−1967. (4) Li, L.; Coates, N.; Moses, D. J. Am. Chem. Soc. 2010, 132, 22−23. (5) Liu, W.; Mitzi, D. B.; Yuan, M.; Kellock, A. J.; Chey, S. J.; Gunawan, O. Chem. Mater. 2010, 22, 1010−1014.
(6) Weil, B. D.; Connor, S. T.; Cui, Y. J. Am. Chem. Soc. 2010, 132, 6642−6643.
(7) Li, L.; Daou, T. J.; Texier, I.; Kim Chi, T. T.; Liem, H. Q.; Reiss, P. Chem. Mater. 2009, 21, 2422−2429.
(8) Pons, T.; Pic, E.; Lequeux, N.; Cassette, E.; Bezdetnaya, L.; Guillemin, F.; Marchal, F.; Dubertret, B. ACS Nano 2010, 4, 2531− 2538.
(9) Yong, K.-T.; Roy, I.; Hu, R.; Ding, H.; Cai, H.; Zhu, J.; Zhang, X.; Bergeya, E. J.; Prasad, P. N. Integr. Biol. 2010, 2, 121−129.
(10) Tang, X.; Cheng, W.; Choo, E. S. G.; Xue, J. Chem. Commun. 2011, 47, 5217−5219.
(11) Hsu, C.; Huang, C.-C.; Ou, K.-L.; Lu, N.; Mai, F.-D.; Chen, J.-K.; Chang, J.-Y. J. Mater. Chem. 2011, 21, 19257−19266.
(12) Deng, D.; Chen, Y.; Cao, J.; Tian, J.; Qian, Z.; Achilefu, S.; Gu, Y. Chem. Mater. 2012, 24, 3029−3037.
(13) Pan, D.; An, L.; Sun, Z.; Hou, W.; Yang, Y.; Yang, Z.; Lu, Y. J. Am. Chem. Soc. 2008, 130, 5620−5621.
(14) Xie, R.; Rutherford, M.; Peng, X. J. Am. Chem. Soc. 2009, 131, 5691−5697.
(15) Kruszynska, M.; Borchert, H.; Parisi, J.; Kolny-Olesiak, J. J. Am. Chem. Soc. 2010, 132, 15976−15986.
(16) Park, J.; Kim, S.-W. J. Mater. Chem. 2011, 21, 3745−3750. (17) Zhong, H.; Zhou, Y.; Ye, M.; He, Y.; Ye, J.; He, C.; Yang, C.; Li, Y. Chem. Mater. 2008, 20, 6434−6443.
(18) Zhong, H.; Lo, S. S.; Mirkovic, T.; Li, Y.; Ding, Y.; Li, Y.; Scholes, G. D. ACS Nano 2010, 4, 5253−5262.
(19) Li, L.; Pandey, A.; Werder, D. J.; Khanal, B. P.; Pietryga, J. M.; Klimov, V. I. J. Am. Chem. Soc. 2011, 133, 1176−1179.
(20) Nam, D.-E.; Song, W.-S.; Yang, H. J. Colloid. Interface. Sci. 2011, 361, 491−496.
(21) Lu, X.; Zhuang, Z.; Peng, Q.; Li, Y. CrystEngComm 2011, 13, 4039−4045.
(22) Trizio, L. D.; Prato, M.; Genovese, A.; Casu, A.; Povia, M.; Simonutti, R.; Alcocer, M. J. P.; D’Andrea, C.; Tassone, F.; Manna, L. Chem. Mater. 2012, 24, 2400−2406.
(23) Li, T.-L.; Teng, H. J. Mater. Chem. 2010, 20, 3656−3664. (24) Niezgoda, J. S.; Harrison, M. A.; McBride, J. R.; Rosenthal, S. J. Chem. Mater. 2012, 24, 3294−3298.
(25) Chen, B.; Zhong, H.; Zhang, W.; Tan, Z.; Li, Y.; Yu, C.; Zhai, T.; Bando, Y.; Yang, S.; Zou, B. Adv. Funct. Mater. 2012, 22, 2081− 2088.
(26) Ouyang, J.; Schuurmans, C.; Zhang, Y.; Nagelkerke, R.; Wu, X.; Kingston, D.; Wang, Z. Y.; Wilkinson, D.; Li, C.; Leek, D. M.; Tao, Y.; Yu, K. ACS Appl. Mater. Interfaces 2011, 3, 553−565.
(27) Steckel, J. S.; Yen, B. K. H.; Oertel, D. C.; Bawendi, M. G. J. Am. Chem. Soc. 2006, 128, 13032−13033.
(28) Joo, J.; Pietryga, J. M.; McGuire, J. A.; Jeon, S.-H.; Williams, D. J.; Wang, H.-L.; Klimov, V. I. J. Am. Chem. Soc. 2009, 131, 10620− 10628.
(29) Evans, C. M.; Evans, M. E.; Krauss, T. D. J. Am. Chem. Soc. 2010, 132, 10973−10975.
(30) Yu, K.; Ouyang, J.; Zhang, Y.; Tung, H. T.; Lin, S.; Nagelkerke, R.; Kingston, D.; Wu, X.; Leek, M. D.; Wilkinson, D.; Li, C.; Chen, I. G.; Tao, Y. ACS Appl. Mater. Interfaces 2011, 3, 1511−1520.
(31) Ma, W.; Luther, J. M.; Zheng, H.; Wu, Y.; Alivisatos, A. P. Nano Lett. 2009, 9, 1699−1703.
(32) Smith, D. K.; Luther, J. M.; Semonin, O. E.; Nozik, A. J.; Beard, M. C. ACS Nano 2011, 5, 183−190.
(33) Yu, K.; Hrdina, A.; Zhang, X.; Ouyang, J.; Leek, D. M.; Wu, X.; Gong, M.; Wilkinson, D.; Li, C. Chem. Commun. 2011, 47, 8811− 8813.
(34) Yu, K.; Hrdina, A.; Ouyang, J.; Kingston, D.; Wu, X.; Leek, D. M.; Liu, X.; Li, C. ACS Appl. Mater. Interfaces 2012, 4, 4302−4311.
(35) Wei, H. H.-Y.; Evans, C. M.; Swartz, B. D.; Neukirch, A. J.; Young, J.; Prezhdo, O. V.; Krauss, T. D. Nano Lett. 2012, 12, 4465− 4471.
(36) Yu, K. Adv. Mater. 2012, 24, 1123−1132.
(37) Cossairt, B. M.; Owen, J. S. Chem. Mater. 2011, 23, 3114−3119. (38) Zaman, M. B.; Baral, T. N.; Zhang, J.; Whitfield, D.; Yu, K. J. Phys. Chem. C 2009, 113, 496−499.
(39) Zaman, M. B.; Baral, T. N.; Jakubek, Z. J.; Zhang, J.; Wu, X.; Lai, E.; Whitfield, D.; Yu, K. J. Nanosci. Nanotechnol. 2011, 11, 3757−63. (40) Baral, T. N.; Murad, Y.; Nguyen, T. D.; Iqbal, U.; Zhang, J. J. Immunol. Methods 2011, 371, 70−80.
(41) Cheng, T. M.; Murad, Y. M.; Chang, C. C.; Yang, M. C.; Baral, T. N.; Cowan, A.; Tseng, S. H.; Wong, A.; MacKenzie, R.; Zhang, J. Eur. J. Cancer 2012, DOI: 10.1016/j/ejca.2012.07.019.
(42) Sens, R.; Drexhage, K. H. J. Lumin. 1981, 24−25, 709−712. (43) Ouyang, J.; Ratcliffe, C. I.; Kingston, D.; Wilkinson, B.; Kuijper, J.; Wu, X.; Ripmeester, J. A.; Yu, K. J. Phys. Chem. C 2008, 112, 4908− 4909.
(44) Yu, K.; Zaman, M. B.; Romanova, S.; Wang, D. S.; Ripmeester, J. A. Small 2005, 1, 332−338.
(45) Peters, G. J. Org. Chem. 1962, 27, 2198−2201.
(46) Pilkington, M. J.; Slawin, A. M. Z.; Williams, D. J.; Woollings, J. D. Main Group Chem. 1995, 1, 145−151.
(47) Cain, M. F.; Hughes, R. P.; Glueck, D. S.; Golen, J. A.; Moore, C. E.; Rheingold, A. L. Inorg. Chem. 2010, 49, 7650−7662.
(48) Lemmen, T. H.; Goeden, G. V.; Huffman, J. C.; Geerst, R. L.; Caulton, K. G. Inorg. Chem. 1990, 29, 3680−3685.
(49) McCleverty, J. A.; Kowalski, R. S. Z.; Bailey, N. A.; Mulvaney, R.; O’Cleirigh, D. A. J. Chem. Soc., Dalton Trans. 1983, 627−634.
(50) Casas, J. S.; García-Tasende, M. S.; Sánchez, A.; Sordo, J.; Vázquez-López, E. M. Inorganica Chimica Acta 1994, 219, 115−119.
(51) Zukerman-Schpector, J.; Haiduc, I. Polyhedron 1995, 14, 3087− 3094.
(52) Our unpublished31P NMR data.
(53) Pearson, R. G. J. Am. Chem. Soc. 1963, 85, 3533−3539. (54) Castro, S. L.; Bailey, S. G.; Banger, K. K.; Hepp, A. F. J. Phys. Chem. B 2004, 108, 12429−12434.
(55) Uehara, M.; Watanabe, K.; Tajiri, Y.; Nakamura, H.; Maeda, H. J. Chem. Phys. 2008, 129, 134709.
(56) Booth, M.; Brown, A. P.; Evans, S. D.; Critchley, K. Chem. Mater. 2012, 24, 2064−2070.
(57) Allen, P. M.; Walker, B. J.; Bawendi, M. G. Angew. Chem., Int. Ed. 2010, 49, 760−762.
(58) Hermanson, G. T. Bioconjugate Techniques, 2nd ed.; Elsevier Science: San Diego, CA, 2008; pp 216−223.
(59) Protière, M.; Reiss, P. Small 2007, 3, 399−403.
(60) Gunsalus, I. C.; Barton, L. S.; Gruber, W. J. Am. Chem. Soc. 1956, 78, 1763−1768.
(61) Cheng, S. Y.; Huang, H. J.; Nagane, M.; Ji, X. D.; Wang, D.; Shih, C.C.-Y.; Arap, W.; Huang, , C. M.; Cavenee, W. K. Proc. Natl. Acad. Sci. U.S.A. 1996, 93, 8502−8507.
(62) Zhang, R.; Tremblay, T. L.; McDermid, A.; Thibault, P.; Stanimirovic, D. Glia 2003, 42, 194−208.
(63) Abulrob, A.; Brunette, E.; Slinn, J.; Baumann, E.; Stanimirovic, D. Mol. Imaging 2007, 6, 304−314.
(64) Abulrob, A.; Brunette, E.; Slinn, J.; Baumann, E.; Stanimirovic, D. Mol. Imaging 2008, 7, 248−262.
(65) Iqbal, U.; Albaghdadi, H.; Luo, Y.; Arbabi, M.; Desvaux, C.; Veres, T.; Stanimirovic, D.; Abulrob, A. Br. J. Cancer. 2010, 103, 1606−1616.
(66) Yu, K.; Liu, X.; Zeng, Q.; Leek , D. M.; Ouyang, J.; Whitmore, K. M.; Ripmeester, J. A.; Tao, Y.; Yang, M. Angew. Chem. 2013, 52, DOI: 10.1002/ange.201300568.