Publisher’s version / Version de l'éditeur:
International Journal of Rotating Machinery, 2012, 2012
READ THESE TERMS AND CONDITIONS CAREFULLY BEFORE USING THIS WEBSITE. https://nrc-publications.canada.ca/eng/copyright
Vous avez des questions? Nous pouvons vous aider. Pour communiquer directement avec un auteur, consultez la première page de la revue dans laquelle son article a été publié afin de trouver ses coordonnées. Si vous n’arrivez pas à les repérer, communiquez avec nous à [email protected].
Questions? Contact the NRC Publications Archive team at
[email protected]. If you wish to email the authors directly, please see the first page of the publication for their contact information.
Archives des publications du CNRC
This publication could be one of several versions: author’s original, accepted manuscript or the publisher’s version. / La version de cette publication peut être l’une des suivantes : la version prépublication de l’auteur, la version acceptée du manuscrit ou la version de l’éditeur.
For the publisher’s version, please access the DOI link below./ Pour consulter la version de l’éditeur, utilisez le lien DOI ci-dessous.
https://doi.org/10.1155/2012/928623
Access and use of this website and the material on it are subject to the Terms and Conditions set forth at
Encounters with vortices in a turbine nozzle passage
Gostelow, J. P.; Mahallati, A.; Carscallen, W. E.; Rona, A.
https://publications-cnrc.canada.ca/fra/droits
L’accès à ce site Web et l’utilisation de son contenu sont assujettis aux conditions présentées dans le site LISEZ CES CONDITIONS ATTENTIVEMENT AVANT D’UTILISER CE SITE WEB.
NRC Publications Record / Notice d'Archives des publications de CNRC:
https://nrc-publications.canada.ca/eng/view/object/?id=6675d045-4f49-4e93-a0f2-8270bfd8b294 https://publications-cnrc.canada.ca/fra/voir/objet/?id=6675d045-4f49-4e93-a0f2-8270bfd8b294Research Article
Encounters with Vortices in a Turbine Nozzle Passage
J. P. Gostelow,
1A. Mahallati,
2W. E. Carscallen,
2and A. Rona
11Department of Engineering, University of Leicester, University Road, Leicester LE1 7RH, UK
2National Research Council of Canada, Ottawa, ON, Canada K1A 0R6
Correspondence should be addressed to J. P. Gostelow,[email protected]
Received 16 July 2012; Accepted 25 September 2012 Academic Editor: Seyed G. Saddoughi
Copyright © 2012 J. P. Gostelow et al. This is an open access article distributed under the Creative Commons Attribution License, which permits unrestricted use, distribution, and reproduction in any medium, provided the original work is properly cited. Experiments were conducted on the flow through a transonic turbine cascade. Secondary flows and a wide range of vortex types were encountered, including horseshoe vortices, shock-induced passage vortices, and streamwise vortices on the suction surface. In the separation region on the suction surface, a large rollup of passage vorticity occurred. The blunt leading edge gave rise to strong horseshoe vortices and secondary flows. The suction surface had a strong convex curvature over the forward portion and was quite flat further downstream. Surface flow visualization was performed and this convex surface displayed coherent streamwise vorticity. At subsonic speeds, strong von K´arm´an vortex shedding resulted in a substantial base pressure deficit. For these conditions, time-resolved measurements were made of the Eckert-Weise energy separation in the blade wake. At transonic speeds, exotic shedding modes were observed. These phenomena all occurred in experiments on the flow around one particular turbine nozzle vane in a linear cascade.
1. Introduction
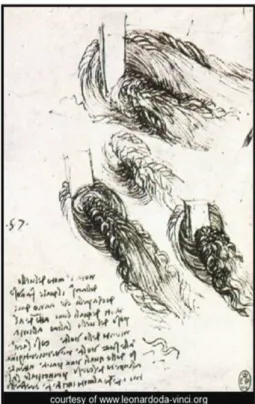
Leonardo da Vinci (1452–1519) was a notable early observer of vortices produced by a solid object placed in a stream of flow (Figure 1). When the object has thickness and produces
a flow turning of 70◦ or more, the generation of strong
vorticity is to be expected and the subject turbine nozzle blading is no exception. The different vortical phenomena arising in the flow passage are described in this paper. The variety of the vortical forms and occurrences is surprising.
The encounters with vortices involve the flows outlined in the paper, starting at the leading edge. These are horseshoe vortices, passage vortices with attendant secondary flows, and on the suction surface, streamwise vortices. At the trailing edge, vortex shedding, energy separation, base pressures, and exotic shedding modes are observed. This is all in experiments on the flow around one particular turbine nozzle vane in a linear cascade. This diversity of vortex phenomena illustrates the challenge of describing the fundamental internal aerodynamics of turbomachinery blading. Greater physical understanding is required of these phenomena, including vortex structures on surfaces, vortex shedding, the base region, the vortex wake, and its interac-tion with the shock waves.
Surface flow visualization was performed on the suction surface of the turbine blade at subsonic and transonic speeds. This was effective in providing a time-average mapping of streamwise vortical structures within the blade passage. Under the influence of the strong favorable pressure gra-dients on the suction surface, the vortices were remarkably persistent, lasting to the trailing edge.
Previous investigators have observed streamwise vortices and “streaky structures” on flat plates and on the suction surface of compressor blades. Turbine blade designers are quite familiar with the phenomenon of G¨ortler vorticity; this is commonly thought to occur predominantly on the concave pressure surfaces of turbine blades. An organized streamwise vortex system tends to increase heat transfer to the blade surface and also makes flow and heat transfer difficult to predict. Designers generally assume that streamwise vorticity of this kind is confined to the concave pressure surfaces. Examples will be given which should result in a questioning of the assumption that the organized streamwise vorticity is confined to the pressure surface of a turbine blade.
Although it appears to be unusual, this behavior had been predicted and observed previously with attendant theories for wavelength. For a predominantly convex surface, the behavior is consistent with the later predictions of
Figure1: Observations of vortices by Leonardo da Vinci.
G¨ortler [1], who postulated instability on a convex surface from the concave streamlines ahead of the leading edge stagnation region. Measurements of spanwise wavelength of the periodic array of vortices are found to be compatible with the subsequent predictions of Kestin and Wood [2].
In the mid nineteen-seventies, a National Research Council/Pratt and Whitney, Canada collaborative program was established to produce a gas generator with a turbine stage of aggressive design. The turbine was highly loaded, giving a low wheel speed. This was supported by a highly loaded turbine test facility that was of three times PT6 engine size and matched the engine Mach and Reynolds’ numbers. The turbine nozzle had a thick trailing edge to allow for cooling passages [3].
The stage employed a high turning transonic nozzle and was tested over a range of exit Mach numbers between 0.67 and 1.2. During testing, this turbine stage gave some inexplicable results that showed a redistribution of the down-stream total temperature field. In this ostensibly adiabatic arrangement, the central regions of the vane wakes exhibited a significant decrease in total temperature and their edges showed an unexpected increase.
To resolve these anomalies and obtain detailed informa-tion over the Mach number range, the midspan secinforma-tion of the nozzle was tested in a large scale, low aspect ratio, and transonic planar cascade [4]. Some details of the blading are given inFigure 2. At high subsonic speeds, acoustically coupled vortex shedding created energy redistribution in the wake. This was measured using wide bandwidth temperature probes. In the first time-resolved measurements of wake temperature redistribution, by Carscallen et al. [5], the vortex shedding was shown to give rise to an effect first noted
•6 airfoils (5 passages) •Midspan of an HPT vane
•4.3 times engine size
•Correct engineMeof 1.16 at a PR of 2.3
•Stagger angle 64◦
•Solidity 1.19
•Correct engine Re of 2.13×10⁵
Figure2: Some features of the blading.
by Eckert and Weise [6]. This had led to problems in the
development of an advanced turbine stage.
Base pressures are also associated with vortex shed-ding and result in increased drag for bluff bodies and turbine blades. Time-resolved pressure distributions gave information on fluctuations and corresponding base drag coefficients.
The most common shedding mode is not the only mode. Not all vortex shedding takes the form of the classical vortex street described by von K´arm´an; a wide range of “exotic” modes also exists. The discovery of these anomalous patterns behind transonic turbine blades was first reported
to ISROMAC-5 by Carscallen and Gostelow [7] and resulted
in an investigation of when they might occur. Two other applications were found, in the vortex-induced vibration of bluff bodies and research on oscillating airfoils. Findings from the vortex-induced vibration work of Williamson and Roshko [8] have clarified the shedding modes.
2. Vortices in the Blade Passage
The inlet wall boundary layer occupies 10% of the span and the leading edge was thick and blunt, giving rise to strong horseshoe vortices and secondary flows. The secondary flow creates a large displacement which affects the streamlines well outside the secondary flow zones. When applied to the flow in a cascade, the term “secondary flow” is restricted to the differential deflection imparted by the cascade, to a sheared free stream. In this case, the principal source of shear at inlet is the wall boundary layer.
At the midspan, the surface streamlines are all parallel and the flow appears to be two dimensional. At Mach 1.16 the shock impingement and separation region is associated with a strong vortex rollup where the shock impingement meets the side-wall boundary layer. This is associated with the passage vortex.
Two other vortex types should be mentioned. These are the relatively small contrarotating corner vortex and the rather larger wall vortex that is induced by the passage vortex. A narrow, but vigorous, “corner vortex” exists beneath the larger multivortex structure [9]. Its induced sense of rotation is contrary to that of the passage vortex. This thin
Figure3: Endwall visualization of horseshoe vortex.
vortex occupies the corners between endwalls and blade surfaces and can be seen adjoining the concave blade surface inFigure 3. A rather larger contrarotating vortex, adjoining the endwall, is induced by the impingement of the main passage vortex on the blade’s suction surface. This “wall vortex” tends to scrub the endwall in the downstream mid-passage region. It moves away from the suction surface toward the mid-passage region, between the suction and the pressure surfaces.
2.1. Horseshoe Vortices. Surface flow visualization was
applied, with the aim of establishing the strength of the leading edge horseshoe vortex. This demonstrated that, on the endwalls, the influence of the horseshoe vortex was very strong, as shown in Figure 3. The principal horseshoe vortex around the leading edge had both pressure surface and suction surface components. The pressure surface leg was swept over toward the suction surface, eventually to become the main passage vortex. The static pressure gradient acting on this vortex leg is the same at the endwall as that in the free stream, but the velocity is lower in the end region. The radius of curvature of the streamlines in the end-wall region must also be lower to preserve radial equilibrium. The path the vortex takes in the end-wall region therefore has high curvature and this accounts for its rapid movement across the passage.
2.2. Passage Vortices. A qualitative measure of vortex
struc-ture, on a time-averaged basis, was obtained using surface oil flow visualization [10]. The blade was covered with a sheet of self-adhesive white vinyl. A mixture of artist-grade linseed oil and powdered lampblack-shaded pigment was applied in a very thin and uniform layer over the suction surface. After letting the tunnel run for about five minutes, the blade was removed and photographed.
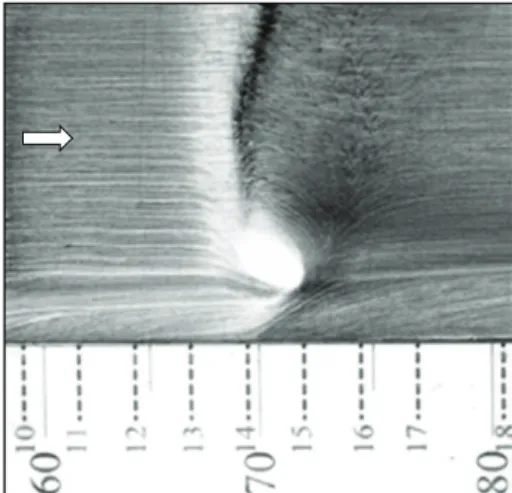
Inside the primary passage vortex, the mean pressure fluctuations and the resolved kinetic energy levels are large. The maximum shear levels are observed beneath the main passage vortex and close to the small corner vortices. The
visualization of the suction surface flow at Me = 1.16 is
shown inFigure 4. The large numbers on the scale represent percentage axial chord and the small numbers mark static tap locations. The shock impingement and separation region is around the 70% axial chord location.
Figure4: Visualization of suction surface at Me=1.16.
Figure5: Enlarged view of the vortex on the suction surface.
There was a strong vortex rollup where the impinging shock met the end-wall boundary layer. The sense of rotation and the direction of the backflow into the separated region following the shock can be deduced. Rotation was counter-clockwise on the left-hand side and counter-clockwise on the right-hand side of the vane.
A close-up view of the vortex formed in the vicinity of the impinging shock and of the resulting separation region is given inFigure 5. The sense of rotation and of the resulting backflow into the separated region following the shock is shown clearly. Fine scale streamwise vortices also show up in
Figure 5. For a predominantly convex surface, this behavior was unexpected. At the leading edge, the suction surface is virtually circular; subsequently, much of the suction surface retains a strong convex curvature over the forward portion and is quite flat further downstream. Surface flow visualiza-tion was performed at subsonic and transonic speeds, and
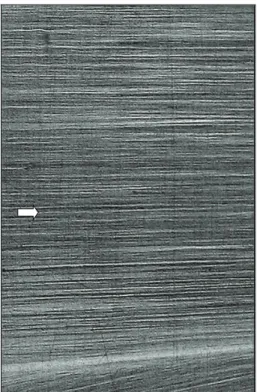
Figure6: Close-up visualization of streamwise vortices.
the surface displayed coherent streamwise vorticity covering the entire surface to the trailing edge.
2.3. Streamwise Vortices. Surface flow visualization was
per-formed at subsonic and transonic speeds, and the suction surface displayed coherent streamwise vorticity extending to the trailing edge. A close-up view of the visualization from a discharge Mach number of 1.16 is given inFigure 6. A region between about 80% and 95% axial chord is presented. Fine scale streamwise vortices show up clearly in the figure. For a predominantly convex surface, this behavior is unexpected but is in agreement with the later predictions of G¨ortler [1], who postulated instability on a convex surface from the concave streamlines ahead of the leading edge stagnation region.
The measurements of the spanwise wavelength of the array of vortices may be compared with the predictions of
Kestin and Wood [2]. They predicted a theoretical value
of spanwise wavelength between pairs, λ, for a cylinder of diameter, D, given by
λ=1.79π D Re−0.5. (1)
This is represented by the straight line for Tu = 0% in
Figure 7. It is difficult to locate the turbine blade on the Kestin and Wood graph as (1) represents flow past a circular cylinder. The leading edge of the turbine blade is relatively blunt but nevertheless has a high surface curvature which decreases rapidly to near zero further back.
The rapid changes in curvature of the convex surface raise the question of what effective diameter should be applied if comparing with the Kestin and Wood model.
3 2.5 2 1.5 1 0.5 0 0 1 2 3 4 5 0% 0.2% 1% 2% 4% Tu= (λ /D ) × 10 2 Re 250 ·10 3 200 ·10 3 150 ·10 3 125 ·10 3 100 ·10 3 75· 10 3 50· 10 3 Re−1/2×103 Compressor blade (Schulz and Gallus) Compressor blade (Weber et al.) Turbine cascade (Mahallati) Turbine cascade (Benner et al.) Turbine cascade (Hodson and Dominy) Turbine cascade (Halstead)
Figure7: Measurements of lateral spacing and comparison with Kestin and Wood’s predictions.
According to the Kestin and Wood theory, the measured wavelength, of 0.55 mm, is compatible with the curvature of the suction surface at approximately the 10% true chord location (Figure 7). Because the geometry is quite different from that of a circular cylinder, only qualitative agreement with the predictions can be expected and that is what was achieved. However, surface flow visualization photographs have been analyzed from the work of a number of published experiments. When examined in the same way as the results of Figure 6, two results from compressor blading [11,12] and three from turbine blading [13–15] are available and also give reasonable agreement with the theory and experiments of Kestin and Wood (Figure 7). The free-stream turbulence levels for the above cases were all in the range 0.2%≤Tu≤
1.2%. The black symbols are the results from the original experiments of Kestin and Wood over a turbulence level
range 0.2%≤Tu≤4.0%.
For the subject blading, the acceleration through the passage is strong. The mass-averaged inlet Mach number at the design condition is 0.118 whilst the discharge Mach number is 1.16, giving an order of magnitude difference. It is the flow in the vicinity of the leading edge that determines the susceptibility of the flow to organized streamwise vorticity, and at a local Mach number of 0.118, the flow dynamics should not be very different from previous observations that were undertaken in low speed flows.
In assessing the results, it should be borne in mind that the Mach number regime and the model geometry differ from others considered in the published literature. The blades have a very blunt leading edge and are therefore likely candidates to experience flow instability upstream of the stagnation point and the consequent streamwise
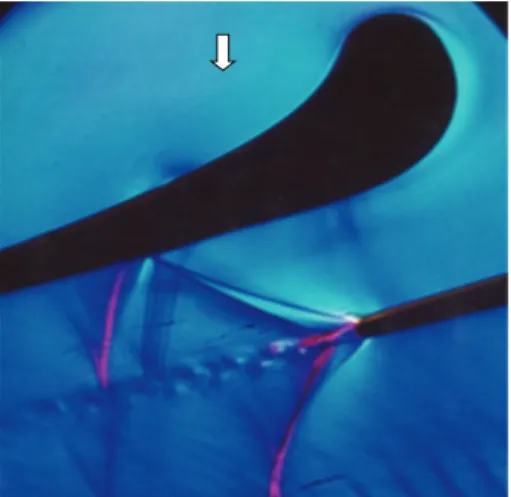
Figure8: Schlieren view of vortex shedding at Me=1.16.
vorticity. Crossflow instabilities have been observed experi-mentally on the stagnation streamline and are the subject of ongoing computational investigation. Streamline curvature instabilities provide a competing source; the streamlines appear to impact at around 10% chord. An outcome of these investigations is to establish that organized streamwise vorticity may occur more frequently on convex surfaces, such as turbine blade suction surfaces, than was previously appreciated. Investigations and predictions of flow behavior should be extended to encompass this possibility. If this behavior is at all common, it could have implications for turbine aerodynamic and blade cooling design.
3. Vortex Shedding
Turbomachinery blades with thick trailing edges, such as those investigated by Carscallen et al. [16], are associated with a high loss penalty. This loss penalty is greater than would be expected from a simple backwards-facing step and remained unexplained until high speed schlieren photography was applied to cascades [17].
Vortex shedding is present in the wakes of blades with thick trailing edges (Figure 8), and the unexplained losses are clearly associated with the shedding process. Among other problems, this drastically increases the base drag at subsonic speeds. In addition to the loss penalty, vortex shedding may cause adverse effects including high frequency sound propagation, vibration effects, locally high heat transfer to or from the blade surface, and energy separation into hot and cold regions. The vortex street, often with closely coupled oscillating shock waves, jeopardizes RANS flow field computations.
With modern CFD approaches these difficulties can be overcome. Two-dimensional time-accurate numerical sim-ulations of the midspan flow were performed by Mahallati over the speed range, using a commercial CFD code. The Roe flux difference-splitting scheme was used for discretization of spatial derivatives. Temporal terms were treated with the second-order implicit method. The k-ω turbulence model was used for closure. Convergence was accelerated using multigrid techniques and the mesh was refined such that
Figure9: Instantaneous CFD view of vortex shedding/shock wave interaction at Me=1.16.
the minimum value of y+ was less than unity. No wall
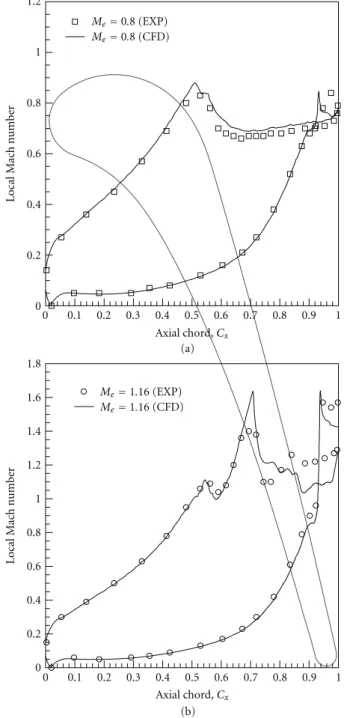
functions were therefore needed and the turbulence model was integrated all the way to the wall. An instantaneous view from an unsteady RANS calculation for the cascade investigated is given in Figure 9. The interactions between shed vortices and oscillating shock waves are quite complex but have been handled well by the code. Time-averaged experimental results for the blade Mach number distribution and computational predictions are given, with the blade
layout, in Figure 10. The agreement between computation
and experiment is seen to be reasonable.
3.1. Base Pressures. Another detrimental flow phenomenon
affected by vortex shedding in turbomachinery is base pressure. It has long been realized that turbomachinery blades with thick trailing edges have an area of reduced static pressure around the trailing edge that creates a considerable increase in base drag at subsonic speeds and reduces the stage efficiency. Cicatelli and Sieverding [18] conducted an investigation on the effect of vortex shedding on the base region flow. They found that the pressure in this region fluctuated by as much as 8% of the downstream dynamic head near separation and by 4.8% in the base region.
It is clear that the instantaneous base pressure could be significantly different from the time-averaged value. Compu-tations for blading designed using steady-state methods will be erroneous for much of the vortex shedding cycle.
At subsonic speeds strong suction at the trailing edge is an essential facet of the vortex shedding process that results in increased drag for bluff bodies and turbine blades. The pressure distribution around a cylinder depends strongly on the Mach number. Time-resolved pressure distributions give information on fluctuations and corresponding drag coefficients. Base pressures were measured at the extreme trailing edge of the blades.
The values obtained are plotted inFigure 11and the base pressure deficit is seen to reach a maximum at a discharge Mach number of 0.9. The results are supplemented by earlier results obtained by Carscallen et al. [16]. The results exhibit scatter due to unsteadiness but are basically quite similar.
Base pressure is an important contributor to the turbine
stage total loss. Work by Denton [19] and by Mee et al.
[20] showed the base pressure contributing a significant
proportion of the total loss at high speeds. Carscallen et al.
Axial chord,Cx Local M ac h n umber Local M ac h n umber 0 0.1 0.2 0.3 0.4 0.5 0.6 0.7 0.8 0.9 1 Axial chord,Cx 0 0.1 0.2 0.3 0.4 0.5 0.6 0.7 0.8 0.9 1 0 0.2 0.4 0.6 0.8 1 1.2 0 0.2 0.4 0.6 0.8 1 1.2 1.4 1.6 1.8 (a) (b) Me=0.8 (EXP) Me=0.8 (CFD) Me=1.16 (EXP) Me=1.16 (CFD)
Figure10: Experimental and inviscid CFD isentropic Mach number distribution for exit Mach 0.8 and 1.16.
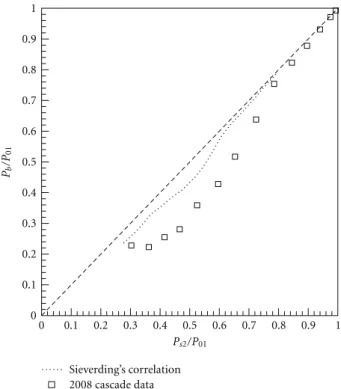
by the strongest vortex shedding. The most comprehensive base pressure correlation is that of Sieverding et al. [21]. The present results are compared with that correlation
in Gostelow et al. [10]. As indicated in Figure 12, the
base pressure deficit is underpredicted by the Sieverding correlation. This may result from differing blade trailing edge geometries.
3.2. Energy Separation. Associated with the vortex shedding
was a thermoacoustic effect that was particularly strong at high subsonic speeds. On a time-averaged basis, the stagnation temperature on the wake center line was found to
be 12◦C lower than that for the incoming fluid. Meanwhile
the stagnation temperature at the edges of the wake was 5◦C
higher than that of the incoming fluid. This effect had created a major impediment to the development of a new highly loaded turbine design. Carscallen et al. [5] had demonstrated that this was a manifestation of the Eckert-Weise effect. In this thermoacoustic phenomenon, the vortex cores emerge colder than the surrounding fluid and are associated with hot spots at the edge of the wake.
On a time-averaged basis, this results in substantial total temperature redistribution. Investigation of this phe-nomenon involved measuring time-resolved temperature variations within the fluctuating wake and relating these
0 0.2 0.4 0.6 0.8 1 1.2 1.4 1.6 Base pr essur e c o effi cient, Cp b −0.5 −0.45 −0.4 −0.35 −0.3 −0.25 −0.2 −0.15 −0.1 −0.05 2008 cascade data 1996 cascade data
Isentropic exit Mach number,Me
Figure11: Base pressure as a function of discharge Mach number from two test series.
to the previously observed time-averaged stagnation tem-perature variations. Hitherto attempts to obtain such time-resolved measurements had been frustrated by the inade-quate bandwidth of the available temperature measurement instrumentation. Using innovative wide bandwidth temper-ature probes from Oxford University [22], the anticipated temperature fluctuations were detected and were of the order of 30 K. This is what had been making it difficult to accurately establish the performance of the vane row. In the light of possible turbine efficiency implications of a few percent, it is important to be able to measure, average, and model such flows accurately.
The frequency of vortex shedding from the blades was of the order of 10 kHz and there was a requirement to make total temperature measurements with a bandwidth approaching 100 kHz for energy separation to be resolved and identified. This was achieved using the quartz rod mounted thin film gages supplied by Oxford University. A Kulite pressure transducer was mounted alongside the quartz rods, enabling total pressure to be measured simul-taneously. It was therefore possible, using phase averaging, to construct contours of total pressure, total temperature, and entropy increase at the measurement location in the vortex wake. As an example, the total temperature
con-tours are shown in Figure 13 and the entropy contours
in Figure 14. The relatively cool vortex structures on the wake center line are seen, as are the hot spots on the edge of the vortex wake. When time averaging is per-formed, the total temperatures are consistent with those measured using a slow response thermocouple, as shown in
Figure 15. These wide-bandwidth measurements represent
2008 cascade data Pb /P01 Ps2/P01 0 0.1 0.2 0.3 0.4 0.5 0.6 0.7 0.8 0.9 0 0.1 0.2 0.3 0.4 0.5 0.6 0.7 0.8 0.9 1 Sieverding’s correlation
Figure12: Measured base pressure coefficients compared with the Sieverding correlation. 5 0 −5 y 0.4 0.3 0.2 0.1 0 −10 −5 0 5 Temperature (K) SS PS t (ms)
Figure13: Time-resolved total temperature measurements in wake.
5 0 −5 0.4 0.3 0.2 0.1 0 SS PS 20 40 60 80 Entropy
0 −2 −4 −6 −8 −10 −12 W ak e t emper atur e decr ease (K) Thermocouple New probe time averaged
0 0.2 0.4 0.6 0.8 1 1.2 1.4
Isentropic exit Mach number,Me
Figure 15: Comparison of original thermocouple measurements and time-average of new probe.
the first time-resolved confirmation of the energy separation phenomenon.
A wide range of energy separation phenomena had been reviewed by Eckert, who concluded that energy separation was primarily caused by pressure forces acting on the fluc-tuating curved streamlines with only a minor contribution from viscous forces. Acoustic effects tend to be a significant ingredient of energy separation.
Because similar temperature redistributions were ob-served in planar and annular cascades, the vortex shedding effects described in this paper are equally applicable to annular cascades. The effects described are also likely to be present in rotating machines.
3.3. Exotic Shedding Modes. The most common vortex
shedding mode, predicted by von K´arm´an, is not the only shedding mode. Not all vortex shedding takes the form of a classical vortex street; a wide range of “exotic” shedding modes exists. Carscallen and Gostelow [7] discovered these anomalous patterns in the wakes of the NRC turbine cascade, prompting an investigation of when they might occur. Two other applications were found, in the vortex-induced vibrations of bluff bodies and in research on oscillating airfoils. Findings from the vortex-induced vibration work of Williamson and Roshko [8] and others clarified the shedding modes. Broadly corresponding designations from the field of vortex-induced vibration were identified in terms of the 2S, 2P, 2P∗, and P + S definitions.
The notation adopted in studies of vortex-induced vibration is that the S mode consists of single vortices shedding each cycle and P indicates that vortices are shed in pairs. P + S means a pattern in which a vortex pair
Figure16: Schlieren view of vortex couples.
Figure17: Schlieren view of vortex doublets.
and a single vortex are shed each cycle. The conventional von K´arm´an vortex street is represented by 2S. 2P implies the formation of vortex pairs and the P + S mode is an asymmetric version of the 2P mode in which a pair and a single vortex are shed each cycle. Regions marked P and 2P∗
refer to vortex modes described as “single pair” and “double pair”, respectively. Mode P is a wake comprising a set of vortex pairs convecting downstream but also laterally to one side, taking on the appearance of a jet rather than a wake. Mode 2P∗is similar to 2P except that the vortex pairs in one
of the half cycles convect away from the front of the body. In this case the convection of each pair is in the downstream direction, creating a jet.
In the experiments on the turbine blades, for some of the time, vortices were shed simultaneously from the two sides of the wake, rather than alternately. This behavior can
be observed inFigure 16for the discharge Mach number of
1.09. Other modes were observed, in which vortex pairing appeared to be taking place on one side only, as inFigure 17. Since the passage shock behavior is determined by the vortex shedding mode, this anomalous behavior could have consequences for predicting shock position blade loading and dynamics. None of these additional transonic speed modes are explained by the conventional stability theory.
that appears to predict the observed data well and extend them to a wider range of Reynolds’ numbers.
As the discharge Mach number becomes supersonic, the trailing edge shocks become oblique and the origin of the vortex street migrates from the trailing edge to the conflu-ence of the two trailing edge shear layers. Previously available evidence had suggested that only free-stream disturbances are effective in provoking the vortex-shedding instability. In the present example, the visible existence and the fixed location of acoustic waves preclude such a path for antisym-metric upstream-traveling pressure waves. This has the effect of reducing the lateral distance between incipient vortices to the relatively short wake width at the downstream shock location. Nevertheless, significant free shear layer instabilities are thought to be propagated downstream through a Kelvin-Helmholtz mechanism. These phenomena, caused by vortex shedding, also play an important role in loss generation. This is due to low base pressures behind blades with thick trailing edges. The base pressure recovered significantly in transonic flows, where the vortex street changed its character. The anomalous vortex shedding patterns were therefore associated with a reduction in loss. They can also have a role in vortex-induced vibration of the resulting airfoil, which is effectively a bluff body.
The turbine blade and its mounting were extremely stiff, and in this case vortex-induced vibration could be ruled out. The exotic shedding patterns in the blade wakes only occurred when shock waves were present; static pressure differences across the wake appeared to be the driving agent. Schlieren photographs from transonic cascades showed that the interaction between the base flow shear layers and the shock waves are the likely mechanism causing the changes in observed vortex-shedding patterns. There was a strong interaction between the downstream shock waves and the vortex shedding process, but the coupling mechanism was not understood. In a novel use of the hydraulic analogy, the fluctuating water surface was observed by high speed schlieren. This helped clarify the dynamics of the inter-action between the shock waves and the shed vortices. The above considerations suggest that the observed changes in vortex shedding from the blunt trailing edges of the transonic cascade in the Mach number range between 0.97 and 1.2 are caused by a similar self-induced oscillation mechanism.
As shown in Figures16and17, shocks are generated at the confluence of the shear layers; the shocks interact with the shear layers. Findings, from schlieren visualization, compu-tational work, and a separate hydraulic analogy experiment, have shown that the shock wave/wake interaction structure at the confluence of the shear layers is particularly dynamic and mobile. This results in the oscillatory flow causing the observed changes in vortex shedding.
4. Conclusions
A wide range of vortex formation and shedding processes was identified in a transonic turbine nozzle cascade. Vortex
secondary flow-related passage vortices and the surpris-ing organized streamwise vorticity on the suction surface. Observations of the streamwise streaks have generally been by surface flow visualization. Further work is needed to characterize the vorticity distribution away from the surface.
Cascade tests established that strong von K´arm´an vortex shedding occurred over the entire subsonic range of dis-charge Mach numbers. This resulted in strong base pressure deficits, causing high wake losses and energy separation in the wake. Time-resolved measurements of the Eckert-Weise energy separation phenomenon were made for the first time, explaining anomalies in the wake temperature variations.
At Mach numbers above unity, the von K´arm´an vortex street was found to be but one of a number of transient, yet distinct, shedding patterns. These corresponded to similar patterns observed in the field of vortex-induced vibration. The occurrence of similar changes in vortex shedding from transonic cascades suggests that the existence of an oscillating body is not a fundamental requirement. The wake instability can be caused by an oscillating pressure field. Shock-induced transonic flow oscillations could also change the modes of vortex shedding. The transonic cascade schlieren photographs showed that the interaction between the base flow shear layers and the shock waves, which form at the Mach numbers between 0.97 and 1.2, is the likely mechanism causing the changes in observed vortex-shedding patterns.
In these investigations on one high-turning nozzle vane cascade, several distinct modes of vortex formation and shedding have been identified. The impact of some of these on turbine performance is potentially harmful. The presence of these disparate vortical structures clearly makes the fluid flow and heat transfer properties of the turbine blading challenging to interpret and predict. For example, it would be useful to introduce a cooling flow in the region of the thick trailing edge and assess its impact on wake behavior and losses.
Nomenclature
Cp: Static pressure coefficient
D: Diameter of cylinder
Me: Exit isentropic Mach number
P: Pressure
PR: Pressure ratio Re: Reynolds’ number
Tu: Free-stream turbulence level, %
t: Time y: Normal direction λ: Spanwise wavelength. Subscripts b: Base value s: Static condition 0: Stagnation condition.
Acknowledgments
Appreciation is expressed to Paul Hunt and to the M-10 team of NRC for running the facility and providing excellent support.
References
[1] J. G¨ortler, “Three-dimensional instability of the stagnation point flow with respect to vortical disturbances,” in 50 Years of Boundary Layer Research, H. G¨ortler and W. Tollmien, Eds., vol. 14, 17, pp. 304–314, Vieweg, Braunschweig, Germany, 1955.
[2] J. Kestin and R. T. Wood, “On the stability of two-dimensional stagnation flow,” The Journal of Fluid Mechanics, vol. 44, pp. 461–479, 1970.
[3] R. G. Williamson and S. H. Moustapha, “Annular cascade testing of turbine nozzle at high exit Mach numbers,” Journal of Fluids Engineering, vol. 108, pp. 313–320, 1986.
[4] W. E. Carscallen and P. H. Oosthuizen, “The effect of secondary flow on the redistribution of the total temperature field downstream of a stationary turbine cascade,” AGARD CP-469, 1988.
[5] W. E. Carscallen, T. C. Currie, S. I. Hogg, and J. P. Gostelow, “Measurement and computation of energy separation in the vortical wake flow of a turbine nozzle cascade,” Journal of Turbomachinery, vol. 121, no. 4, pp. 703–708, 1999.
[6] E. Eckert and W. Weise, “Messungen der Temperaturvert-eilung auf der Oberfl¨ache schnell angestr¨omter unbeheizter K¨orper,” Forschung auf dem Gebiete des Ingenieurwesens, vol. 13, no. 6, pp. 246–254, 1942.
[7] W. E. Carscallen and J. P. Gostelow, “Observations of vortex shedding in the wake from transonic turbine nozzle vanes,” in Proceedings of the 5th International Symposium on Transport Phenomena and Dynamics of Rotating Machinery, Kaanapali, Hawaii, 1994.
[8] C. H. K. Williamson and A. Roshko, “Vortex formation in the wake of an oscillating cylinder,” Journal of Fluids and Structures, vol. 2, no. 4, pp. 355–381, 1988.
[9] H. P. Wang, S. J. Olson, R. J. Goldstein, and E. R. G. Eckert, “Flow visualization in a linear turbine cascade of high performance turbine blades,” Journal of Turbomachinery, vol. 119, no. 1, pp. 1–8, 1997.
[10] J. P. Gostelow, A. Mahallati, S. A. Andrews, and W. E. Carscallen, “Measurement and computation of flowfield in transonic turbine nozzle blading with blunt trailing edges,” ASME Paper GT2009-59686, 2009.
[11] H. D. Schulz and H. D. Gallus, “Experimental investigation of the three-dimensional flow in an annular compressor cascade,” Journal of Turbomachinery, vol. 110, no. 4, pp. 467– 478, 1988.
[12] A. Weber, H. A. Schreiber, R. Fuchs, and W. Steinert, “3-D transonic flow in a compressor cascade with shock-induced corner stall,” Journal of Turbomachinery, vol. 124, no. 3, pp. 358–366, 2002.
[13] M. W. Benner, S. A. Sjolander, and S. H. Moustapha, “Measurements of secondary flows in a turbine cascade at off-design incidence,” ASME Paper 97-GT-382, 1997.
[14] H. P. Hodson and R. G. Dominy, “Off-design performance of a low-pressure turbine cascade,” Journal of Turbomachinery, vol. 109, no. 2, pp. 201–209, 1987.
[15] D. E. Halstead, The use of surface-mounted hot-film sensors to detect turbine-blade boundary-layer transition and separation [M.S. thesis], Iowa State University, 1989.
[16] W. E. Carscallen, H. U. Fleige, and J. P. Gostelow, “Transonic turbine vane wake flows,” ASME Paper 96-GT-419, 1996. [17] O. Lawaczeck and H. J. Heinemann, “Von K´arm´an streets in
the wakes of subsonic and transonic cascades,” AGARD CP-177, 1976.
[18] G. Cicatelli and C. H. Sieverding, “The effect of vortex shedding on the unsteady pressure distribution around the trailing edge of a turbine blade,” ASME Paper 96-GT-359, 1996.
[19] J. D. Denton, “Loss mechanisms in turbo-machines,” Journal of Turbomachinery, vol. 115, pp. 621–656, 1993.
[20] D. J. Mee, N. C. Baines, M. L. G. Oldfield, and T. F. Dickens, “Examination of the contributions to loss on a transonic turbine blade in cascade,” Journal of Turbomachinery, vol. 114, no. 1, pp. 155–162, 1992.
[21] C. H. Sieverding, M. Stanislas, and J. Snoeck, “The base pressure problem in transonic turbine cascades,” Journal of Engineering for Power, vol. 102, no. 3, pp. 711–718, 1980. [22] D. R. Buttsworth and T. V. Jones, “A fast-response total
temperature probe for unsteady compressible flows,” Journal of Engineering for Gas Turbines and Power, vol. 120, no. 4, pp. 694–701, 1998.
[23] F. L. Ponta and H. Aref, “Numerical experiments on vortex shedding from an oscillating cylinder,” Journal of Fluids and Structures, vol. 22, no. 3, pp. 327–344, 2006.
Impact Factor 1.730
28 Days Fast Track Peer Review
All Subject Areas of Science
Submit at http://www.tswj.com
Hindawi Publishing Corporationhttp://www.hindawi.com Volume 2013
Hindawi Publishing Corporation
http://www.hindawi.com Volume 2013