Publisher’s version / Version de l'éditeur:
Environmental Science and Technology, 46, 9, pp. 4819-4828, 2012-02-06
READ THESE TERMS AND CONDITIONS CAREFULLY BEFORE USING THIS WEBSITE.
https://nrc-publications.canada.ca/eng/copyright
Vous avez des questions? Nous pouvons vous aider. Pour communiquer directement avec un auteur, consultez la première page de la revue dans laquelle son article a été publié afin de trouver ses coordonnées. Si vous n’arrivez pas à les repérer, communiquez avec nous à PublicationsArchive-ArchivesPublications@nrc-cnrc.gc.ca.
Questions? Contact the NRC Publications Archive team at
PublicationsArchive-ArchivesPublications@nrc-cnrc.gc.ca. If you wish to email the authors directly, please see the first page of the publication for their contact information.
NRC Publications Archive
Archives des publications du CNRC
This publication could be one of several versions: author’s original, accepted manuscript or the publisher’s version. / La version de cette publication peut être l’une des suivantes : la version prépublication de l’auteur, la version acceptée du manuscrit ou la version de l’éditeur.
For the publisher’s version, please access the DOI link below./ Pour consulter la version de l’éditeur, utilisez le lien DOI ci-dessous.
https://doi.org/10.1021/es2033845
Access and use of this website and the material on it are subject to the Terms and Conditions set forth at
Are emissions of black carbon from gasoline vehicles underestimated?
Insights from near and on-road measurements
Liggio, John; Gordon, Mark; Smallwood, Gregory; Li, Shao-Meng; Stroud,
Craig; Staebler, Ralf; Lu, Gang; Lee, Patrick; Taylor, Brett; Brook, Jeffrey R.
https://publications-cnrc.canada.ca/fra/droits
L’accès à ce site Web et l’utilisation de son contenu sont assujettis aux conditions présentées dans le site LISEZ CES CONDITIONS ATTENTIVEMENT AVANT D’UTILISER CE SITE WEB.
NRC Publications Record / Notice d'Archives des publications de CNRC:
https://nrc-publications.canada.ca/eng/view/object/?id=820efae6-31dd-4cf9-9fff-8151aec77521 https://publications-cnrc.canada.ca/fra/voir/objet/?id=820efae6-31dd-4cf9-9fff-8151aec77521
Are Emissions of Black Carbon from Gasoline Vehicles
Underestimated? Insights from Near and On-Road Measurements
John Liggio,*
,†Mark Gordon,
†Gregory Smallwood,
‡Shao-Meng Li,
†Craig Stroud,
†Ralf Staebler,
†Gang Lu,
†Patrick Lee,
†Brett Taylor,
§and Jeffrey R. Brook
††
Atmospheric Science and Technology Directorate, Science and Technology Branch, Environment Canada, 4905 Dufferin Street, Toronto, Ontario M3H 5T4 Canada
‡
Institute for Chemical Process and Environmental Technology, National Research Council, 1200 Montreal Road, Building M-12, Ottawa, Ontario K1A 0R6, Canada
§
Pollution Data Division, Environment Canada, 351 St. Joseph Boulevard, Gatineau, Quebec
*
S Supporting InformationABSTRACT: Measurements of black carbon (BC) with a high-sensitivity laser-induced incandescence (HS-LII) instrument and a single particle soot photometer (SP2) were conducted upwind, downwind, and while driving on a highway dominated by gasoline vehicles. The results are used with concurrent CO2 measurements to derive fuel-based BC emission factors for real-world average fleet and heavy-duty diesel vehicles separately. The derived emission factors from both instruments are compared, and a low SP2 bias (relative to the HS-LII) is found to be caused by a BC mass mode diameter less than 75 nm, that is most prominent with the gasoline fleet but is not present in the heavy-duty diesel vehicle exhaust on the highway. Results from both the LII and the SP2 demonstrate that the BC emission factors from gasoline vehicles are at least a factor of 2 higher than previous North American measurements,
and a factor of 9 higher than currently used emission inventories in Canada, derived with the MOBILE 6.2C model. Conversely, the measured BC emission factor for heavy-duty diesel vehicles is in reasonable agreement with previous measurements. The results suggest that greater attention must be paid to black carbon from gasoline engines to obtain a full understanding of the impact of black carbon on air quality and climate and to devise appropriate mitigation strategies.
1.0. INTRODUCTION
Motor vehicles are known to contribute significantly to the overall particulate matter burden in metropolitan areas.1 These combustion particles consist primarily of solid soot cores (black carbon) as well as a multitude of organic species of varying volatility.2,3 Black carbon (BC) particles have been studied
extensively with respect to several processes; BC can have a large impact on visibility,4 has been linked to adverse human health outcomes,5,6and contributes to poor air quality (e.g., higher PM2.5 levels). BC is known to contribute to positive radiative forcing in the atmosphere through absorption of radiation,7 but can contribute to indirect negative radiative forcing through the seeding of clouds.8 It has been suggested that reducing BC emissions via reductions in BC number concentration will result in a decrease in global cloud radiative forcing.9Recent evidence also suggests that BC deposition in the Arctic is partly responsible for arctic climate change.10,11To accurately assess the BC impacts on
global atmospheric radiative energy balance, human health, and air quality, high-quality measurements of BC emissions, particularly from anthropogenic sources, have become critically important.
Much of the anthropogenic BC mass emissions have been attributed to diesel vehicles, particularly heavy-duty diesel
vehicles (HDDV). Studies have shown that emissions of BC from diesel vehicles account for a large fraction of emitted BC in urban areas.12,13In contrast, published BC emission factors for light-duty gasoline vehicles (LDGV), derived from near roadway/tunnel sites14,15 or chassis-dynamometer studies,16,17
indicate LDGV to be relatively minor sources of BC. However, the relative importance of BC emissions by these vehicle types can change, mainly due to changes in BC emission control technologies and fuels.
In North America, the vehicle fleet is dominated by LDGVs, while emission regulations for BC and PM have been centered largely on HDDVs [http://www.epa.gov/oms/cert/hd-cert/ stds-eng.pdf]. As BC emissions from HDDVs and light-duty diesel vehicles (LDDV) are reduced through stricter emission controls, the relative importance of gasoline BC emissions can be expected to increase. Consequently, small uncertainties with respect to measured LDGV emission factors will have a greater
Received: September 26, 2011 Revised: January 30, 2012 Accepted: February 6, 2012 Published: February 6, 2012 Article pubs.acs.org/est
Published 2012 by the American Chemical
potential to significantly impact total vehicular BC emission estimates. The advent of new technologies capable of definitive and ultra low level measurements of BC18,19can help to further constrain BC emission factors from gasoline vehicles.
In the present study, real-time measurements of BC with laser-induced incandescence techniques are made upwind, downwind, and while traveling on a major highway dominated by gasoline vehicles. The BC measurements are used in conjunction with CO2measurements to estimate the fleet average, fuel-based BC emission factors (EF) for LDGV and for HDDV during chase events on the highway. Fleet average, fuel-based emission factors measured with laser-induced incandescence techniques have not previously been reported. The results are compared with the most recent reported emission factors for BC and with emission factors in currently used emission inventories in Canada. The present results suggest that BC emissions from LDGV are significantly underestimated compared to the currently reported BC emission factors for LDGV. The implications of this underestimation of BC emissions is discussed.
2.0. METHODS
The goals of the project were to measure traffic-related emissions and turbulence on highways and under near-roadway conditions, in the area surrounding Toronto, Ontario, Canada. Measurements of BC and other pollutants were made at stationary ground sites and from a mobile laboratory between August 16 and September 17, 2010.
2.1. Mobile Laboratory.Mobile measurements were made with the Canadian Regional and Urban Investigation System for Environmental Research (CRUISER) on a side road perpen-dicular to Highway 400, at a location north of Toronto, Canada (43.994 N, 79.583 W). The site was dominated by agricultural fields and was not impacted by other primary PM sources. The highway at this location is 6 lanes wide (25 m across from the lane edges). The mobile lab was used at this site to measure pollution concentration gradients along the upwind and downwind sides of the highway (45 − 1000 m from center); perpendicular to the north−south lanes of the highway. This was typically performed for several hours each day, spanning peak traffic volumes during the morning and/or the evening. A traffic camera (Miovision, Kitchener, ON, Canada) recorded traffic counts at the site and classified vehicles as passenger cars, medium sized, or heavy duty, with >95% accuracy. More than 44 h of transect driving was conducted at this site on 17 days, comprising 8 morning and 14 evening sessions. The driving speed of the mobile laboratory during transects was kept approximately constant at 1−3 km/h.
CRUISER was also driven on Highway 400 and 401 near Toronto for in situ measurements behind HDDV. Vehicle chasing measurements were made on 6 days for a total of approxi-mately 14 h. To facilitate the sampling of HDDV plumes the mobile lab was outfitted with two 3D sonic anemometers (CSAT3, Campbell Scientific, Logan, UT, USA) which were used in combination with on-board video to ensure that truck plumes were sampled. The following distance behind trucks was kept approximately constant. Clear increases in the measured turbulent kinetic energy (TKE) behind trucks were observed, correspond-ing to large increases in pollutant concentrations. Details of the video processing, and turbulence measurements are described elsewhere.55
2.2. Instrumentation. Black carbon measurements were performed onboard the mobile laboratory with a modified high-sensitivity laser-induced incandescence (HS-LII)
instru-ment (Artium Technologies Inc., CA, USA) and a single-particle soot photometer (SP2, Droplet Measurement Technologies, Boulder, CO, USA). These two real-time instruments are based on the principle of laser-induced incandescence. A brief description of these instruments is given below.
The principle of operation for the HS-LII, the calibration thereof, and its use during ambient studies have been described previously.18,20Briefly, ambient particles are sampled at a flow of approximately 5 L min−1through a sample region with a depth of 0.2 cm and a cross-sectional area of 6.4 cm2. The ambient particles containing BC within the sample volume are exposed to a pulsed laser beam (1064 nm; 7 ns FWHM) resulting in rapid heating to just below the soot sublimation temperature (approximately 4000 K). The absolute incandescence intensity from the BC particles is measured using collection optics and photomultipliers. Using an appropriate calibration and analysis of the absolute incandescence signal, information on the soot volume fraction is obtained without the need for a source of soot particles of known concentration.18 To convert to a
concen-tration, the required BC particle dependent parameters are the absorption function, E(m), and the particle material density. Values for these parameters are well established and are robust over a wide range of BC sources.21−24 The largest uncertainty arises from E(m) for the particles (±20%),21 while the overall measurement of BC concentration has been determined to be within 25%.25 In contrast to the SP2 (below), this instrument
does not measure single BC particles, but rather determines the ensemble properties for all particles in the measurement volume at the time of the laser pulse. As a result, there are no BC particle size constraints, provided that sufficient total mass is present in the detection volume. This method has been used to measure laboratory generated BC particles smaller than 7 nm.26
Similarly, the principle of operation of the SP2 and its use in ambient sampling have been described extensively.19,27−29 Individual BC particles sampled by the SP2 were irradiated with a continuous laser (1064 nm) resulting in BC incandescence which was monitored in the visible band (λ = 300−550 nm). The BC mass for each particle was estimated from the incandescence peak intensity. The BC mass concentration was calibrated with a monodisperse aerosol stream selected with a scanning mobility particle sizer (SMPS, TSI Inc.) from an atomized aqueous solution of graphitic black carbon (Aquadag; Acheson, USA). Given that the effective density of the BC calibration particle affects absolute mass measurement, the effective density of the monodisperse Aquadag particles used for calibration was characterized prior to the study by simultaneous mobility sizing and mass selection using an SMPS and an aerosol particle mass analyzer (APM, Kanomax Inc., Japan) in a manner described previously.29The effective density was found to be 0.72 ± 0.06 g cm−3 which was utilized in subsequent mass calculations. Variations in the effective density or organic coating thickness of ambient particles does not affect ambient BC mass determination for the SP230,31 or HS-LII. The SP2 is able to detect single particles with effective diameter greater than about 90 nm with approximately 100% transmission efficiency.28 An experimentally determined transmission efficiency correction was applied to the data to account for non-unity transmission of particles between 70 and 90 nm.
Uncertainties in the measurement of BC by the SP2 have been discussed previously.30Potential uncertainties during the current study are primarily associated with the BC response linearity as determined by the mass calibration (± ∼15%), and the ability to measure the effective density of the calibration
material (± ∼8%). An additional uncertainty may also arise from the incandescence of metallic species present in exhaust, resulting in an overestimation of BC mass. However, the ratio of broadband to narrowband detector signals (as a measure of sublimation temperature30) in close proximity to the highway is qualitatively similar to that of the BC calibration material (Supporting Information), indicating that such an interference was unlikely.
Carbon dioxide (CO2) was measured simultaneously on board CRUISER with a nondispersive infrared (NDIR) gas analyzer based upon a single-path, dual-wavelength, infrared detection system (Li-COR 840; LI-CORR Environmental, NE, USA). Calibration was performed with a 0.1% gas standard diluted to appropriate concentrations. CO2data were averaged to 1 s for comparison to other instruments.
2.3. Emission Factor Determination.Fuel-based emission factors (EF) have become increasingly popular as a measure of emitted pollution per mass of fuel combusted. Determination of such EFs is advantageous because they are relatively simple to determine under real world conditions and may vary con-siderably less than travel-based emission factors for some emissions as driving modes change.32,33 A fuel-based emission factor can be given as:
= Δ Δ ⎛ ⎝ ⎜ ⎞ ⎠ ⎟ EF 10 [ ]P w [CO ] P 6 c 2 (1)
where EFPis the emission factor for pollutant P (mg kg−1Fuel), Δ
refers to the above background concentration of pollutant
P (μg m−3) or CO2(μg C m−3), and ωc refers to the carbon
mass fraction of the considered fuel (kg kg−1
Fuel). Since the combustion efficiency for vehicles is typically much greater than 90%, (and even higher for diesel vehicles) the contribution of other carbon-containing species to denominator of eq 1 is negligible.32Although a few poorly maintained vehicles could emit significantly more carbon monoxide (CO), this is unlikely to affect the average EF calculation during this study. Carbon mass fractions of gasoline and diesel have been reported previously34,35as 0.85 and 0.87, respectively, and are weighted in the current study based on the average measured traffic composition during the measurement period and the average ethanol fraction of the fuel. Similar fuel-based EF equations have been applied to measurements from numerous studies, including those in tunnel, freeway, and roadway environ-ments.14,32,35
Fuel-based EFs for BC were calculated during the present study from upwind and downwind transect driving as well as during HDDV chase events. BC and CO2data from perpendicular
transects were included in the EF determination based on the following criteria: (1) Only data downwind of the highway (defined according to wind direction as 270° ± 60°), based on 1 min meteorological data were considered. (2) BC and CO2data while driving were filtered by 1 Hz wind speed (parallel to mobile lab component; u > 0.2 m/s) as measured by the onboard 3D-sonic anemometers to avoid sampling the mobile lab exhaust plume. (Positive u indicates movement into a headwind). (3) The downwind data considered were restricted to less than 100 m from the highway. This was done to reduce the uncertainty caused by dilution of the pollutants downwind of the highway. Since both BC and CO2 are substantial emissions from the highway (with no other local sources) significant concentrations of both species above background are ensured within the first 100 m of the highway. (4) Only transect data when reliable corresponding background concentrations were available were used (upwind transects were taken every 30−40 min). In total the EFs were determined for 41 h of transect driving over 17 days, between the hours of approximately 6:00−9:00 a.m. and 4:00−6:30 p.m. (the time windows with the highest traffic volumes). Applying the above criteria reduced these data to approximately 23 h.
Fuel-based BC emission factors during HDDV chasing events were also calculated with eq 1, in a manner similar to that described elsewhere.36,37Based on the onboard video, turbulence measurements, and NOx/CO ratios, distinct HDDV plumes
were identified. These plumes were accompanied by large increases in BC, CO2, and other pollutants (Supporting Information). Background levels of BC and CO2 were determined as the average concentration before entering and after exiting the exhaust plumes, and did not vary substantially in either case. Truck events were captured while driving on the highway at speeds between ∼60 and 100 km/h, (constant speed for each truck event) resulting in approximately 4 h of data. Although
30 HDDV were sampled, it is unclear how representative this subsample is of the actual HDD truck fleet, since the vehicle weight of the followed trucks was unknown, and thus not comparable to the reported distribution of weights for Ontario.
3.0. RESULTS AND DISCUSSION
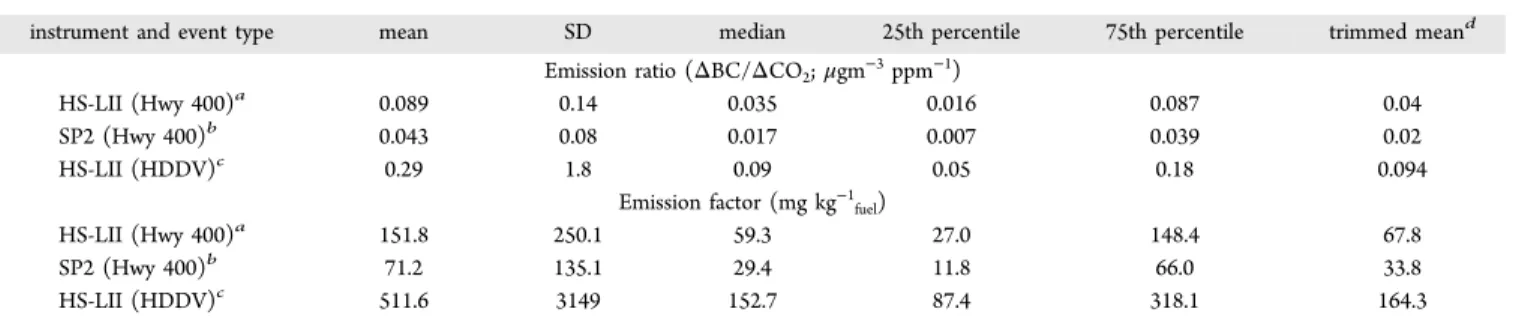
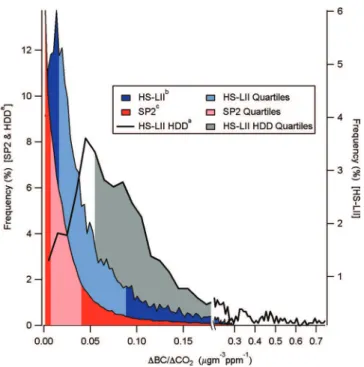
3.1. Emission Ratios and Traffic Conditions. The background corrected BC to CO2 ratios (ΔBC/ΔCO2) measured with the HS-LII and SP2 during this study are shown in Table 1 and Figure 1, respectively. The frequency distributions of Figure 1 are relatively skewed (Skewness ≈ 2). The skewness is likely due to the high variability of a mixed Table 1. BC Emission Ratios and Emission Factors Derived from One Second Data during This Study
instrument and event type mean SD median 25th percentile 75th percentile trimmed meand
Emission ratio (ΔBC/ΔCO2; μgm−3ppm−1)
HS-LII (Hwy 400)a 0.089 0.14 0.035 0.016 0.087 0.04 SP2 (Hwy 400)b 0.043 0.08 0.017 0.007 0.039 0.02 HS-LII (HDDV)c 0.29 1.8 0.09 0.05 0.18 0.094 Emission factor (mg kg−1 fuel) HS-LII (Hwy 400)a 151.8 250.1 59.3 27.0 148.4 67.8 SP2 (Hwy 400)b 71.2 135.1 29.4 11.8 66.0 33.8 HS-LII (HDDV)c 511.6 3149 152.7 87.4 318.1 164.3
aFleet average, calculated for periods of highest traffic volume flow (yellow bars in Figure 2A) from transects perpendicular to Hwy 400 and within
100 m, using the HS-LII instrument.bSame as (a), utilizing the SP2 data.cEmission ratios and factors for HDDV chasing events using the HS-LII.
Instrumental difficulties resulted in insufficient SP2 data during these events for inclusion in Table 1.dMean between the 25th and 75th percentiles.
Environmental Science & Technology Article
dx.doi.org/10.1021/es2033845 | Environ. Sci. Technol. 2012, 46, 4819−4828 4821
mobile emission source which depends upon parameters such as vehicle age, engine type, fuel type, maintenance, and driving conditions.37Thus, as expected a relatively few, more-polluting
vehicles (i.e., high particle emitters) are potentially accounting for a significant fraction of the total emissions,32,38 and in Table 1 their presence increases the mean and standard deviation of the results.
There is a clear difference between the measured ratios based on the two BC instruments, with the SP2 results being substantially lower than those obtained using the HS-LII
(Table 1 and Figure 1). This is reflected in a relatively poor correlation (R2 = 0.55; slope = 0.55) between instruments during transect measurements (within 100 m of the highway) (Supporting Information), with the SP2 biased low by approximately 45%. The reason for this bias will be discussed further below. Also shown in Figure 1 is the ΔBC/ΔCO2 frequency distribution for the HDDV chasing events. This distribution is shifted to higher values, consistent with the expectation that HDDVs emit comparatively more BC than LDGVs, with the latter making up a large fraction of the total fleet impacting the transect measurements. Instrumental difficulties resulted in insufficient SP2 data during HDDV chasing periods and hence are not included in Table 1 or Figure 1.
The ΔBC/ΔCO2 values in Figure 1 are used to compute fuel-based emission factors (Table 1) for the average fleet at this location during the transect driving and during HDDV chasing. Computed emission factors are associated with the average traffic composition and fuel consumed during the mea-surements. The traffic volume and composition over the 17 days of the study are given in Figure 2A as a function of the time of day. The highest traffic flow is observed during morning and afternoon rush hours (∼ 120−130 vehicles min−1). This peak traffic volume is comparable to or higher than that of other near-roadway studies where BC emission factors have been measured,14,34 while the fraction of HDDV at peak volume is generally intermediate to that of others. Although weekday and weekend values are averaged in Figure 2A, the subsequent analysis utilizes weekday, high-volume periods only. Estimated emission factors in Table 1 are computed for times of the highest traffic flow (yellow bars, Figure 2A). This corresponds to a mean HDDV fraction (on a vehicle count basis) during these times of 3.3% ± 2.1%, which reflects a highway with a large amount of local commuting traffic. Generally, increases in the %HDDV occur during off-peak commuting hours particularly in the late evening and early morning as well as in the middle of the day (∼12 p.m.). The
Figure 1.Frequency distributions for the above-background BC/CO2
measurements during perpendicular transect driving using the HS-LII and SP2. aMeasured ratio using HS-LII during heavy-duty diesel
(HDDV) chasing. bHS-LII during transect driving. cSP2 during
transect driving.
Figure 2.(A) Average diurnal traffic flow (vehicles min−1) and fraction of the flow which was classified as heavy duty diesel (HDDV) during the 17
days of the study. HDDV fraction based on vehicle counts. Yellow vertical bars denote the times when perpendicular transects were driven, corresponding to the data utilized for emission factor calculations.aError bars denote the standard deviation of the mean. (B) Ratio of measured BC
concentration (SP2:HS-LII) as function of hour of day for 3 consecutive days during the study and within 100 m of HWY 400. Only data for distances less than 100 m from the highway during transects were utilized to be comparable with stationary situations during these days.
increase in %HDDV is driven primarily by decreases in the numbers of LDGV, as the HDDV flow remains approximately constant throughout the day (average of 2.7 ± 2.2 min−1).
3.2. HS-LII and SP2 Comparison. Given the similarity between the HS-LII and SP2 with respect to the BC detection method, the observed deviation between emission factors (Table 1; Figure 1) based on the HS-LII and SP2 at the same location and time suggests a potential particle driven discrepancy between the instruments. We hypothesize that a cause of this discrepancy is a difference in the ability to measure particles ∼<90 nm between instruments. Such a difference could be critical given the size of the particles associated with gasoline exhaust (which dominate the LDGV emissions) and the predominance of these types of vehicles on the road. To investigate this hypothesis further, Figure 2B shows the ratio of the SP2 to HS-LII measurements relative to the time of day, for 3 consecutive days (Sept 13−16). The data included are from periods when the mobile laboratory drove perpendicular transects downwind of the highway during the morning and afternoon, and was stationary (within 70 m of the roadway) at other times. The diurnal profile of Figure 2B is qualitatively similar to that of the %HDDV of Figure 2A; the mean and median of Figure 2B indicate that the SP2 is most significantly biased low relative to the HS-LII at times of peak traffic (6−8 a.m. and 4−6 p.m.), when the HDDV fraction is lowest (i.e., gasoline-dominated emissions). Conversely the mean SP2/LII ratio is highest overnight, early morning, and during the middle of the day, when the HDDV fraction is higher. This hypothesis is further supported by the SP2 derived BC mass distributions during this study described below.
The instrument correlation plots (Supporting Information) also reveal a similar pattern; with the largest difference between HS-LII and SP2 (45%) occurring within 100 m of the highway during the highest LDGV traffic flow, and the best agreement observed when sampling the mobile lab diesel exhaust plume (slope = 0.98). The apparent relationship between the LDGV fraction and the discrepancy between HS-LII and SP2 is further hypothesized to be due to the fact that the mode diameter of LDGV exhaust particle number distributions is typically less than 30 nm.39−41Particles at these small sizes are not detectable with
the SP2, which can detect a BC core above 90 nm with 100% efficiency.28 Conversely, diesel exhaust particles are known to be significantly larger with mode diameters in the range of 60− 100 nm,41,42which are more often detected by the SP2.
Because both instruments provide indirect measurements of BC mass, the mode diameter of the mass distribution of BC will be indicative of the ability of the SP2 to quantify most of the BC mass present. Mass distributions during selected periods from Figure 2B are depicted in Figure 3, normalized by the maximum measured dm/dLogD to assist in comparison between mass distributions. To determine a mass distribution, the mass associated with individual particles was integrated over 20 s, assuming spherical particles. Discrete 20 s mass distributions were then averaged over the time periods selected. As shown in Figure 3, larger BC particles (likely diesel; ∼ 150 nm) account for a relatively larger fraction of the mass distribution shown during off-peak hours (11 p.m.−12 a.m.). This distribution corresponds to the period in Figure 2B when there is a relatively larger HDDV fraction. Also during this time, the SP2-HS-LII agreement is improved. The BC mass distribution for an HDDV chase event is also shown in Figure 3 and demonstrates that BC less than ∼90 nm contributes much less to the overall BC mass detected by the SP2 in diesel plumes. The same is true for the
distribution when intercepting the mobile lab HDD exhaust plume (Figure 3). Both of these are consistent with previous BC mass distributions for HDDV particles measured with filter-based approaches.43In contrast, when gasoline engine emissions increase relative to diesel, the relative proportion of larger BC particles (relative to <90 nm BC) is less, while smaller BC particles (<90 nm) become increasingly important. This is shown in the distribution corresponding to the 2:30−3:30 p.m. time period and especially during the periods of peak morning and afternoon traffic volume (6−8 a.m. and 4−6 p.m.). The relative shifts in the distribution corresponding to changes in the %HDDV imply that the dominant BC particles in gasoline engine emissions are smaller (<90 nm). However, the actual mass mode diameter associated with these periods when gasoline BC in Figure 3 dominates cannot be determined accurately (due to the size cutoff of the SP2). These smaller BC particles clearly contribute substantially to the overall BC mass during these times and the inability of the SP2 to detect them thus explains much of the discrepancy between instruments (HS-LII does not have particle size constraintssee Methods). Furthermore, although instrumental issues precluded the use of the SP2 during the majority of the HDDV chasing, comparison of instruments for periods when the HDD plume of the mobile lab was sampled also demonstrates improved agreement between instruments (Supporting Information).
3.3. Emission Factor Estimates and Comparisons.The fuel-based emission factors measured during this study (mixed fleet and HDDV) are plotted in Figure 4, together with the values from other recent field and dynamometer studies. In Figure 4, the tops of the gray shaded bars (left, mixed fleet; middle, HDDV) represent the mean EF computed with the measured parameters of eq 1 using the HS-LII. Black horizontal lines represent the associated median value from eq 1, while the blue line is the equivalent mean value utilizing the SP2. Values
Figure 3.SP2 mass distributions for selected periods corresponding to Figure 2B.aNormalized by the maximum of each distribution [(dM/
dLogD)max]. bAverage of all transects during this time, using data
within 100 m of the HWY only.cAverage mass distribution during this
1 h period when the mobile lab was stationary at approximately 45− 75 m from the HWY (based on wind distance).dHeavy-duty diesel
truck chasing event.eInterception of mobile laboratory HDD plume
(average of 5 20 s distributions).
Environmental Science & Technology Article
dx.doi.org/10.1021/es2033845 | Environ. Sci. Technol. 2012, 46, 4819−4828 4823
from other recent studies are shown as reported individual mean values (data points). Few studies quantifying BC EFs for mixed vehicle highways have been performed on roadways with an HDDV fraction similar to that reported here (3.3%; count basis). In recent studies,44,45 the average BC fuel-based EFs in tunnels with similar HDDV fractions (2.0−3.4%; count basis) were approximately a factor of 2 or more lower than the average reported here using the HS-LII (Figure 4; left bar). Other reported mean BC EFs tend to be for a somewhat lower count based HDDV fraction (<1%).14,15,34 Results from that work fall well below even our median values of Figure 4.
Mixed-fleet emission factors derived from tunnels or highways with a substantially higher HDDV fraction14,46 are within the
25th−75th percentiles of the present study, but still below the mean (Figure 4; left bar), despite a count-based HDDV fraction which was a factor of 6 higher (∼20%) than the present study. BC EFs have also been reconstructed from chassis-dynamom-eter experiments16,17to compare with previously reported high HDDV fraction roadways.14 Although reconstructed values (at 20% HDDV) are in relative agreement with those measured values, both remain considerably below the average reported here for 3.3% HDDV.
The LDGV EF (EFLDGV) in the current study can similarly be reconstructed from
= +
EFmeas ffHDDVEFHDDV ffLDGVEFLDGV (2)
where EFmeasis the measured mixed fleet emission factor, ff is the fuel use fraction on the roadway (diesel or gasoline), and
EFHDDVis the emission factor for HDDV. The portion of fuel
used by HDDV during this study was computed based on the measured vehicle counts44
= + − ff f U f U (1 f )U HDD HDDV HDDV HDDV HDDV HDDV LDGV (3)
where f is the measured count-based vehicle fraction (HDDV or LDGV) and U is the average fuel consumption for HDDV and LDGV, respectively. Fuel consumption values were obtained from the most recent Canadian Vehicle Survey.47 The average consumption values for LDGV and HDDV in Ontario, under highway driving conditions were estimated to be 10.4 and 33.9 L/100 km.
To reconstruct the LDGV EF from our measurements, a Monte Carlo simulation was performed, whereby the param-eters in eq 2 and 3 were randomly varied and the results were used as input to eq 2 (Supporting Information). The resultant mean EFLDGVfrom the simulation is shown in Figure 4 (right shaded bar), with the error bars representing the final average deviation of EFLDGVfrom the simulation. The average LDGV emission factor reconstructed in this manner is approximately 115 ± 80 mg kg−1
fueland is not significantly different from the average EFLDGVderived utilizing the direct individual means of the parameters in eq 2. Both values are considerably higher than the LDGV emission factors from previous chassis-dynamometer or roadway studies which range from 8 to 30 mg kg−1
fuel. Although our mean LDGV EF should be directly comparable to other reported mean values, which were stated as being mean values, using the median of our output values as a conservative estimate yields a LDGV EF (∼75 mg kg−1
fuel, Figure 4), which is also substantially larger than other reported values. The LDGV
Figure 4.Average measured mixed fleet, HDDV, and reconstructed LDGV fuel-based BC emission factors from the present study (mixed fleet, left; HDDV, center; reconstructed LDGV, right,) compared with recent literature (reported means values), and the MOBILE 6.2C derived emission factors. The count-based %HDDV during other studies is in brackets.aTunnel study, Milwaukee, WI. Converted to fuel-based EF in Ning et al.,
2008. bDynamometer study reconstructed by Ning et al., 2008 to compare with I-710 highway (20% HDDV). cHighway study (I-710, CA). dDynamometer study; converted to fuel-based EF and reconstructed in Ning et al., 2008 to compare with I-710 highway. eTunnel study in
Pittsburgh, PA.fTunnel study; Houston TX, 2.0−2.4% HDDV shown only.gEF derived from MOBILE6.2C for mixed, HDDV, and LDGV; refer to
text for details.hTunnel study, Zurich Switzerland.iTunnel study in CA with 4.2% uphill grade; HDDV EF reconstructed from mixed traffic tunnel
and measured LDGV EF.jMean reported value; HDDV vehicle chasing study, Germany.kMedian reported value; HDDV vehicle chasing study,
Germany.lDynamometer study for LDGV only as described by Ning et al., 2008.mHighway study (CA-110).nTunnel study in CA with 0.25−0.54%
HDDV assumed to ∼100% LDGV and a 4.2% uphill grade.oSame as (n) but 7 years earlier.pReconstructed median LDGV from current study.
EFs here most closely resemble those recently reported for LDGV during on-road measurements in China.48 Although implicitly assumed to be fully gasoline in the current study, a small fraction of the LD fleet operates on diesel fuel (ff ∼1.3%47). Accounting for this in eq 2 results in a negligible LDGV EF correction (Supporting Information).
Conversely, as demonstrated in Figure 4 (middle), BC EFs during HDDV chase events of the present study are similar to those reported in recent literature during other chase, tunnel, or roadway studies.34,49−51All of those reported average values fall between the mean and median of the HDDV values measured here. Some high EFs for HDDV have been reported in the past (1300−1440 mg kg−1
fuel).15,52However, continued HDDV EF measurements at the same location over the subsequent decade demonstrated a significant reduction in the HDDV EF,34,51so that most are now consistent with those measured here. The similarity between the HDDV values during these chase events and during other studies lends confidence to the mixed fleet values measured in the present study and to the inferred LDGV values.
Also shown in Figure 4 are the BC emission factors from the Canadian emissions inventory (yellow squares), which are used in the Canadian regional air quality model, AURAMS,53and the Canadian Air Quality forecasting model. The emission factors are estimated with MOBILE 6.2C for the mixed fleet of this study, HDDV, and LDGV (Supporting Information). The CO2 emission factors (g km−1) required to convert the MOBILE6.2C travel based BC EFs into fuel-based EFs were generated from a mobile greenhouse gas emissions model (MGEM54) (Support-ing Information). There are uncertainties associated with attempting to derive fuel-based BC EFs (g kg−1
fuel) equivalent to the travel-based EFs (g km−1) from inventories, which are used as model inputs. The uncertainty is mainly due to assumptions of fleet fuel efficiency and the associated CO2 emission rates. Although the MOBILE6.2C derived fuel-based BC EFs should hence be interpreted with caution, the model CO2 EFs (g km−1) are within 15% of the measured CO2 emissions factors (g km−1) during this study.55
The reconstructed mixed fleet MOBILE 6.2C emission factor in Figure 4 (∼ 19.7 mg kg−1
fuel) is substantially below the average (152 mg kg−1
fuel) and median (59.3 mg kg−1fuel) of the measured values in this study, while the MOBILE 6.2C emission factor for HDDV shows somewhat better agreement with measurements (middle, Figure 4). This suggests that much of this discrepancy is based in the LDGV emission factor. Considering the range of LDGV EFs calculated via eq 2 for this study (Figure 4; right side), the most conservative estimate for a LDGV emission factor (∼75 mg kg−1
fuel) is approximately a factor of 2 higher than other measurements, and a factor of 9 higher than the LDGV EF derived from MOBILE 6.2C (∼8 mg kg−1
fuel). The MOBILE model does not include a vehicle speed or engine load input for BC emissions. It is unclear what effects increased highway speeds (relative to the Ontario average) would have on these modeled emission factors, although it has been suggested that increased load increases BC emission factors for LDGV and HDDV.56A recent emission factor model (MOVES; http://www.epa.gov/otaq/ models/moves/index.htm) accounts for such variables and thus may slightly increase the emissions factor for LDGV BC.
Further confidence in the measured fuel-based BC emission factors is gained by comparing with travel-based EFs for BC (EFT) at this site, derived from a model of pollutant gradients which are not dependent upon CO2estimates. This approach
and results are described elsewhere,55but likewise results in BC emission factors significantly higher than current inventory estimates, while other pollutants are in good agreement with those derived from MOBILE 6.2C.
3.4. Discussion and Implications. Fleet-average, fuel-based emission factors measured with incandescence techniques (HS-LII and SP2) have not been previously reported. These measurements have the advantage of higher sensitivity and time resolution compared to traditional BC measurement techniques, resulting in improved BC concentration measurements on and near a typical North American highway. Subsequent BC EF estimates under these real-world conditions should provide an improved estimate of the BC emitted from the on-road transportation sector.
The present results also have implications for BC measure-ments, modeling, and emission regulations. All of the BC measurements used to quantify BC EFs to this point have utilized traditional techniques based on the thermal and/or optical properties of BC. These specifically include instruments based on thermal−optical transmittance, thermal conversion to CO2, BC absorption (i.e., PSAP, Aethalometer), and photo-acoustic spectrometry. A detailed description of many of these instruments is given elsewhere (31 and references therein). The large BC emission factors for LDGV reported here, relative to other measurements and the inventory, implies that in using other measurement methods, BC from gasoline vehicles may have been underestimated. Although uncertainties exist with respect to BC measurement with incandescence techniques (Section 2.2), overestimates of BC in this study due to false positive signals is not likely (Supporting Information).
Comparisons between the SP2, which we have shown here is biased low compared to the HS-LII when there is a significant amount of mass in small particle sizes, and many of the traditional BC measurement methods have been performed.31,57,58 In general there has been agreement among those measurements, with the exception of a recent study59which showed a 30−40% low bias for thermal−optical techniques relative to the SP2. However, none of those comparisons utilized BC particles from gasoline engines, or they were performed in areas dominated by diesel emissions, away from direct sources, and with observed ambient mass mode diameters >150 nm.57 Furthermore, the laboratory-generated BC particles used for comparison in those studies were also relatively large, typically ranging from 130 to 460 nm with varying degrees of organic coating. Although the organic coating of those studies had a relatively small effect on BC mass measurements, it is unclear how such methods would agree under the conditions utilized here; with the amount and nature of the organics associated with gasoline exhaust particles.
The mass mode diameter for BC particles (using thermal− optical detection of MOUDI samples) from gasoline engines during chassis-dynamometer studies has been reported to be >150 nm,60which is also consistent with measurements 18−37
m downwind of a gasoline dominated highway13(using the same method). This is in contrast to the BC mass mode diameter observed in this study for LDGV (Figure 3; <75 nm), although the BC core size in those studies is not clear. This difference may be in part due to large pressure drops in the final stages of the MOUDI which may result in negative artifacts such as evaporation of organic coatings and/or positive organic artifacts. Such artifacts may complicate accurate determination of BC depending on the thermal−optical method chosen.61 A dominant BC mass mode <75 nm for LDGV here suggests that further study is warranted, particularly in light of the known
Environmental Science & Technology Article
dx.doi.org/10.1021/es2033845 | Environ. Sci. Technol. 2012, 46, 4819−4828 4825
interferences associated with other methods62−64and the potential for uncertainty caused by different operational definitions of BC and OC.65,66
An underestimate in BC emissions from gasoline engines subsequently effects modeled BC emissions and concentrations, particularly when utilizing the emission factors in the current inventory (Figure 4). Relative to the LDGV reconstructed from our measurements, the MOBILE 6.2C derived emission factor for LDGV is at least a factor of 8−9 lower (HS-LII). Although there is uncertainty in estimating EFs with MOBILE 6.2C, it is unlikely that inclusion of speed or load inputs for BC, or more accurate CO2estimates, for example, will bridge this large gap. The gap between BC mass emissions of HDDV and LDGV is likely to shrink further as regulations for HDDV continue to take effect and alternate technologies for fuel delivery in gasoline vehicles (i.e., gasoline direct injection; GDI) become more popular. BC emissions from GDI engines have been observed to be significantly higher than those from conventional engines.67 The present results suggest that further dynamometer and on-road measurements of BC from gasoline vehicles are required in order to corroborate our findings and to improve emissions inventories in support of modeling, national and international policies, and estimates of impacts on health, the environment, and climate.
■
ASSOCIATED CONTENT*
S Supporting InformationInformation regarding methodologies and emission factor determination. This information is available free of charge via the Internet at http://pubs.acs.org/.
■
AUTHOR INFORMATIONCorresponding Author
*E-mail: john.liggio@ec.gc.ca.
Notes
The authors declare no competing financial interest.
■
ACKNOWLEDGMENTSThis research was supported through the Program of Energy Research and Development (PERD) under the specific Particle and Related Emission projects C11.008 and C12.007. PERD is a program administered by Natural Resources Canada.
■
REFERENCES(1) Gertler, A. W.; Gillies, J. A.; Pierson, W. R. An assessment of the mobile source contribution to PM10 and PM2.5 in the United States.
Water, Air Soil Pollut. 2000, 123 (1−4), 203−214.
(2) Kuhn, T.; Biswas, S.; Sioutas, C. Diurnal and seasonal characteristics of particle volatility and chemical composition in the vicinity of a light-duty vehicle freeway. Atmos. Environ. 2005, 39 (37), 7154−7166.
(3) Sakurai, H.; Tobias, H. J.; Park, K.; Zarling, D.; Docherty, S.; Kittelson, D. B.; McMurry, P. H.; Ziemann, P. J. Online measurements of diesel nanoparticle composition and volatility. Atmos. Environ. 2003,
37 (9−10), 1199−1210.
(4) Larson, S. M.; Cass, G. R.; Gray, H. A. Atmospheric carbon particles and the Los Angeles visibility problem. Aerosol Sci. Technol. 1989, 10, 118−130.
(5) Suglia, S. F.; Gryparis, A.; Wright, R. O.; Schwartz, J.; Wright, R. J. Association of black carbon with cognition among children in a prospective birth cohort study. Am. J. Epidemiol. 2008, 167 (3), 280− 286.
(6) Murr, L. E.; Garza, K. M. Natural and anthropogenic environmental nanoparticulates: Their microstructural characterization
and respiratory health implications. Atmos. Environ. 2009, 43 (17), 2683−2692.
(7) Chung, S. H.; Seinfeld, J. H. Climate response of direct radiative forcing of anthropogenic black carbon. J. Geophys. Res. 2005, 110, D11102 DOI: 10.1029/2004JD005441.
(8) Lohmann, U.; Feichter, J. Global indirect aerosol effects: A review. Atmos. Chem. Phys. 2005, 5, 715−737.
(9) Chen, W.-T.; Lee, Y. H.; Adams, P. J.; Nenes, A.; Seinfeld, J. H. Will black carbon mitigation dampen aerosol indirect forcing? Geophys.
Res. Lett. 2010, 37, L09801; doi:10.1029/2010GL042886.
(10) Yamanouchi, T. Early 20th century warming in the arctic: A review. Polar Sci. 2011, 5 (1), 53−71.
(11) McConnell, J. R.; Edwards, R.; Kok, G. L.; Flanner, M. G.; Zender, C. S.; Saltzman, E. S.; Ryan Banta, J.; Pasteris, D. R.; Carter, M. M.; Kahl, J. D. W. 20th-Century Industrial Black Carbon Emissions Altered Arctic Climate Forcing. Sci. Express 2007, 317 (5843), 1381− 1384.
(12) Bahadur, R.; Feng, Y.; Russell, L. M.; Ramanathan, V. Impact of california’s air pollution laws on black carbon and their implications for direct radiative forcing. Atmos. Environ. 2011, 45 (5), 1162−1167.
(13) Riddle, S. G.; Robert, M.; Jakober, C. A.; Hannigan, M. P.; Kleeman, M. J. Size-Resolved Source Apportionment of Airborne Particle Mass in a Roadside Environment. Environ. Sci. Technol. 2008,
42, 6580−6586.
(14) Ning, Z; Polidori, A.; Schauer, J. J.; Sioutas, C. Emission factors of PM species based on freeway measurements and comparison with tunnel and dynamometer studies. Atmos. Environ. 2008, 42, 3099− 3114.
(15) Miguel, A.; Kirchstetter, T. W.; Harley, R. A. On-Road Emissions of Particulate Polycyclic Aromatic Hydrocarbons and Black Carbon from Gasoline and Diesel Vehicles. Environ. Sci. Technol. 1998,
32, 450−455.
(16) Fujita, E. M.; Campbell, D. E.; Arnott, W. P.; Chow, J. C.; Zielinska, B. Evaluations of the chemical mass balance method for determining contributions of gasoline and diesel exhaust to ambient carbonaceous aerosols. J. Air Waste Manage. Assoc. 2007, 57 (6), 721− 740.
(17) Schauer, J. J.; Kleeman, M. J.; Cass, G. R.; Simoneit, B. R. T. Measurement of emissions from air pollution sources. 5. C1-C32 organic compounds from gasoline-powered motor vehicles. Environ.
Sci. Technol. 2002, 36, 1169−1180.
(18) Snelling, D. R.; Smallwood, G. J.; Liu, F; Gülder, O. L.; Bachalo, W. D. A calibration-independent laser-induced incandescence technique for soot measurement by detecting absolute light intensity.
Appl. Opt. 2005, 44 (31), 6773−6785.
(19) Moteki, N.; Kondo, Y. Effects of Mixing State on Black Carbon Measurements by Laser-Induced Incandescence. Aerosol Sci. Technol. 2007, 41, 398−417, DOI: 10.1080/02786820701199728.
(20) Chan, T. W.; Brook, J. R.; Smallwood, G. J.; Lu, G. Time-resolved measurements of black carbon light absorption enhancement in urban and near-urban locations of southern Ontario, Canada. Atmos.
Chem. Phys. 2011, 11, 10407−10432.
(21) Bond, T. C.; Bergstrom, R. W. Light absorption by carbonaceous particles: An investigative review. Aerosol Sci. Technol. 2006, 40 (1), 27−67.
(22) Coderre, A. R.; Thomson, K. A.; Snelling, D. R.; Johnson, M. R. Spectrally resolved light absorption properties of cooled soot from a methane flame. Appl. Phys. B. 2011, 104 (1), 175−188, DOI: 10.1007/ s00340-011-4448-9.
(23) Choi, M.; Hamins, A.; Mulholland, G.; Kashiwagi, T. Simultaneous optical measurement of soot volume fraction and temperature in premixed flames. Combust. Flame 1994, 99, 174−186. (24) Wu, J.; Krishnan, S.; Faeth, G. Refractive indices at visible wavelengths of soot emitted from buoyant turbulent diffusion flames.
J. Heat Transfer 1997, 119, 230−238.
(25) Crosland, B. M.; Johnson, M. R.; Thomson, K. A. Analysis of uncertainties in instantaneous soot volume fraction measurements using two-dimensional, auto-compensating, laser-induced incandes-cence (2D-AC-LII). Appl. Phys. B. 2011, 102 (1), 173−183.
(26) Stirn, R.; Gonzalez Baquet, T.; Kanjarkar, S.; Meier, W.; Geigle, K. P.; Grotheer, H. H.; Wahl, C.; Aigner, M. Comparison of Particle Size Measurements with Laser-Induced Incandescence, Mass Spec-troscopy, and Scanning Mobility Particle Sizing in a Laminar Premixed Ethylene/Air Flame. Combust. Sci. Technol. 2009, 181 (2), 329−349.
(27) Schwarz, J. P.; Gao, R. S.; Spackman, J. R.; Watts, L. A.; Thomson, D. S.; Fahey, D. W.; Ryerson, T. B.; Peischl, J.; Holloway, J. S.; Trainer, M.; Frost, G. J.; Baynard, T.; Lack, D. A.; de Gouw, J. A.; Warneke, C.; Del Negro, L. A. Measurement of the mixing state, mass, and optical size of individual black carbon particles in urban and biomass burning emissions. Geophys. Res. Lett. 2008, 35 (13), L13810 DOI: 10.1029/2008GL033968.
(28) Schwarz, J. P.; Spackman, J. R.; Gao, R. S.; Perring, A. E.; Cross, E.; Onasch, T. B.; Ahern, A.; Wrobel, W.; Davidovits, P.; Olfert, J.; Dubey, M. K.; Mazzoleni, C.; Fahey, D. W. The detection efficiency of the single particle soot photometer. Aerosol Sci. Technol. 2010, 44 (8), 612−628.
(29) Moteki, N.; Kondo, Y. Dependence of laser-induced incandescence on physical properties of black carbon aerosols: Measurements and theoretical interpretation. Aerosol Sci. Technol. 2010, 44 (8), 663−675.
(30) Schwarz, J. P.; Gao, R. S.; Fahey, D. W.; Thomson, D. S.; Watts, L. A.; Wilson, J. C.; Reeves, J. M.; Darbeheshti, M.; Baumgardner, D. G.; Kok, G. L.; Chung, S. H.; Schulz, M.; Hendricks, J.; Lauer, A.; Kärcher, B.; Slowik, J. G.; Rosenlof, K. H.; Thompson, T. L.; Langford, A. O.; Loewenstein, M.; Aikin, K. C. Single-particle measurements of midlatitude black carbon and light-scattering aerosols from the boundary layer to the lower stratosphere. J. Geophys. Res. 2006, 111, D16207 DOI: 10.1029/2006JD007076.
(31) Slowik, J. G.; Cross, E.; Han, J. -H.; Davidovits, P.; Onasch, T. B.; Jayne, J. T.; Williams, L. R.; Canagaranata, M. R.; Worsnop, D. R.; Chakrabarty, R. K.; Mossmuller, H.; Arnott, W. P.; Schwarz, J. P.; Gao, R. -S.; Fahey, D. W.; Kok, G. L.; Petzold, A. An Inter-Comparison of Instruments Measuring Black Carbon Content of Soot Particles. Aerosol
Sci. Technol. 2007, 41 (3), 295−314.
(32) Yli-Tuomi, T.; Aarnio, P.; Pirjola, L.; Makela, T.; Hillamo, R.; Jantunen, M. Emissions of fine particles, NOx and CO from on-road vehicles in Finland. Atmos. Environ. 2005, 39 (35), 6696−6706.
(33) Kean, A. J.; Harley, R. A.; Kendall, G. R. Effects of Vehicle Speed and Engine Load on Motor Vehicle Emissions. Environ. Sci. Technol. 2003, 37 (17), 3739−3746.
(34) Geller, M. D.; Sardar, S. B.; Phuleria, H.; Fine, P. M.; Sioutas, C. Measurements of particle number and mass concentrations and size distributions in a tunnel environment. Environ. Sci. Technol. 2005, 39, 8653−8663.
(35) Phuleria, H. C.; Geller, M. D.; Fine, P. M.; Sioutas, C. Size resolved emissions of organic tracers from light- and heavy duty vehicles measured in a California roadway tunnel. Environ. Sci. Technol. 2006, 40 (13), 4109−4118.
(36) Zavala, M.; Herndon, S.; Slott, R. S.; Dunlea, E.; Marr, L. C.; Shorter, J. H.; Zahniser, M.; Knighton, W. B.; Rogers, T. M.; Kolb, C. E.; Molina, L. T.; Molina, M. J. Characterization of on-road vehicle emissions in the Mexico City Metropolitan Area using a mobile laboratory in chase and fleet average measurement modes during the MCMA-2003 field campaign. Atmos. Chem. Phys. 2006, 6, 5129−5142. (37) Canagaratna, M. R.; Jayne, J. T.; Ghertner, D. A.; Herndon, S.; Shi, Q.; Jimenez, J. L.; Silva, P. J.; Williams, P.; Lanni, T.; Drewnick, F.; Demerjian, K. L.; Kolb, C. E.; Worsnop, D. R. Chase Studies of Particulate Emissions from in-use New York City Vehicles. Aerosol Sci.
Technol. 2004, 38, 555−573, DOI: 10.1080/02786820490465504.
(38) Wang, X.; Westerdahl, D.; Wu, Y.; Pan, X.; Zhang, M. On-road emission factor distributions of individual diesel vehicles in and around Beijing, China. Atmos. Environ. 2011, 45, 503−513.
(39) Zhu, Y.; Kuhn, T.; Mayo, P.; Hinds, W. C. Comparison of Daytime and Nighttime Concentration Profiles and Size Distributions of Ultrafine Particles near a Major Highway. Environ. Sci. Technol. 2006, 40, 2531−2536.
(40) Zhu, Y.; Hinds, W. C.; Shen, S.; Sioutas, C. Seasonal Trends of Concentration and Size Distribution of Ultrafine Particles Near Major
Highways in Los Angeles. Aerosol Sci. Technol. 2004, 38 (S1), 5−13, DOI: 10.1080/02786820390229156.
(41) Harris, S. J.; Maricq, M. Signature size distributions for diesel and gasoline engine exhaust particulate matter. Aerosol Sci. 2001, 32, 749−764.
(42) Holmen, B.; Ayala, A. Ultrafine PM Emissions from Natural Gas, Oxidation-Catalyst Diesel, and Particle-Trap Diesel Heavy-Duty Transit Buses. Environ. Sci. Technol. 2002, 36, 5041−5050.
(43) Robert, M. A.; Kleeman, M. J.; Jakober, C. A. Size and Composition Distributions of Particulate Matter Emissions: Part 2 Heavy-Duty Diesel Vehicles. J. Air Waste Manage. Assoc. 2007, 57, 1429−1438, DOI: 10.3155/1047-3289.57.12.1429.
(44) Grieshop, A. P.; Lipsky, E. M.; Pekney, N. J.; Takahama, S.; Robinson, A. L. Fine particle emission factors from vehicles in a highway tunnel: Effects of fleet composition and season. Atmos.
Environ. 2006, 40, S287−S298.
(45) Fraser, M. P.; Buzcu, B.; Yue, Z. W.; McGaughey, G. R.; Desai, N. R.; Allen, D. T.; Seila, R. L.; Lonneman, W. A.; Harley, R. A. Separation of Fine Particulate Matter Emitted from Gasoline and Diesel Vehicles Using Chemical Mass Balancing Techniques. Environ.
Sci. Technol. 2003, 37, 3904−3909.
(46) Lough, G. C.; Schauer, J. J.; Park, J. S.; Shafer, M. M.; Deminter, J. T.; Weinstein, J. P. Emissions of metals associated with motor vehicle roadways. Environ. Sci. Technol. 2005, 39 (3), 826−836.
(47) Canadian vehicle Survey: Summary Report; Office of Energy Efficiency, Natural Resources Canada, 2009; ISBN 978-0-662-06802-0. (48) Westerdahl, D.; Wang, X.; Pan, X.; Zhang, M. Characterization of on-road vehicle emission factors and microenvironmental air quality in Beijing, China. Atmos. Environ. 2009, 43, 697−705.
(49) Schneider, J.; Kirchner, U.; Borrmann, S.; Vogt, R.; Scheer, V. In situ measurements of particle number concentration, chemically resolved size distributions and black carbon content of traffic-related emissions on German motorways, rural roads and in city traffic. Atmos.
Environ. 2008, 42, 4257−4268.
(50) Weingartner, E.; Keller, C.; Stahel, W. A.; Burtscher, H.; Baltensperger, U. Aerosol Emission in road tunnel. Atmos. Environ. 1997, 31 (3), 451−462.
(51) Allen, J. O.; Mayo, P. R.; Hughes, L. S.; Salmon, L. G.; Cass, G. R. Emissions of size-segregated aerosols from on-road vehicles in the Caldecott Tunnel. Environ. Sci. Technol. 2001, 35, 4189−4197.
(52) Kirchstetter, T. W.; Harley, R. A.; Kreisberg, N. M.; Stolzenburg, M. R.; Hering, S. V. On-road measurement of fine particle and nitrogen oxide emissions from light- and heavy-duty motor vehicles.
Atmos. Environ. 1999, 33, 2955−2968.
(53) Gong, W.; Dastoor, A. P.; Bouchet, V. S.; Gong, S. L.; Makar, P. A.; Moran, M. D.; Pabla, B.; Menard, S.; Crevier, L.-P.; Cousineau, S.; Venkatesh, S. Cloud processing of gases and aerosols in a regional air quality model (AURAMS). Atmos. Res. 2006, 82, 248−275.
(54) National Inventory Report 1990−2009: Greenhouse Gas Sources
and Sinks in Canada; Pollutant Inventories and Reporting Division,
Environment Canada, 2009; http://www.ec.gc.ca/ges-ghg/.
(55) Gordon, M.; Staebler, R.; Liggio, J.; Makar, P.; Brook, J.; Li, S.-M.; Wentzell, J.; Lu, G.; Lee, P. Measured and modeled variation in near-highway pollutant gradients. Atmos. Environ. 2011.
(56) Zielinska, B.; Sagebiel, J.; McDonald, J. D.; Whitney, K.; Lawson, D. R. Emission rates and comparative chemical composition from selected in-use diesel- and gasoline-fueled vehicles. J. Air Waste
Manage. Assoc. 2004, 54 (9), 1138−1150.
(57) Kondo, Y.; Sahu, L.; Moteki, N.; Khan, F.; Takegawa, N.; Liu, X.; Koike, M.; Miyakawa, T. Consistency and traceability of black carbon measurements made by laser-induced incandescence, thermal-optical transmittance, and filter-based photo-absorption techniques.
Aerosol Sci. Technol. 2011, 45 (2), 295−312.
(58) Cross, E. S.; Onasch, T. B.; Ahern, A.; Wrobel, W.; Slowik, J. G.; Olfert, J.; Lack, D. A.; Massoli, P.; Cappa, C. D.; Schwarz, J. P.; Spackman, J. R.; Fahey, D. W.; Sedlacek, A.; Trimborn, A.; Jayne, J. T.; Freedman, A.; Williams, L. R.; Ng, N. L.; Mazzoleni, C.; Dubey, M.; Brem, B.; Kok, G.; Subramanian, R.; Freitag, S.; Clarke, A.; Thornhill, D.; Marr, L. C.; Kolb, C. E.; Worsnop, D. R.; Davidovits, P. Soot
Environmental Science & Technology Article
dx.doi.org/10.1021/es2033845 | Environ. Sci. Technol. 2012, 46, 4819−4828 4827
Particle StudiesInstrument Inter-ComparisonProject Overview.
Aerosol Sci. Technol. 2010, 44, 592−611, DOI: 10.1080/
02786826.2010.482113.
(59) Lan, Z.; Huang, X.; He, L.; Hu, M.; Xue, L.; Sun, T.; Hu, W.; Lin, Y.; Zhang, Y. Comparison of measurement results of several online carbonaceous aerosol monitoring techniques. Beijing Daxue
Xuebao (Ziran Kexue Ban)/Acta Scientiarum Naturalium Universitatis Pekinensis 2011, 47 (1), 159−165.
(60) Robert, M. A.; VanBergen, S.; Kleeman, M. J.; Jakober, C. A. Size and Composition Distributions of Particulate Matter Emissions: Part 1Light-Duty Gasoline Vehicles. J. Air Waste Manage. Assoc. 2007, 57, 1414−1428, DOI: 10.3155/1047-3289.57.12.1414.
(61) Cheng, Y.; Duan, F.-K.; He, K.-B.; Zheng, M.; Du, Z.-Y.; Ma, Y.-L.; Tan, J.-H. Intercomparison of thermal-optical methods for the determination of organic and elemental carbon: Influences of aerosol composition and implications. Environ. Sci. Technol. 2011, 45 (23), 10117−10123.
(62) Jimenez, J.; Claiborn, C.; Larson, T.; Gould, T.; Kirchstetter, T. W.; Gundel, L. Loading effect correction for real-time aethalometer measurements of fresh diesel soot. J. Air Waste Manage. Assoc. 2007,
57, 868−873.
(63) Cappa, C. D.; Lack, D. A.; Burkholder, J. B.; Ravishankara, A. R. Bias in Filter-Based Aerosol Light Absorption Measurements Due to Organic Aerosol Loading: Evidence from Laboratory Measurements.
Aerosol Sci. Technol. 2008, 42, 1022−1032.
(64) Lack, D. A.; Cappa, C. D.; Covert, D. S.; Baynard, T.; Massoli, P.; Sierau, B.; Bates, T. S.; Quinn, P. K.; Lovejoy, E. R.; Ravishankara, A. R. Bias in Filter-Based Aerosol Light Absorption Measurements Due to Organic Aerosol Loading: Evidence from Ambient Measure-ments. Aerosol Sci. Technol. 2008, 42, 1033−1041, DOI: 10.1080/ 02786820802389277.
(65) Countess, R. J. Interlaboratory Analysis of Carbonaceous Aerosol Samples. Aerosol Sci. Technol. 1990, 12, 114−121.
(66) Schmid, H.; Laskus, L.; Abraham, J. H.; Baltensperger, U.; Lavanchy, V.; Bizjak, M.; Burba, P.; Cachier, H.; Crow, D.; Chow, J.; Gnauk, T.; Even, A.; Brink, H. M.; Giesen, K.-P.; Hitzenberger, R.; Hueglin, C.; Maenhaut, W.; Pio, C.; Carvalho, A.; Putaud, J.-P.; Toom-Sauntry, D.; Puxbaum, H. Results of the “Carbon Conference” International Aerosol Round Robin Test Stage I. Atmos. Environ. 2001,
35, 2111−2121.
(67) Kamboures, M. A.; Hu, S.; Yu, Y.; Zhang, S.; Ling, R.; Sandoval, J.; Dzhema, I.; Huo, D.; Rieger, P. A baseline assessment and comparison of particulate matter and black carbon emissions from gasoline direct injection vehicles. Paper presented at the Air and Waste
Management Association - Symposium on Air Quality Measurement Methods and Technology, 2010; Vol. 2, pp 942−946.