Publisher’s version / Version de l'éditeur:
Technical Report, 2013-11-01
READ THESE TERMS AND CONDITIONS CAREFULLY BEFORE USING THIS WEBSITE.
https://nrc-publications.canada.ca/eng/copyright
Vous avez des questions? Nous pouvons vous aider. Pour communiquer directement avec un auteur, consultez la
première page de la revue dans laquelle son article a été publié afin de trouver ses coordonnées. Si vous n’arrivez pas à les repérer, communiquez avec nous à PublicationsArchive-ArchivesPublications@nrc-cnrc.gc.ca.
Questions? Contact the NRC Publications Archive team at
PublicationsArchive-ArchivesPublications@nrc-cnrc.gc.ca. If you wish to email the authors directly, please see the first page of the publication for their contact information.
NRC Publications Archive
Archives des publications du CNRC
For the publisher’s version, please access the DOI link below./ Pour consulter la version de l’éditeur, utilisez le lien DOI ci-dessous.
https://doi.org/10.4224/21270994
Access and use of this website and the material on it are subject to the Terms and Conditions set forth at
CNA wave pump platform design concept evaluation : numerical
modelling of floating moored bodies in regular sea states
Boileau, Renee; Raman-Nair, Wayne
https://publications-cnrc.canada.ca/fra/droits
L’accès à ce site Web et l’utilisation de son contenu sont assujettis aux conditions présentées dans le site LISEZ CES CONDITIONS ATTENTIVEMENT AVANT D’UTILISER CE SITE WEB.
NRC Publications Record / Notice d'Archives des publications de CNRC:
https://nrc-publications.canada.ca/eng/view/object/?id=f0607688-5795-45a2-a659-6b8d2298322d https://publications-cnrc.canada.ca/fra/voir/objet/?id=f0607688-5795-45a2-a659-6b8d2298322d
OCRE-TR-2013-043
NATIONAL RESEARCH COUNCIL CANADA OCEAN, COASTAL AND RIVER ENGINEERING
CNA wave pump platform design concept
evaluation: numerical modelling of floating
moored bodies in regular sea states
Technical Report
Renee Boileau and Wayne Raman-Nair November 1, 2013
DATE ◆♦✈❡♠❜❡r ✶✱ ✷✵✶✸
REPORT NUMBER PROJECT NUMBER SECURITY CLASSIFICATION DISTRIBUTION
❖❈❘❊✲❚❘✲✷✵✶✸✲✵✹✸ ❆✶✲✵✵✸✻✼✻ ❯♥❝❧❛ss✐✜❡❞ ❯♥❧✐♠✐t❡❞
TITLE
❈◆❆ ✇❛✈❡ ♣✉♠♣ ♣❧❛t❢♦r♠ ❞❡s✐❣♥ ❝♦♥❝❡♣t ❡✈❛❧✉❛t✐♦♥✿ ♥✉♠❡r✐❝❛❧ ♠♦❞❡❧❧✐♥❣ ♦❢ ✢♦❛t✐♥❣ ♠♦♦r❡❞ ❜♦❞✐❡s ✐♥ r❡❣✉❧❛r s❡❛ st❛t❡s
AUTHOR(S)
❘❡♥❡❡ ❇♦✐❧❡❛✉ ❛♥❞ ❲❛②♥❡ ❘❛♠❛♥✲◆❛✐r
CORPORATE AUTHOR(S)/PERFORMING AGENCY(S) PUBLICATION(Journal or Conference name)
SPONSORING AGENCY(S)
❈♦❧❧❡❣❡ ♦❢ t❤❡ ◆♦rt❤ ❆t❧❛♥t✐❝
RAW DATA STORAGE LOCATION(S) MODEL# PROP#
❚❡st❞❛t❛✿❭❚❡st❴❆✶✵✵✸✻✼✻❭❈❲❚
PROJECT✭NPArC✮ PEER REVIEWED EMBARGO PERIOD GROUP(NPARC)
◆♦ ✵ ❘❡s❡❛r❝❤
PROGRAM✭NPArC✮ FACILITY✭NPArC✮
▼■❊❲❘ ❙t✳❏♦❤♥✬s✿ P✳❖✳ ❇♦① ✶✷✵✾✸✱ ❆r❝t✐❝ ❆✈❡✱ ❙t✳ ❏♦❤♥✬s✱ ◆▲ ❆✶❇ ✸❚✺
KEYWORDS PAGES TABLES FIGS.
✇❛✈❡ ♣✉♠♣ ♣❧❛t❢♦r♠✱ ♥✉♠❡r✐❝❛❧ ♠♦♦r✐♥❣ ♠♦❞❡❧ ✈✐✐✱ ✽✸✱ ❆♣♣ ❆✲❈ ✶✶ ✶✽ SUMMARY ❚❤✐s r❡♣♦rt ♣r❡s❡♥ts t❤❡ r❡s✉❧ts ♦❢ ♥✉♠❡r✐❝❛❧ s✐♠✉❧❛t✐♦♥s ❢♦r t❤❡ ♣✉r♣♦s❡ ♦❢ ❛ss❡ss✐♥❣ t❤❡ s✉r✈✐✈❛❜✐❧✐t② ♦❢ ❛ ♠♦♦r❡❞ ♣❧❛t❢♦r♠ ✐♥ t❤❡ ▲♦r❞✬s ❝♦✈❡ ❡♥✈✐r♦♥♠❡♥t✳ ❆ t✐♠❡ ❞♦♠❛✐♥ ♥✉♠❡r✐❝❛❧ ♠♦❞❡❧ ✇❛s ✉s❡❞ t♦ ♣r❡❞✐❝t ♣❧❛t❢♦r♠ ♠♦t✐♦♥s ❛♥❞ ❧✐♥❡ t❡♥s✐♦♥s ✉♥❞❡r ❜♦t❤ t②♣✐❝❛❧ ♦♣❡r❛t✐♥❣ ❝♦♥❞✐t✐♦♥s ❛♥❞ ✐♥ ❡①tr❡♠❡ ❝♦♥❞✐t✐♦♥s ✭❤✉rr✐❝❛♥❡✮✳ ■♥♣✉ts t♦ t❤❡ ♥✉♠❡r✐❝❛❧ ♠♦❞❡❧ ✇❡r❡ ♣r♦✈✐❞❡❞ ❜② t❤❡ r❡s✉❧ts ♦❢ ♠♦❞❡❧ t❡sts✱ ❝♦♠♣✉t❛t✐♦♥s ❜② ❆◆❙❨❙ ❆◗❲❆ ❛♥❞ ♣✉❜❧✐s❤❡❞ ❞❛t❛ ❢♦r t❤❡ ♠♦♦r✐♥❣ ❧✐♥❡s✳ ❘❡s✉❧ts ✐♥❞✐❝❛t❡ t❤❛t✱ ❢♦r t❤❡ ♣❛r❛♠❡t❡rs ✐♥✈❡st✐❣❛t❡❞✱ t❤❡ ❧✐♥❡ t❡♥s✐♦♥s ❛r❡ ✇❡❧❧ ✇✐t❤✐♥ ❛❝❝❡♣t❛❜❧❡ s❛❢❡t② ♠❛r❣✐♥s✳ ■t ✐s r❡❝♦♠♠❡♥❞❡❞ t❤❛t ♠♦♦r✐♥❣ ❧✐♥❡s ❜❡ ❝❤♦s❡♥ st✐✛ ❡♥♦✉❣❤ t♦ ♠✐♥✐♠✐s❡ ♠♦t✐♦♥s ✉♥❞❡r ♦♣❡r❛t✐♥❣ ❝♦♥❞✐t✐♦♥s ✇✐t❤♦✉t ❜r❡❛❦✐♥❣ ✉♥❞❡r ❡①tr❡♠❡ ❡♥✈✐r♦♥♠❡♥t❛❧ ❝♦♥❞✐t✐♦♥s✳
National Research Council Canada Ocean, Coastal and River Engineering Conseil national de recherches Canada Génie océanique, côtier et fluvial UNCLASSIFIED
CNA wave pump platform design concept evaluation:
numerical modelling of floating moored bodies in regular sea
states
OCRE-TR-2013-043
Renee Boileau and Wayne Raman-Nair
OCRE-TR-2013-043
Abstract
This report presents the results of numerical simulations for the purpose of assessing the survivability of a moored platform in the Lord’s cove environment. A time domain numerical model was used to predict platform motions and line tensions under both typical operating conditions and in extreme conditions (hurri-cane). Inputs to the numerical model were provided by the results of model tests, computations by ANSYS AQWA and published data for the mooring lines. Re-sults indicate that, for the parameters investigated, the line tensions are well within acceptable safety margins. It is recommended that mooring lines be chosen stiff enough to minimise motions under operating conditions without breaking under extreme environmental conditions.
OCRE-TR-2013-043 Contents
Contents
List of Figures . . . . v List of Tables . . . . vi Glossary . . . . vii Acronyms . . . . vii 1 Introduction . . . . 12 Numerical model development . . . . 2
3 Determination of hydrodynamic inputs for numerical model . . . 3
3.1 Assumptions . . . 3
3.2 Known limitations . . . 3
3.3 Potential code validation with test data at natural frequencies . . . 3
4 Application of numerical model . . . 5
4.1 Platform concepts . . . 5
4.2 Scale . . . 5
4.3 Mooring concepts . . . 6
4.4 Wave definitions . . . 7
4.5 Numerical test matrix . . . 7
5 Results . . . . 8
6 Discussion . . . . 10
6.1 Coupled effects in physical testing . . . 10
6.2 Evaluation of ANSYS AQWA for predicting hydrodynamic coefficients . 11 6.3 Numerical mooring model sensitivities . . . 11
7 Conclusions . . . . 12
8 Recommendations for future work . . . . 12
OCRE-TR-2013-043 Contents
A Physical test method for hydrodynamic inputs . . . . 16
A.1 Model test apparatus . . . 16
A.2 Coordinate definition . . . 16
A.3 Data acquisition and pre-processing . . . 17
A.4 Calibrations . . . 17
A.5 Test program . . . 18
A.5.1 Surge (sway) damping . . . 18
A.5.2 Heave damping . . . 18
A.5.3 Roll (pitch) damping . . . 18
A.5.4 Test procedure . . . 18
A.5.5 Completed tests . . . 19
A.6 Calculation of hydrodynamic inputs . . . 19
A.7 Sources of error . . . 20
A.8 Test log . . . 20
B Potential code method for Hydrodynamic inputs . . . . 27
B.1 Geometry . . . 27 B.2 Point mass . . . 27 B.3 Mesh . . . 27 B.4 Analysis settings . . . 27 B.5 Solve hydrostatics . . . 29 B.6 Solve . . . 30
B.7 Comparison with natural frequency results from test data . . . 30
B.8 Common problems . . . 30
B.9 AQWA results . . . 32
B.10 Workflow options . . . 32
C Numerical mooring model results . . . . 70
OCRE-TR-2013-043 List of Figures
List of Figures
1 CNA wave pump platform concepts . . . 1
2 Platform models at the Clear Water Towing Tank (CWTT) . . . 4
3 Initial mooring configuration . . . 6
4 Platform response with wire rope . . . 9
5 Model animation . . . 10
6 Model #1 with Qualisys target balls . . . 16
7 Model and coordinate axes . . . 17
8 Trimmed models in CWTT trim tank . . . 19
9 Simplified model geometry . . . 28
10 Meshed models . . . 28
11 Platform response with synthetic Aramid rope . . . 71
12 Platform response with 20:80 synthetic/wire rope . . . 72
13 Platform #1 response by wave height . . . 73
14 Platform #1 response by wave period . . . 74
15 Platform #2 response by wave height . . . 75
16 Platform #2 response by wave period . . . 76
17 Platform #3 response by wave height . . . 77
OCRE-TR-2013-043 List of Tables
List of Tables
1 Hydrodynamic coefficient comparison . . . 4
2 Dimensions and mass properties at model and prototype scale . . . 5
3 Mooring line configurations . . . 6
4 Wave parameters . . . 7
5 Completed numerical test matrix . . . 8
6 Data channel list . . . 17
7 Completed physical test matrix . . . 20
8 Tank test log . . . 21
9 Model scale hydrostatics check . . . 29
10 ANSYS AQWA/Workbench reported issues . . . 31
11 Numerical model results for test program . . . 79
OCRE-TR-2013-043 Acronyms
Glossary
significant wave height mean height (trough to crest) of the one-third highest waves significant wave period mean of the periods corresponding to the significant waves
Acronyms
CAD computer-aided drawing CNA College of the North Atlantic CWTT Clear Water Towing Tank DOF degree of freedom SI System International
OCRE-TR-2013-043 1 Introduction
1
Introduction
The College of the North Atlantic (CNA) has engaged the NRC in the design of a wave pump to supply water to an onshore aquaculture centre at Lord’s Cove, Newfoundland. The pump must supply a minimum continuous flow requirement based on typical sea states and remain on station in sea states as high as hurricane conditions. In previous work, the sea states at Lord’s Cove have been characterized over a year of observa-tions [1] and a numerical model of a double-acting positive displacement pump has been developed [2].
The next stage in wave pump development is to compare platform and mooring designs. To that end, a numerical mooring model based on lumped mass theory has been applied; the numerical model can simulate the two-dimensional motions and line loads of a floating body with elastic catenary moorings in waves and current, given certain mass properties, hydrodynamic coefficients and external loads as inputs. This numerical model has been applied to floating bodies representing three different wave pump platform concepts developed in meetings between CNA and NRC.
To provide inputs for the numerical model, simple geometric (non-functioning) mod-els have been drafted in a computer-aided drawing (CAD) program for the three plat-form concepts. (Figure 1 shows views from the fabrication drawings.) The mass prop-erties are estimated directly from the CAD models.
15 14 5 7 7 11 4 7 14 11 6 8 13 7 7 8 8 9 8 13 10 12 2 12 1 2 3 6 7 7 8 11 11 02 02 NOTES:
REVISIONS HISTORY /HISTORIQUE DES RÉVISIONS
ZONE REV. DESCRIPTION DATE BY/PAR C4, B3 02 ADDED PIPE CAPS 13AUG2013 JS
ITEM
NO. PART NUMBER DECSRIPTION QTY. 1 A1-003676-00003 STEEL PLATE .75m x .75m 1 2 A1-003676-00010 FOAM .75m x .75m 2 3 A1-003676-00005 PLYWOOD .75m x .75m 4 Holes 1 4 A1-003676-00012 PIPE 1 MODEL 1 4 5 A1-003676-00013 PIPE 2 MODEL 1 1 6 A1-003676-00019 BALLAST PLUG 10 7 HNUT 0.5000-13-D-N HEX NUT 1/2"-13 UNC 20 8 FW 0.5 FLAT WASHER 1/2" 15 9 A1-003676-00016 THREADED ROD 1/2"-13 UNC x 24.5 Long 4 10 A1-003676-00017 THREADED ROD 1/2"-13 UNC x 21.75 Long 1 11 A1-003676-00020 PIPE CAP 4" 10 12 A1-003676-00006 PLYWOOD .75m x .75m 5 Holes 2
D C B A B C D 8 7 6 5 4 3 2 1
DO NOT SCALE DRAWING NE PAS MESURER SUR LE DESSIN REPORT ALL ERRORS TO THE DESIGN OFFICE SIGNALER TOUTES ERREURS AU BUREAU DE CONCEPTION
RETURN ALL DRAWINGS TO THE DESSIGN OFFICE RETOURNER TOUS LES DESSINS AU BUREAU DE CONCEPTION
TOLERANCES/TOLÉRANCES UNLESS OTHERWISE NOTED SAUF INDICATION CONTRAIRE
ALL DIMENSIONS IN INCHES DIMENSIONS EN P0UCES .X .020 .XX .010 .XXX .002 ALL FRACTIONS 1/32 ANGULAR .50 A1-003676-95 SEE NOTES Conseil national de recherches Canada National Research Council Canada DES. /CONCEPT. DFS/SCF FAB No. HEAT TREAT./TRAITMENT THERM. MATERIAL/MATÉRIEL
A FINISH/FINI
SEE NOTES SEE NOTES
Design and Fabrication Services Service de Conception et de Fabrication
ASSY, WAVE PUMP MODEL 1 (a) #1 14 9 13 12 2 5 14 3 5 6 3 1 5 5 6 12 11 13 10 5 6 5 8 6 7 5 6 7 3 12 12 4 4 NOTES:
REVISIONS HISTORY /HISTORIQUE DES RÉVISIONS
ZONE REV. DESCRIPTION DATE BY/PAR
ITEM NO. PART NUMBER DESCRIPTION QTY.
1 A1-003676-00004 STEEL PLATE .75m Dia. 1
2 A1-003676-00007 PLYWOOD .75m Dia. 1 Hole 1
3 A1-003676-00011 FOAM .75m Dia. 4
4 A1-003676-00018 BALLAST PLUG 6
5 HNUT 0.5000-13-D-N HEX NUT 1/2"-13 UNC 20
6 FW 0.5 FLAT WASHER 1/2" 15
7 A1-OO3676-00021 LARGE DIAMETER FLAT WASHER 2
8 A1-003676-00017 THREADED ROD 1/2"-13 UNC x 21.75 Long 1
9 A1-003676-00016 THREADED ROD 1/2"-13 UNC x 24.5 Long 4
D C B A B C D 8 7 6 5 4 3 2 1
DO NOT SCALE DRAWING NE PAS MESURER SUR LE DESSIN REPORT ALL ERRORS TO THE DESIGN OFFICE SIGNALER TOUTES ERREURS AU BUREAU DE CONCEPTION
RETURN ALL DRAWINGS TO THE DESSIGN OFFICE RETOURNER TOUS LES DESSINS AU BUREAU DE CONCEPTION
TOLERANCES/TOLÉRANCES UNLESS OTHERWISE NOTED SAUF INDICATION CONTRAIRE ALL DIMENSIONS IN INCHES DIMENSIONS EN P0UCES SEE NOTES Conseil national de recherches Canada National Research Council Canada HEAT TREAT./TRAITMENT THERM.
MATERIAL/MATÉRIEL
A
FINISH/FINI
SEE NOTES
Design and Fabrication Services Service de Conception et de Fabrication
(b) #2 (c) #3
Figure 1: CNA wave pump platform concepts
External (wave) loads are estimated for regular waves based on wave heights and periods representative of typical measured sea states at Lord’s Cove.
The hydrodynamic coefficients for each sea state are predicted using a potential code (ANSYS AQWATM).
OCRE-TR-2013-043 2 Numerical model development
tests in surge, heave and roll in the CWTT at NRC (St. John’s). Analysis of the test data provides validation data for hydrodynamic coefficients at the natural frequency in each mode. This aids in developing an independent, purely numerical method to predict platform performance without the need for physical model fabrication and testing.
The numerical model has been applied to predict maximum mooring line loads for the three platform concepts on two-dimensional taut catenary multi-point moorings recommended for point-absorber wave energy devices[3] with three material config-urations: wire rope, synthetic lines and lines with a combination of stiff and stretchy sections.
This report describes the work flow from design and fabrication of the platform models through comparison of hydrodynamic inputs predicted by potential code and physical test data to numerical simulation of the platforms on different moorings in a series of regular waves and comparison of the motion of the platforms and the robust-ness of the moorings. Details on a method for predicting hydrodynamic coefficients and validation with physical tank testing and AQWA are included in Appendices A and B; more detailed results are in Appendix C.
2
Numerical model development
The numerical mooring model used in this study is based on previous work[4] funded through the ecoENERGY Innovation Initiative (ecoEII) federal program. The numerical model uses mooring algorithms to simulate time-domain motion of a moored floating body with applied wave and/or current loads in typical and extreme wave environments. The model allows for touchdown on the seabed. This is a two-dimensional model that predicts surge, roll and heave motions.
The floating platform is modelled as a cylinder that is assigned mass properties from CAD that represent the platform’s more complex shape. The mooring lines are modelled as a series of lumped masses with mass properties from published sources. The numerical model includes scripts to check the hydostatics of the mooring line, which are useful for determining initial line length. The model is described in detail in the ecoEII report[4].
For this project, Matlab R scripts were developed to run the model in various
plat-form and line configurations in a series of wave conditions.
While mass properties can be extracted from CAD and lines and sea states can be defined from published data, the model requires hydrodynamic inputs from physical model tests or numerical simulation.
OCRE-TR-2013-043 3 Determination of hydrodynamic inputs for numerical model
3
Determination of hydrodynamic inputs for numerical model
The hydrodynamic inputs needed for the numerical model are added surge and heave mass, added roll inertia and damping coefficients, all of which depend on wave fre-quency. A method for determining these inputs for a variety of platform concepts without costly, time-consuming physical tests is desirable. Certain assumptions and limitations affect both the numerical and physical methods.
3.1 Assumptions
The comparisons between numerical and physical model data are based on the follow-ing assumptions:
◦ no coupling between modes
◦ “irregular frequencies” do not represent real responses
◦ shifts in natural frequency with and without added mass are negligible ◦ difference in test conditions between fresh and sea water are negligible
3.2 Known limitations
Limitations in the results from physical testing and AQWA simulations are known to include the following:
◦ tank test coupling occurs between channels but is at least an order of magnitude below the mode of interest
◦ tank testing is only representative at the natural frequency in each mode ◦ AQWA frequencies are limited by mesh size
3.3 Potential code validation with test data at natural frequencies
The potential code method was evaluated by comparing AQWA outputs at the natural frequency determined by test data for surge, heave and roll. Physical models were fabricated and trimmed to the design waterline in fresh water. Each model was excited in surge, heave and roll in the CWTT and the motion data were analysed in Matlab. To demonstrate independence from physical testing, all AQWA runs used inputs from the CAD models only. Figure 2 shows the three physical models used to estimate added mass and inertia and damping coefficients for each mode.
OCRE-TR-2013-043 3 Determination of hydrodynamic inputs for numerical model
Figure 2: Platform models at the CWTT
surge data could not be evaluated (negative added mass). Some disagreement is due to running the AQWA model in 30-♠-deep salt water (vs 5 ♠ fresh water in the CWTT). However, the damping coefficients are a factor of 3–5 lower than calculations from test data (not including surge, which is 5 orders of magnitude lower).
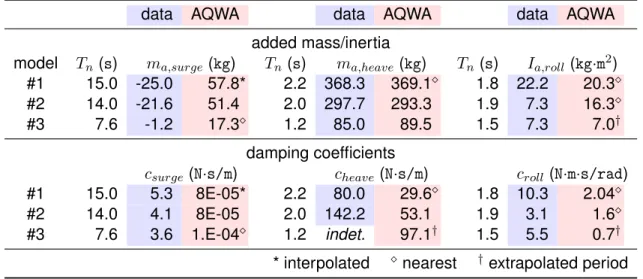
Table 1: Hydrodynamic inputs from physical test data and AQWA at natural periods, Tn
data AQWA data AQWA data AQWA
added mass/inertia
model Tn(s) ma,surge (❦❣) Tn(s) ma,heave(❦❣) Tn(s) Ia,roll (❦❣·♠2)
#1 15.0 -25.0 57.8* 2.2 368.3 369.1⋄ 1.8 22.2 20.3⋄
#2 14.0 -21.6 51.4 2.0 297.7 293.3 1.9 7.3 16.3⋄
#3 7.6 -1.2 17.3⋄ 1.2 85.0 89.5 1.5 7.3 7.0†
damping coefficients
csurge(◆·s✴♠) cheave (◆·s✴♠) croll(◆·♠·s✴r❛❞)
#1 15.0 5.3 8E-05* 2.2 80.0 29.6⋄ 1.8 10.3 2.04⋄
#2 14.0 4.1 8E-05 2.0 142.2 53.1 1.9 3.1 1.6⋄
#3 7.6 3.6 1.E-04⋄ 1.2 indet. 97.1† 1.5 5.5 0.7†
* interpolated ⋄ nearest †extrapolated period The AQWA results were considered more reliable in this case, and so are used exclusively for mooring model inputs. In addition to hydrodynamic inputs, the model requires mass properties, line configuration and external loads (waves).
OCRE-TR-2013-043 4 Application of numerical model
4
Application of numerical model
The two-dimensional numerical model has been used to predict line tensions and roll under a set of regular waves based on typical wave buoy data from Lord’s Cove in 2012. In total, the numerical test program spanned 45 configurations (3 platforms on 3 moorings in 5 regular waves) and numerous repeated runs to check model sensitivity and consistency.
4.1 Platform concepts
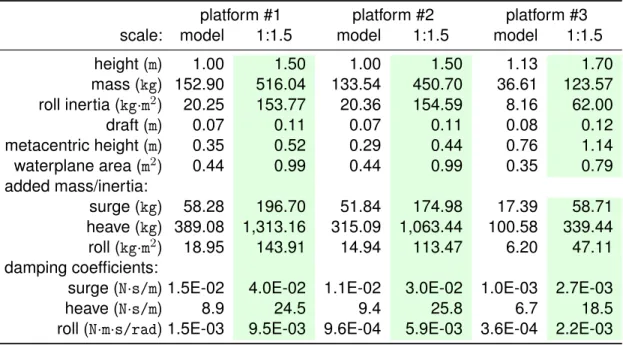
The three preliminary platform concepts (Figure 1) arose out of meetings between NRC and CNA in spring 2013. Two concepts are new and have been drafted in CAD; the third is based on a prototype from a previous joint project. Mass properties for the platforms are extracted from the CAD models. Table 2 lists the primary dimensions and mass properties for each physical model and numerical scale used in this study.
4.2 Scale
Since the physical models are presumably not large enough to provide the specified flow rate, all static and hydrodynamic inputs were arbitrarily scaled in length by 1.5 using Froude scaling.
Table 2: Dimensions and mass properties at model and prototype scale
platform #1 platform #2 platform #3
scale: model 1:1.5 model 1:1.5 model 1:1.5
height (♠) 1.00 1.50 1.00 1.50 1.13 1.70 mass (❦❣) 152.90 516.04 133.54 450.70 36.61 123.57 roll inertia (❦❣·♠2 ) 20.25 153.77 20.36 154.59 8.16 62.00 draft (♠) 0.07 0.11 0.07 0.11 0.08 0.12 metacentric height (♠) 0.35 0.52 0.29 0.44 0.76 1.14 waterplane area (♠2 ) 0.44 0.99 0.44 0.99 0.35 0.79 added mass/inertia: surge (❦❣) 58.28 196.70 51.84 174.98 17.39 58.71 heave (❦❣) 389.08 1,313.16 315.09 1,063.44 100.58 339.44 roll (❦❣·♠2 ) 18.95 143.91 14.94 113.47 6.20 47.11 damping coefficients:
surge (◆·s✴♠) 1.5E-02 4.0E-02 1.1E-02 3.0E-02 1.0E-03 2.7E-03
heave (◆·s✴♠) 8.9 24.5 9.4 25.8 6.7 18.5
OCRE-TR-2013-043 4 Application of numerical model
4.3 Mooring concepts
Three mooring line configurations were selected based on recommended moorings for point-absorber wave energy devices[3], which is similar in function to this wave pump application. The moorings are modelled in two dimensions: each mooring system consists of two identical catenary lines, fixed to anchor points 10 metres on either side of the platform and attached to points on either side of the platform centre of gravity (±0.6 ♠).
All moorings are pre-tensioned (taut) with the initial position above the wave peak, as shown in Figure 3. Each line was represented using 6 to 10 lumped masses.
Three line types were modelled: wire rope (steel), synthetic (AramidTM) lines and lines with a combination of stiff and elastic sections (20% synthetic: 80% wire rope).
Figure 3: Initial mooring configuration with lumped masses (×)
Table 3: Mooring line configurations
Aramid 6-strand wire rope 20:80 Aramid /wire rope
diameter (♠♠) 10 10 [10, 10]
lumped masses (count) 7 6-7 [10, 10]
unit density (❦❣✴♠) 0.14 0.43 [0.14, 0.43]
elastic modulus (●P❛) 57.3 19.1 [57.3, 19.1]
drag coefficient 1.5* 1.5* [1.5, 1.5]*
inertia coefficient 1.2* 1.2* [1.2, 1.2]*
* assumed based on similar study in [5]
OCRE-TR-2013-043 4 Application of numerical model
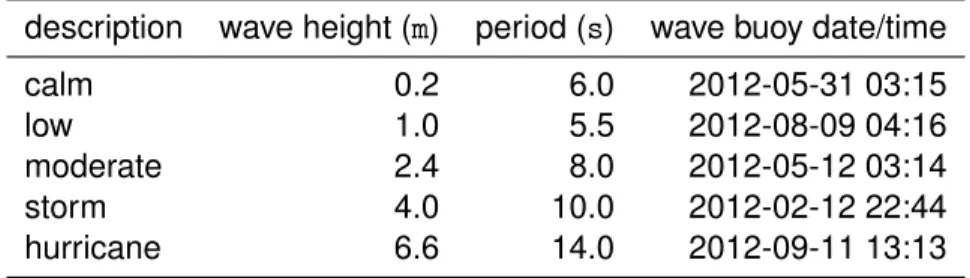
4.4 Wave definitions
A set of regular waves was defined by the significant wave height and significant wave period from a set of wave buoy data at a site approximately 1❦♠ from the harbour en-trance defined each regular wave. Five sea states typical of Lord’s Cove were selected from observations made in 2012[6], ranging from a light chop (“calm”) to hurricane force seas.
Table 4: Wave parameters
description wave height (♠) period (s) wave buoy date/time
calm 0.2 6.0 2012-05-31 03:15
low 1.0 5.5 2012-08-09 04:16
moderate 2.4 8.0 2012-05-12 03:14
storm 4.0 10.0 2012-02-12 22:44
hurricane 6.6 14.0 2012-09-11 13:13
4.5 Numerical test matrix
OCRE-TR-2013-043 5 Results
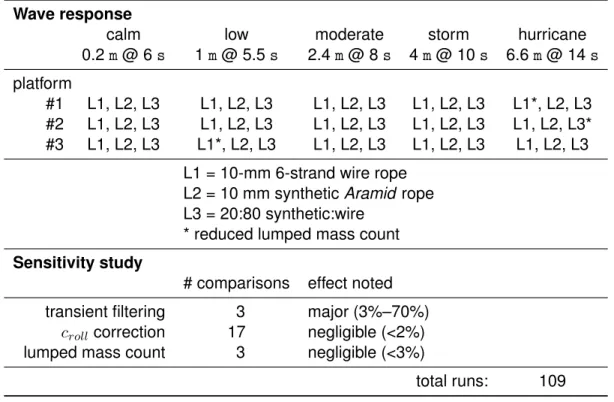
Table 5: Completed numerical test matrix
Wave response
calm low moderate storm hurricane
0.2♠ @ 6 s 1♠ @ 5.5 s 2.4♠ @ 8 s 4 ♠ @ 10 s 6.6 ♠ @ 14 s platform
#1 L1, L2, L3 L1, L2, L3 L1, L2, L3 L1, L2, L3 L1*, L2, L3 #2 L1, L2, L3 L1, L2, L3 L1, L2, L3 L1, L2, L3 L1, L2, L3* #3 L1, L2, L3 L1*, L2, L3 L1, L2, L3 L1, L2, L3 L1, L2, L3
L1 = 10-mm 6-strand wire rope L2 = 10 mm synthetic Aramid rope L3 = 20:80 synthetic:wire
* reduced lumped mass count
Sensitivity study
# comparisons effect noted
transient filtering 3 major (3%–70%)
crollcorrection 17 negligible (<2%)
lumped mass count 3 negligible (<3%)
total runs: 109
5
Results
The completed numerical test program provides results from 109 runs, covering 45 test configurations and repeats (due to incorrect inputs or intentional variations). For each run, the test configuration and model response were exported to a ✳❝s✈ file and the complete Matlab workspace was saved including animations.
Figure 4 summarizes the model responses for one line type (wire rope). Com-plete results, including similar plots for the other two moorings and maximum line ten-sions and roll angle for each model compared by sea state and mooring appear in Appendix C.
Maximum line tension is very similar for all three platforms. Platform #1 and #2 behave similarly in roll - #1 is slightly more stable than #2; #3 has a much lower roll response, possibly due to less wetted surface interacting with the wave.
A script is available to convert an animation to a real-time movie file (.avi). (Figure 5 shows a sample movie frame.)
OCRE-TR-2013-043 5 Results
calm low moderate storm hurricane
5 10 15 20 25 30 35 40 45 50 55 sea state maximum tension (N) platform #1 platform #2 platform #3
calm low moderate storm hurricane
0 5 10 15 20 25 30 35 40 sea state maximum roll ( ° ) platform #1 platform #2 platform #3
OCRE-TR-2013-043 6 Discussion
Figure 5: Sample frame from a numerical model animation
6
Discussion
Each phase of the test program was sensitive to potential sources of error due the variety of inputs (physical and numerical) and the complexity of transferring information between the CAD models, Qualisys data, Matlab results, potential code and numerical model with correct axes and units. Each step presented new challenges.
6.1 Coupled effects in physical testing
The results from physical model testing were sensible except for surge added mass, which was negative for all three models in most runs. Pull tests were conducted on both springs, with good agreement (22.3◆♠ and 22.7 ◆♠). It is thought that the spring mode may be more complex than expected. The source of negative added mass was not explored fully.
Fits to decay curves for heave and roll damping are imperfect due to coupling with other modes. This was minimized as much as practicable by careful excitation of the models, repeating tests in like and opposite initial displacements and using the least coupled runs for comparison with AQWA.
Results were also compared with GEDAP code written specifically for handling decay curves. Details on physical testing and analysis methods are provided in Ap-pendix A.
Due to the unreliable and limited physical results, the added mass and inertia and damping coefficients predicted by ANSYS AQWA were used as mooring model inputs.
OCRE-TR-2013-043 6 Discussion
6.2 Evaluation of ANSYS AQWA for predicting hydrodynamic coefficients
Physical testing only yields coefficients at the natural modes, unless the model is driven at other frequencies. Potential code, i.e., ANSYS AQWA, can provide results at any fre-quency above a limit imposed by the mesh size (in turn limited by number of elements allowed by the license). Exceptions are certain “irregular frequencies” noted, possibly due to sharp edges on Model #3.
Typical hazards were default settings such as sea depth (default 1 ❦♠) and units (default angles in degrees). AQWA output files were double-checked for each model.
Damping coefficients for surge are orders of magnitude less than the physical re-sults (which are arguable), but ultimately have little effect on the numerical model.
Some issues with rounding errors and/or blunt bodies may have affected the stabil-ity of the AQWA results.
These issues and methods for overcoming them are described in Appendix B.
6.3 Numerical mooring model sensitivities
The numerical mooring model is sensitive to starting position and number of lumped masses. However, steady state results show good agreement, so the methods used to ensure solution were effective.
The model will fail unless the body is above the wave peak to start; the input file automatically sets the initial point at one wave amplitude (2 · hm0) above water depth for each wave definition. Data is collected after the first two periods to eliminate transient effects due to this initial displacement.
The model will also fail when a light line is represented by too many lumped masses. Multiple runs were checked at different lumped mass counts to verify convergence in maximum line tensions and roll angles. Typically 7 lumped masses were used for simple, homogeneous lines and 10 for the composite line. The number of lumped masses for three runs was reduced to 6 to ensure a solution. Those results did not differ significantly (< 1%) from the case with 5 lumped masses.
Repeatability was checked by running the model with different inputs. Changing roll damping had negligible effect on maximum roll angle. Changing the number of lumped masses for mooring lines had minor effects. Less than 1% in variation were unaccounted for between repeated runs. (See Table 5 for a record of the repeatability check.)
OCRE-TR-2013-043 8 Recommendations for future work
7
Conclusions
The goal of this application of the numerical model was to aid in the selection of a platform design among three concepts and to demonstrate the effects of mooring on survivability. The response of these three models and three line configurations were largely indistinguishable: all three moorings survived hurricane conditions with less than 10% difference in maximum line load between platforms. The line tensions re-mained well below catalogue breaking strength for the materials selected (factor of safety = 10). The corners of Platform #1 reduce yaw coupling compared to Model #2. Model #3 shows more roll.
The three platform concepts behave comparably in regular waves; mooring design is relatively light with respect to line size and weight in these conditions.
8
Recommendations for future work
The following work is required to develop the numerical model so it can predict a power transfer function for the Lord’s Cove wave resource:
1. create inputs for complete wave spectra
2. translate wave conditions into time-series forces on pump piston(s)
If the mooring is designed to be stiff enough so that the platform can be assumed to have minimal motion under operating conditions, future predictions of flow rate can be made, eliminating the complexity of coupling the pump motion to the platform motion
This has demonstrated what can be done with a given set of design ideas. New inputs for different shapes can be extracted from AQWA with approximately 2–3 days effort and the numerical model can be re-run easily to generate wave responses in 10– 15 minutes per configuration. Future design choices can be readily evaluated using the method with significantly less effort, now that a robust work flow has been developed.
OCRE-TR-2013-043 References
References
[1] R. Boileau, “Wave resource assessment for Lord’s Cove, Newfoundland – 2012 survey,” National Research Council Canada, Technical Report OCRE-TR-2013-008, Jan. 2013.
[2] R. Boileau and W. Raman-Nair, “NRC wave pump tests for numerical model devel-opment,” NATIONAL RESEARCH COUNCIL CANADA, Technical Report OCRE-TR-2013-030, May 2013.
[3] R. E. Harris, L. Johanning, and J. Wolfram, “Mooring systems for wave energy converters: a review of design issues and choices,” in 3rd Intl. Conference on Marine Renewable Energy (MAREC 2004), Blythe, UK, 2004.
[4] W. Raman-Nair and R. Boileau, “Two-dimensional mooring dynamics for wave en-ergy converters,” National Research Council Canada, Technical Report TR-2012-04, Jan. 2012.
[5] L. Johanning, G. H. Smith, and J. Wolfram, “Mooring design approach for wave energy converters,” in J. Engineering for the MarItime Environment, vol. 220 Part M, 2006, pp. 159–174.
[6] R. Boileau and E. Baddour, “Wave resource assessment for Lord’s Cove, New-foundland – winter/spring 2012 survey,” National Research Council Canada, Tech-nical Report OCRE-TR-2012-19, Jul. 2012.
[7] K. Ogata, System Dynamics, 3rd ed. Prentice Hall, 1998, §6–3.
[8] S. C. Chapra and R. P. Canale, Numerical Methods for Engineers, 6th ed., D. B. Hash, Ed. McGraw-Hill, 2010.
OCRE-TR-2013-043
OCRE-TR-2013-043 A Physical test method for hydrodynamic inputs
A
Physical test method for hydrodynamic inputs
Hydrodynamic inputs, including added mass and inertia and damping coefficients were determined experimentally for the natural frequency in each mode by exciting the model and observing the period and decay rate of its oscillations. The three CNA models were characterized in surge, heave and roll. The method used for surge is based on the mass-spring parameter identification method in [7, §6.3]; the methods for heave and roll are described in [8, §17.3–17.4].
A.1 Model test apparatus
Two models were fabricated from NRC drawings by CNA. An existing pump platform model was modified to make the third model. Model #1 is square in cross-section, Model #2 is circular and Model #3 has a rectangular float with a spar-like submerged body.
Position and motion are measured relative to an arbitrary point in space by a isys motion capture camera system installed on the CWTT tow carriage. Three Qual-isys target balls are mounted on rods attached to the model, as shown in Figure 6.
Figure 6: Model #1 with Qualisys target balls (circled in red)
A.2 Coordinate definition
By naval architecture convention, the positive z-axis is down. The “bow” of each model is marked on the upper surface of the float with an arrow pointing forward; this defines the direction of the positive x-axis (”forward”). The positive y-axis (”starboard”) is de-fined using the right hand rule. This convention is followed in the CAD drawings and in data channel names.
OCRE-TR-2013-043 A Physical test method for hydrodynamic inputs x y z Global origin x y z Model origin
Figure 7: Model and coordinate axes
A.3 Data acquisition and pre-processing
Data was sampled from the Qualisys system using the towing tank data acquisition system. Eight channels were recorded for 6 degree of freedom (DOF) position, as listed in Table 6. Data were sampled at 50 ❍③; however, Qualisys was only set to provide data at 26❍③ for the first day of testing (this is noted in the test log).
Table 6: Data channel list
channel # name units note
1 X (Body 1) ♠ surge
2 Y (Body 1) ♠ sway
3 Z (Body 1) ♠ heave
4 Yaw (Body 1) ❞❡❣ rotation about z
5 Pitch (Body 1) ❞❡❣ rotation about y
6 Roll (Body 1) ❞❡❣ rotation about x
7 Residual (Body 1) - measurement error
A.4 Calibrations
OCRE-TR-2013-043 A Physical test method for hydrodynamic inputs
A.5 Test program
The test program included manually-initiated surge, heave and roll damping tests. (Pitch and sway damping tests were also conducted, although not needed for the nu-merical mooring model.)
A.5.1 Surge (sway) damping
Surge oscillation is generated by pushing the model with a long pole either forward or aft (abeam for sway) parallel to the long side of the tow tank to create an initial displacement and then releasing it suddenly. The test is repeated multiple times from different directions and by pushing on different points (upper or middle body section).
A.5.2 Heave damping
Heave oscillation is generated by suspending the model a few centimetres above the draft waterline by a single line and releasing it suddenly by cutting the line.
A.5.3 Roll (pitch) damping
Roll oscillation is generated by pushing the model with a long pole either down or up to create an initial angle about the x (or y for pitch) axis and then releasing it suddenly. The test is repeated multiple times from different directions and by pushing on different points (upper or middle body).
A.5.4 Test procedure
The following steps were followed for each of the three models.
1. The waterline is checked against the fabrication drawing in the CWTT trim tank and the ballast adjusted to level it, as shown in Figure 8.
2. The model is towed to a position under the towing carriage and attached to two horizontal (submerged) springs, fore and aft, which are fixed to a point on the carriage via pulleys and steel cable.
3. Surge damping tests are performed at least twice with the model in each of the following orientations:
◦ bow pointing down the tank, springs attached fore and aft
◦ bow pointing 45◦from the tank wall, springs attached to diagonal points ◦ bow pointing toward the tank side, springs attached port and starboard
OCRE-TR-2013-043 A Physical test method for hydrodynamic inputs
(a) model #1 (b) model #2 (c) model #3
Figure 8: Trimmed models in CWTT trim tank
4. Roll damping tests are performed at least twice with the model in each of the following orientations:
◦ bow pointing down the tank, springs attached fore and aft ◦ bow pointing down the tank, free floating (no springs)
◦ bow pointing 45◦from the tank wall, springs attached to diagonal points ◦ bow pointing 45◦from the tank wall, free floating
◦ bow pointing toward the tank side, springs attached port and starboard ◦ bow pointing toward the tank side, free floating
5. Heave damping tests are performed twice.
6. After testing, the model is inclined in the CWTT trim tank to verify mass properties from Solidworks.
A.5.5 Completed tests
The completed test matrix is given in Table 7. In total, 142 tests were completed (in 37 data runs) for 31 different test conditions.
A.6 Calculation of hydrodynamic inputs
Added mass and inertia and damping coefficients were calculated using Matlab scripts and functions based on [7] and [8]. Several results were checked against damping
OCRE-TR-2013-043 A Physical test method for hydrodynamic inputs
Table 7: Completed physical test matrix
surge sway heave captive pitch free pitch
yaw angle 0◦ 45◦ 0◦ n/a 90◦ 90◦ 90◦
tank orientation long. long. long. n/a long. long. lat. excitation count
#1 7x 9x 2x 1x
platform #2 8x 8x 2x 2x
#3 6x 5x 6x 2x 6x 8x 6x
captive roll free roll
yaw angle 0◦ 45◦ 0◦ 0◦ 45◦ 45◦
tank orientation long. long. long. lat. long. lat. excitation count
#1 5x 7x 3x 2x 2x 2x
platform #2 6x 6x 3x 2x 4x 4x
#3 6x 6x 3x 3x
A.7 Sources of error
In this experiment, systematic errors include measurement error, variation between springs and differences in sampling rates. The estimated accuracy for Qualisys posi-tion is better than ±1 ♠♠ and ±0.1◦; the three tracking balls are arranged in a plane nearly parallel to the model yz-plane, so measurements in that plane will have the low-est accuracy (i.e., sway and roll). Spring constants were averaged between the two springs (22.5 ± 0.2 ◆✴♠). For runs in which Qualisys data were sampled at 26 ❍③ (vs data acquisition at 50❍③), data were interpolated linearly.
The largest source of error is coupling between modes (e.g., yaw response during roll damping tests), especially when the model is unrestrained: coupled amplitudes were generally an order of magnitude below the main mode. Tank wall and bottom re-flections also interacted with the model after a certain time, although this was mitigated by manually selecting data before any apparent effect.
A.8 Test log
The following table is a log of tank testing including in situ notes, taken verbatim from the file❆✶❴✵✵✸✻✼✻❴t❡st ❧♦❣✳①❧s.
OCRE-TR-2013-043 A Ph ysical test met hod for h ydrodynamic
Table 8: Tank test log (excitation count added in green)
DATE START WAIT FILENAME(.DAQ) excit. RUN Video COMMENTS TIME TIME count DESCRIPTION Track #
27-Aug-13 Begin Tank Setup
" 12:11 00:04 SURGE_DAMPING_M1_001 2 Surge Decay, Model 1, 0deg heading " 12:15 01:34 ROLL_DAMPING_M1_001 1 Roll Decay,
Model 1, 0deg heading
" Springs were too stiff. Replaced
them with longer softer springs. " 13:49 00:13 SURGE_DAMPING_M1_002 2 Surge Decay,
Model 1, 0deg heading
1 model was pushed from cable at-tachment point.
" 14:02 00:14 SURGE_DAMPING_M1_003 3 Surge Decay, Model 1, 0deg heading
1 model was pushed from top deck
" 14:16 00:26 ROLL_DAMPING_M1_002 4 Roll Decay, Model 1, 0deg heading
2 1st two segmants were pushed down unto top deck, 3rd segment was pulled up from mid deck, 4th segment was pushed down unto mid deck.
" rotate model 45deg
" 14:42 00:13 SURGE_DAMPING_H45_M1_001 3 Surge Decay, Model 1, 45deg heading
3 three segments were pushed from the mid deck(aft to fwd)
" 14:55 00:14 SURGE_DAMPING_H45_M1_002 3 Surge Decay, Model 1, 45deg
4 three segments were pushed from the top deck(aft to fwd)
OCRE-TR-2013-043 A Ph ysical test met hod for h ydrodynamic inputs
DATE START WAIT FILENAME(.DAQ) excit. RUN Video COMMENTS
TIME TIME count DESCRIPTION Track #
" 15:09 00:11 ROLL_DAMPING_H45_M1_001 4 Roll Decay, Model 1, 45deg heading
5 1st two segmants were pushed down unto mid deck, 3rd & 4th segments were pulled up from mid deck.
" 15:20 00:14 SURGE_DAMPING_H45_M1_003 3 Surge Decay, Model 1, 45deg heading
6 1st segment was puched from the aft to fwd, 2nd & 3rd segments were pushed from the fwd to aft. All seg-ments were at the mid deck. " 15:34 ROLL_DAMPING_H45_M1_002 3 Roll Decay,
Model 1, 45deg heading
7 1seg - large amp, 2nd small amp, 3rd seg normal amp. (resaved as ROLL_DAMPING_H45_M1_003
28-Aug-13 Disconnected model from mooring.
Repeat roll decay at 0 & 45deg heading
" 08:33 00:14 ROLL_DAMPING_M1_FREE_001 5 Roll Decay, Model 1, 0deg heading, free (unmoored)
8 The first 3 seg were roll, the forth was pitch, the 5th & 6th were with the model rotated 90deg so that the roll was orietated up the tank in-stead across the tank.
" 08:47 00:28 ROLL_DAMPING_H45_M1_FREE_001 6 Roll Decay, Model 1, 45deg heading, free (unmoored)
9 The first 2 seg were roll, the 3rd & 4th were junk, the 5th & 6th were with the model rotated 90deg so that the roll was orientated up the tank instead across the tank.
" 09:15 00:21 HEAVE_DAMPING_M1_FREE_001 1 Heave Decay, Model 1, free (unmoored)
10 lifted by crane til bottom of float just submerged
" 09:36 00:24 HEAVE_DAMPING_M1_FREE_002 1 Heave Decay, Model 1, free (unmoored)
11 lifted by crane til bottom of float just submerged
continued. . .
OCRE-TR-2013-043 A Ph ysical test met hod for h ydrodynamic inputs
DATE START WAIT FILENAME(.DAQ) excit. RUN Video COMMENTS TIME TIME count DESCRIPTION Track #
" removed Model 1 and prepared
Model 2.
" 10:00 00:18 Installed Model 2
" 10:18 00:17 SURGE_DAMPING_M2_001 4 Surge Decay, Model 2, 0deg heading
12 1st three segments were pushed from the mid deck(aft to fwd), 4th segment from top deck(aft to fwd) " 10:35 00:27 SURGE_DAMPING_M2_002 4 Surge Decay,
Model 2, 0deg heading
13 1st three segments were pushed from the mid deck(fwd to aft), 4th segment from top deck(fwd to aft), resaved as SURGE_DAMPING_M2_003 WAIT TIME = 14:36
" 11:02 00:19 ROLL_DAMPING_M2_001 6 Roll Decay, Model 2, 0deg heading
14 1st three segments were pushed from the top deck, the last three segments were from mid deck.
toprule " rotate model 45deg
" 11:21 00:15 SURGE_DAMPING_H45_M2_001 4 Surge Decay, Model 2, 45deg heading
15 1st three segments were pushed from the mid deck(aft to fwd), 4th segment from top deck(aft to fwd) " 11:36 00:15 SURGE_DAMPING_H45_M2_002 4 Surge Decay,
Model 2, 45deg heading
16 1st three segments were pushed from the mid deck(fwd to aft), 4th segment from top deck(fwd to aft) " 11:51 01:18 ROLL_DAMPING_H45_M2_001 6 Roll Decay,
Model 2, 45deg heading
17 1st three segments were pushed from the top deck, the last three segments were from mid deck.
toprule " Disconnected model from mooring.
Repeat roll decay at 0 & 45deg heading
" 13:09 00:12 ROLL_DAMPING_M2_FREE_001 5 Roll Decay, Model 2, 0deg
18 The first 3 seg were roll, the 4th & 5th was pitch, the 5th & 6th were
OCRE-TR-2013-043 A Ph ysical test met hod for h ydrodynamic inputs
DATE START WAIT FILENAME(.DAQ) excit. RUN Video COMMENTS
TIME TIME count DESCRIPTION Track #
" 13:21 00:15 ROLL_DAMPING_H45_M2_FREE_001 5 Roll Decay, Model 2, 45deg heading, free (unmoored)
n/a The first 2 seg were roll, the 3rd & 4th were with the model rotated 90deg so that the roll was orientated up the tank instead across the tank. Video missed.
" 13:36 00:05 HEAVE_DAMPING_M2_FREE_001 1 Heave Decay, Model 2, free (unmoored)
19 lifted by crane til bottom of float just submerged
" 13:41 00:49 HEAVE_DAMPING_M2_FREE_002 1 Heave Decay, Model 2, free (unmoored)
20 lifted by crane til bottom of float just submerged
" removed Model 2 and prepared
Model 3
" 14:30 00:37 Installed Model 3
" 15:07 00:13 SURGE_DAMPING_M3_001 6 Surge Decay, Model 3, 0deg heading
21 1st three segments were pushed from inside bottom of top tank(aft to fwd), segments 4 to 6 were pushed from inside bottom of top tank(fwd to aft).
" 15:20 ROLL_DAMPING_M3_001 6 Roll Decay, Model 3, 0deg heading
22 The first 4 segments were pushed down, the last segments were pulled up.
" rotate model 90deg
29-Aug-13 08:16 00:17 Sway_DAMPING_M3_001 6 Surge Decay, Model 3, 90deg heading
23 1st four segments were pushed from inside bottom of top tank(aft to fwd), segments 5 & 6 were pushed from inside bottom of top tank(fwd to aft). Video Annotation says surge & H90, should be same as filename.
continued. . .
OCRE-TR-2013-043 A Ph ysical test met hod for h ydrodynamic inputs
DATE START WAIT FILENAME(.DAQ) excit. RUN Video COMMENTS TIME TIME count DESCRIPTION Track #
" 08:33 00:18 PITCH_DAMPING_M3_001 6 Roll Decay, Model 3, 90deg heading
24 The first 3 segments were pushed down, the last 3 segments were pulled up.
" rotate model 45deg
" 08:51 00:13 SURGE_DAMPING_H45_M3_001 5 Surge Decay, Model 3, 45deg heading
25 1st three segments were pushed from inside corner of top tank(aft to fwd), segments 4 & 5 were pushed from inside corner of top tank(fwd to aft).
" 09:04 00:19 ROLL_DAMPING_H45_M3_001 6 Roll Decay, Model 3, 45deg heading
26 The first 3 segments were pushed down, the last 3 segments were pulled up from flange.
Remove model from mooring and setup for free tests.
" 09:23 00:11 ROLL_DAMPING_M3_FREE_001 6 Roll Decay, Model 3, free (unmoored)
27 The first 3 seg were transverse roll, the last 3 were longitudinal roll - with the model rotated 90deg so that the roll was orientated up the tank in-stead across the tank.
" 09:34 00:10 PITCH_DAMPING_M3_FREE_001 5 Pitch Decay, Model 3, free (unmoored)
28 The first 3 seg were transverse roll, the last 3 were longitudinal roll - with the model rotated 90deg so that the roll was orientated up the tank in-stead across the tank.
Qualisys body cooridinates went off during run. Reset Qualisys and re-peat run.
" 09:44 00:25 PITCH_DAMPING_M3_FREE_002 8 Pitch Decay, Model 3, free (unmoored)
29 The first 3 seg were longitudinal roll - with the model rotated 90deg so that the roll was orientated up the
OCRE-TR-2013-043 A Ph ysical test met hod for h ydrodynamic inputs
DATE START WAIT FILENAME(.DAQ) excit. RUN Video COMMENTS
TIME TIME count DESCRIPTION Track #
" 10:09 00:11 HEAVE_DAMPING_M3_FREE_001 1 Heave Decay, Model 3, free (unmoored)
30
" 10:20 HEAVE_DAMPING_M3_FREE_002 1 Heave Decay, Model 3, free (unmoored)
31
OCRE-TR-2013-043 B Potential code method for Hydrodynamic inputs
B
Potential code method for Hydrodynamic inputs
The hydrodynamic inputs for the numerical mooring model were estimated for a range of wave periods using the AQWATM Hydrodynamic Diffraction module in ANSYS Work-bench (v14.5). AQWA needs a geometry, mass properties, wave directions and fre-quencies to run. The workflow for AQWA includes the following steps:
1. define the geometry 2. set mass properties 3. mesh the model 4. check hydrostatics
5. set up analysis and wave environments 6. choose outputs and solve
7. check results
B.1 Geometry
The geometry for each platform is generated in ANSYS Design ModelerTM. The plat-form is drawn from the top down, starting on a plane offset from the XY-plane (a.k.a. the water plane) by the design draft. The dimensions are specified in metres so that outputs are SI.
B.2 Point mass
The mass properties are defined in a Point Mass element added to the geometry, including position of centre of gravity and moments of inertia extracted from the CAD models.
B.3 Mesh
Each model is meshed using automatic mesh generation in Workbench.
B.4 Analysis settings
Water density is set to 1025 ❦❣·♠2
con-OCRE-TR-2013-043 B Potential code method for Hydrodynamic inputs
(a) #1 (b) #2 (c) #3
Figure 9: Simplified model geometry in ANSYS Design Modeler
(a) #1 (b) #2 (c) #3
Figure 10: Meshed models in ANSYS Workbench
OCRE-TR-2013-043 B Potential code method for Hydrodynamic inputs
CWTT depth 5♠) – it is assumed that disagreement in results due to these settings is negligible, so the runs were not repeated due to time constraints.
Wave directions are aligned forward, aft and diagonal with respect to the model “bow” as defined in physical testing; model #3 runs also include sway. The range of wave frequencies (specified as periods ins) included each sea state of interest for this study.
The complete analysis settings for each model are included in tables 1–16 in the AQWA reports in §B.9
B.5 Solve hydrostatics
The depth of the centre of gravity, principle moments of inertia and the wetted surface (specified by the draft dimension) determine the program-controlled mass calculation in AQWA.
Table 9 compares the results from AQWA based on CAD inputs with the expected values from Solidworks and measured mass from the physical models on a crane scale.
Table 9: Model scale hydrostatics check
property zcg* draft metacentric height mass
♠ (flooded) ♠ ♠ ❦❣ (dry) (flooded)
Model #1 Solidworks −0.730 0.070 0.345 141.89 152.90 crane scale† 143.4 AQWA −0.730 0.070 Model #2 Solidworks −0.631 0.070 0.293 123.56 133.54 crane scale† 119.9 AQWA −0.631 0.070 Model #3 Solidworks −0.460 0.082 0.760 36.61 crane scale† 34.1 AQWA −0.460 0.082
*vertical centre of gravity measured from waterline †TCI model LPC-4-AC ± 0.2 ❧❜s = 0.1 ❦❣
OCRE-TR-2013-043 B Potential code method for Hydrodynamic inputs
B.6 Solve
Each run with 10 wave periods from 3 or 4 directions typically took 1.5–2 hours to solve. Solutions included added surge and heave mass, added roll inertia and damping coefficients for each surge, heave and roll. For Platform #3, motion was checked to ensure rigid body motion, since fine rods connecting the float and heave plate were neglected.
B.7 Comparison with natural frequency results from test data
Hydrodynamic inputs from AQWA were compared with results calculated from test data by selecting added mass/inertia and damping coefficient for one mode (i.e., surge, heave or roll) at the natural period observed in the physical model tests for that mode and the nearest (or interpolated) AQWA period.
B.8 Common problems
Several issues arose that caused solutions to fail to run or to abort or that resulted in corrupted files. Some workarounds are listed in Table 10
Paul Schofield at ANSYS Technical Support confirmed known issues and has sub-mitted defects, some of which will be addressed in v15. He could not replicate ◆❛◆ results, although his results included extremely large and/or negative added mass at some frequencies.
OCRE-TR-2013-043 B Potential code method for Hydrodynamic inputs
Table 10: ANSYS AQWA/Workbench reported issues
Issue Workaround
Failure to run
frequency order AQWA fails to start with
added frequencies. Frequency high-lighted in yellow, no error (irrespective of initial range).
Select frequencies in ascending order.
Aborted run
abort with error unspecified error message
after running all frequencies:
Hydrodynamic Diffraction (B4): COMPLETED SUCCESSFULLY
Hydrodynamic Diffraction (B4):
TERMI-NATED WITH ERRORS
Hydrodynamic Diffraction (B4): Solve
aborted!
Possible irregular frequency. Check ❆◆❆▲❨❙■❙✳▲■❙ for ◆❛◆ re-sults. Conduct separate sensitivity study around trouble frequency to confirm anomaly. Re-run main study replacing❬NaN] frequencies with nearby solved frequencies. Unexpected results
wrong frequencies Results are for
frequen-cies other than original specification. (Fre-quencies change after any change to model or mesh; interval and count do not recalculate reliably.)
Always check frequencies, interval and number of intermediate fre-quencies LAST. Toggle selection method from period to frequency and back to clear impossible recal-culations.
Corrupted database
disappearing geometry when launching AQWA in Workbench after changing geometry.
Known issue with multi-threaded database (tree) check. Delete AQWA element and start again. Archive frequently. Upgrade to v15 when released.
error opening file Use of multiple parameters
or loss of network drive connection may trigger database corruption.
File cannot be recovered. Archive frequently. Upgrade to v15 when released.
OCRE-TR-2013-043 B Potential code method for Hydrodynamic inputs
B.9 AQWA results
ANSYS Workbench produces complete reports for each run — the reports on the CNA platforms at model scale follow this page.
B.10 Workflow options
While this workflow worked for this set of models, several options may be considered for future work.
Imported geometry from CAD Geometry can be imported directly from CAD, e.g.,
as a parasolid file; Design Modeler has a Simplify tool to eliminate small parts. However, the each pump platform fabrication drawings included up to 130 parts, which would have taken more time to simplify than drawing from scratch.
Mesh refinement To reduce the total number of elements while accurately modelling
small details, a model with a small feature can be meshed locally with finer el-ements by splitting the body (Slice or Freeze) before joining as a part. Add a Mesh Control to the body in the Mesh tool. While AQWA requires a slice at the waterline (XY plane), it will also accept multiple bodies broken on other planes.
Project
Name Project
Data Folder Root C:\Users\BoileauR.IOTPC\Documents\ANSYS working files\CNA model 1_files\dp0\AQW\AQW Date of Creation 2013-10-03 17:21:42
Last Modified 2013-10-08 12:57:18
Product Version 14.5 RELEASE
Page 1 of 12 Project
2013-10-08 file:///C:/Users/BoileauR.IOTPC/AppData/Roaming/Ansys/v145/AQWA_Report/AQW...
Contents z Units z Model (B3) { Geometry CNA CNA Axes Point Mass Topsides Submerged { Connections Catenary Data { Mesh { Hydrodynamic Diffraction (B4) Analysis Settings Gravity Structure Selection Wave Directions Wave Frequencies Solution (B5) Hydrostatic
Added Mass, Global X (Force/Moment vs Frequency) Added Mass, Global Z (Force/Moment vs Frequency) Added Inertia, Global RX (Force/Moment vs Frequency) Radiation Damping, Global X (Force/Moment vs Frequency) Radiation Damping, Global Z (Force/Moment vs Frequency) Radiation Damping, Global RX (Force/Moment vs Frequency) Units
TABLE 1
Model (B3)
Length Meter Mass Kilograms Rotational Velocity Degrees Force Newton Frequency Hertz Time Second Geometry TABLE 2 Model (B3) > Geometry
Object Name Geometry
State Fully Defined
Details of Geometry
Attached Assembly Name M:\My Documents\2530 CNA\platform coefficients (Aqwa)\CNA model 1_files\dp0\Geom\DM\Geom.agdb
Sea Geometry Water Level 0 m Water Depth 30 m Water Density 1025 kg/m³ Water Size X 1000 m Water Size Y 1000 m Import Preferences
Import Solid Bodies No
Import Surface Bodies Yes
Import Line Bodies Yes
CNA
TABLE 3 Model (B3) > Geometry > Part
Page 2 of 12 Project
2013-10-08 file:///C:/Users/BoileauR.IOTPC/AppData/Roaming/Ansys/v145/AQWA_Report/AQW...
OCRE-TR-2013-043 B Potential code method for Hydrodynamic inputs
TABLE 4
Model (B3) > Geometry > CNA > Axes
TABLE 5
Model (B3) > Geometry > CNA > Point Mass
TABLE 6
Model (B3) > Geometry > CNA > Body
Object Name CNA State Fully Defined
Details of CNA
Part Visibility Visible Suppressed Not Suppressed Total Structural Mass 153.130795434117 kg
X Position of COG 2.38403679020394E-08 m Y Position of COG -1.15647068810176E-07 m Z Position of COG -0.73 m Generate Internal Lid No Current Calculation Depth 0 m
Fixity Options
Structure Fixity Structure is Free to Move
Force Factors
Drag Factor 1 Mass Factor 1 Slam Factor 0
Advanced Options
Submerged Structure Detection Program Controlled Override Calculated GMX No Override Calculated GMY No
Non-Linear Roll Damping
Non-Linear Roll Damping Excluded from Calculations
Object Name CNA Axes State Fully Defined
Details of CNA Axes
Visibility Visible Alignment Method Global Axes Rotation About Global Z 0 °
Rotation About Local Y 0 ° Rotation About Local X 0 ° Unit Vector X [1, 0, 0] Unit Vector Y [0, 1, 0] Unit Vector Z [0, 0, 1]
Object Name Point Mass State Fully Defined
Details of Point Mass
Visibility Not Visible Suppressed Not Suppressed
X 2.38403679020394E-08 m Y -1.15647068810176E-07 m Z -0.73 m Mass definition Program Controlled
Mass 153.130795434117 kg Define inertia values by Direct input of Inertia
Kxx 0.36363905540238 m Kyy 0.36363905540238 m Kzz 0.315109823907887 m Ixx 20.249 kg.m² Ixy 0 kg.m² Ixz 0 kg.m² Iyy 20.249 kg.m² Iyz 0 kg.m² Izz 15.205 kg.m²
Object Name Topsides State Fully Defined
Details of Topsides
Body Visibility Visible
Page 3 of 12 Project
2013-10-08 file:///C:/Users/BoileauR.IOTPC/AppData/Roaming/Ansys/v145/AQWA_Report/AQW...
TABLE 7
Model (B3) > Geometry > CNA > Body
Suppressed Not Suppressed Structure Type Physical Geometry
Surface Type Program Controlled
Object Name Submerged State Fully Defined
Details of Submerged
Body Visibility Visible Suppressed Not Suppressed Structure Type Physical Geometry
Surface Type Program Controlled
Connections
TABLE 8 Model (B3) > Connections
TABLE 9
Model (B3) > Connections > Catenary Data
Object NameConnections State Fully Defined
Details of Connections
Object NameCatenary Data State Fully Defined
Details of Catenary Data
Mesh TABLE 10 Model (B3) > Mesh Hydrodynamic Diffraction (B4) TABLE 11 Model (B3) > Analysis TABLE 12
Model (B3) > Hydrodynamic Diffraction (B4) > Analysis Settings
Object Name Mesh State Meshed
Details of Mesh
Defeaturing Tolerance 0.002 m Max Element Size 0.04 m Max Allowed Frequency 2.55 Hz
Meshing Type Program Controlled
Generated Mesh Information
Number of Nodes 8868 Number of Elements 8930 Number of Nodes (Diffracting Bodies) 7699 Number of Elements (Diffracting Bodies) 7712
Object Name Hydrodynamic Diffraction (B4) State Solved
Details of Hydrodynamic Diffraction
Analysis Type Hydrodynamic Diffraction/Radiation
Object NameAnalysis Settings State Fully Defined
Details of Analysis Settings
Sea Grid Size Factor 2
Output File Options
Output Full QTF Matrix Yes Do Not Output .LIS Banner Page No No Wave Elevation at Field Points No Output Source Strengths No Output Potentials No
Page 4 of 12 Project
2013-10-08 file:///C:/Users/BoileauR.IOTPC/AppData/Roaming/Ansys/v145/AQWA_Report/AQW...
OCRE-TR-2013-043 B Potential code method for Hydrodynamic inputs
TABLE 13
Model (B3) > Hydrodynamic Diffraction (B4) > Gravity
TABLE 14
Model (B3) > Hydrodynamic Diffraction (B4) > Structure Selection
TABLE 15
Model (B3) > Hydrodynamic Diffraction (B4) > Wave Direction
TABLE 16
Model (B3) > Hydrodynamic Diffraction (B4) > Wave Frequency
Output Centroid Pressures No Output Element Properties No Output ASCII Hydrodynamic Database No Output Example of Hydrodynamic Database No
QTF Options
Calculate Full QTF Matrix Yes
Common Analysis Options
Ignore Modelling Rule Violations Yes No Drift Coefficients No No Pressure Post-Processing No Near Field Solution No Linearized Tube Drag No
Object Name Gravity State Fully Defined
Details of Gravity
Gravity, g 9.80665 m/s²
Object NameStructure Selection State Fully Defined
Details of Structure Selection
Structures to Exclude None
Group Of Structures
Interacting Structure Groups None
Structure Ordering
Structure 1 CNA
Object Name Wave Directions State Fully Defined
Details of Wave Directions
Type Range of Directions, No Forward Speed
Required Wave Input
Wave Range -180° to 180° (-PI to PI) Interval 180 ° Number of Intermediate Directions 1
Optional Wave Directions A
Additional Range Single Start Angle 45 °
Optional Wave Directions B
Additional Range None
Optional Wave Directions C
Additional Range None
Optional Wave Directions D
Additional Range None
Object NameWave Frequencies State Fully Defined
Details of Wave Frequencies Frequency / Period definition
Range Manual Definition Definition Type Range Lowest Frequency 0.063 Hz
Longest Period 16 s Highest Frequency 0.5 Hz
Shortest Period 2 s Interval Type Period Interval Period 2 s Number of Intermediate Values 6
Additional Frequencies A
Page 5 of 12 Project
2013-10-08 file:///C:/Users/BoileauR.IOTPC/AppData/Roaming/Ansys/v145/AQWA_Report/AQW...
Solution (B5)
TABLE 17
Model (B3) > Hydrodynamic Diffraction (B4) > Solution (B5) > Hydrostatic Results
Additional Range Single Lowest Frequency 2 Hz
Longest Period 0.5 s
Additional Frequencies B
Additional Range Single Lowest Frequency 0.182 Hz
Longest Period 5.5 s
Additional Frequencies C
Additional Range None
Additional Frequencies D
Additional Range None
Object Name Hydrostatic State Solved
Details of Hydrostatic
Structure CNA
Graphical Representation
Show Centre of Gravity Yes Show Centre of Buoyancy Yes Show Centre of Floatation Yes
Results
Actual Displaced Volume 0.1493959 m³ Metacentric Height GMX 0.3389662 m Out of Balance Force/Weight, Fz 2.0728e-5
Aqwa Hydrostatic Results
Structure CNA
Hydrostatic Stiffness
Centre of Gravity Position: X: 2.384e-8 m Y: -1.1565e-7 m Z: -0.73 m
Z RX RY
Heave(Z): 4437.8301 N/m -5.0587e-6 N/° -1.4073e-6 N/° Roll(RX): -2.8984e-4 N.m/m 8.8841715 N.m/° 1.3898e-7 N.m/° Pitch(RZ): -8.0633e-5 N.m/m 1.3898e-7 N.m/° 8.8841572 N.m/°
Hydrostatic Displacement Properties
Actual Volumetric Displacement: 0.1493959 m³ Equivalent Volumetric
Displacement: 0.1493959 m³
Centre of Buoyancy Position: X: 2.9295e-8 m Y: 3.1898e-7 m Z: -0.49486 m
Out of Balance Forces/Weight: FX: -9.0253e-8 FY: -3.325e-8 FZ: 2.0728e-5
Out of Balance Moments/Weight: MX: 2.4265e-7 m MY: 6.8369e-8 m MZ: 1.4793e-8 m
Cut Water Plane Properties
Cut Water Plane Area: 0.4414954 m²
Centre of Floatation: X: 4.2009e-8 m Y: -1.8096e-7 m Principal 2nd Moment of Area: X: 1.5511e-2 m^4 Y: 1.5511e-2 m^4 Angle Principal Axis makes with X
(FRA): 0. °
Small Angle Stability Parameters
C.O.G. to C.O.B.(BG): -0.23514 m
Metacentric Heights (GMX/GMY): 0.3389662 m 0.3389656 m COB to Metacentre (BMX/BMY): 0.1038261 m 0.1038256 m
Page 6 of 12 Project
2013-10-08 file:///C:/Users/BoileauR.IOTPC/AppData/Roaming/Ansys/v145/AQWA_Report/AQW...
OCRE-TR-2013-043 B Potential code method for Hydrodynamic inputs
TABLE 18
Model (B3) > Hydrodynamic Diffraction (B4) > Solution (B5) > Hydrodynamic Graph Results
FIGURE 1
Model (B3) > Hydrodynamic Diffraction (B4) > Solution (B5) > Added Mass, Global X (Force/Moment vs Frequency)
TABLE 19
Model (B3) > Hydrodynamic Diffraction (B4) > Solution (B5) > Added Mass, Global X (Force/Moment vs Frequency)
TABLE 20
Model (B3) > Hydrodynamic Diffraction (B4) > Solution (B5) > Hydrodynamic Graph Results
Restoring Moments/Degree
Rotations (MX/MY): 0.155058 N.m/° 0.1550578 N.m/°
Object NameAdded Mass, Global X (Force/Moment vs Frequency)
State Solved
Details of Added Mass, Global X (Force/Moment vs Frequency)
Presentation Method Line Axes Selection Force/Moment vs Frequency Frequency or Period Scale Frequency
Line A
Structure CNA
Type Added Mass
SubType Global X Component Global X Position of Min in X 2 Position of Max in X 0.5 Minimum Value 42.507 Maximum Value 63.607 Line B
Structure Not Defined...
Frequency (Hz) Line 1 0.063 57.808136 0.071 57.82975 0.083 57.863487 0.1 57.920486 0.125 58.029034 0.167 58.280231 0.182 58.396114 0.25 59.106441 0.5 63.607437 2 42.506611
Object NameAdded Mass, Global Z (Force/Moment vs Frequency)
Page 7 of 12 Project
2013-10-08 file:///C:/Users/BoileauR.IOTPC/AppData/Roaming/Ansys/v145/AQWA_Report/AQW...