arXiv:1412.0237v2 [hep-ex] 16 Mar 2015
EUROPEAN ORGANISATION FOR NUCLEAR RESEARCH (CERN)
CERN-PH-EP-2014-158
Submitted to: JHEPSearch for anomalous production of prompt same-sign lepton
pairs and pair-produced doubly charged Higgs bosons with
√s = 8 TeV pp
collisions using the ATLAS detector
The ATLAS Collaboration
Abstract
A low-background inclusive search for new physics in events with same-sign dileptons is pre-sented. The search uses proton–proton collisions corresponding to 20.3 fb−1of integrated luminosity taken in 2012 at a centre-of-mass energy of 8TeV with the ATLAS detector at the LHC. Pairs of iso-lated leptons with the same electric charge and large transverse momenta of the type e±e±, e±µ±,
andµ±µ±are selected and their invariant mass distribution is examined. No excess of events above
the expected level of Standard Model background is found. The results are used to set upper limits on the cross-sections for processes beyond the Standard Model. Limits are placed as a function of th e dilepton invariant mass within a fiducial region corresponding to the signal event selection criteria. Exclusion limits are also derived for a specific model of doubly charged Higgs boson production.
Prepared for submission to JHEP
Search for anomalous production of prompt same-sign
lepton pairs and pair-produced doubly charged Higgs
bosons with
√s = 8 TeV pp collisions using the
ATLAS detector
The ATLAS Collaboration
Abstract: A low-background inclusive search for new physics in events with same-sign dileptons is presented. The search uses proton–proton collisions corresponding to 20.3 fb−1 of integrated luminosity taken in 2012 at a centre-of-mass energy of 8 TeV with the ATLAS detector at the LHC. Pairs of isolated leptons with the same electric charge and large transverse momenta of the type e±e±, e±µ±, and µ±µ± are selected and their invariant mass distribution is examined. No excess of events above the expected level of Standard Model background is found. The results are used to set upper limits on the cross-sections for processes beyond the Standard Model. Limits are placed as a function of the dilepton invariant mass within a fiducial region corresponding to the signal event selection criteria. Exclusion limits are also derived for a specific model of doubly charged Higgs boson production.
Contents
1 Introduction 1
2 The ATLAS detector 2
3 Background and signal simulation 3
4 Physics object reconstruction 5
5 Data and event selection 7
6 Background estimation 7
6.1 Background from prompt same-sign lepton pairs 8
6.2 Background from opposite-sign lepton pairs 8
6.3 Background from non-prompt leptons 9
6.3.1 Measurement of f for muons 10
6.3.2 Measurement of f for electrons 10
6.4 Validation of background extraction methods 11
7 Systematic uncertainties 14
8 Results and interpretation 16
8.1 Signal region 16
8.2 Fiducial cross-section limits 18
8.3 Cross-section and mass limits for pair-produced doubly charged Higgs bosons 20
9 Conclusion 26
1 Introduction
In proton–proton (pp) collisions, Standard Model (SM) processes rarely produce two iso-lated leptons with large transverse momentum (pT) and the same electric charge (same-sign). However, such signatures frequently occur in models of physics beyond the SM. Supersymmetry [1], universal extra dimensions [2], left-right symmetric models [3–6], see-saw models [7–14], vector-like quarks [15–20], the Zee–Babu neutrino mass model [21–23], and the coloured Zee–Babu model [24] could all give rise to final states with two same-sign leptons.
An inclusive search in events with pairs of isolated same-sign leptons is presented in this paper. The dilepton pairs are selected in the pp collision data corresponding to 20.3 fb−1 of integrated luminosity taken in 2012 at a centre-of-mass energy of √s = 8 TeV
with the ATLAS detector [25] at the Large Hadron Collider (LHC). The same-sign dilepton pairs can be either two electrons (e±e±), two muons (µ±µ±), or one electron and one muon (e±µ±), and must have a transverse momentum (p
T) of at least 25 (20) GeV for the leading (subleading) lepton. After selection of these pairs the resulting invariant mass distributions are examined. The data are found to be consistent with the SM background predictions, and exclusion limits are set on the fiducial cross-section of new physics in the same-sign dilepton final state. Limits are also provided separately for two positively or negatively charged leptons as a function of the dilepton invariant mass. The analysis, using the 8 TeV dataset, provides significantly stronger constraints on new physics models than that presented in earlier ATLAS publications using 4.7 fb−1 of pp collision data recorded at √
s = 7 TeV [26, 27]. Exclusion limits are also presented for the mass of pair-produced doubly charged Higgs bosons (H±±) [27]. The CDF experiment has performed similar inclusive searches [28, 29] without observing any evidence for new physics. This search is more inclusive than other similar searches at ATLAS and CMS in events with same-sign dileptons with additional requirements on missing transverse energy, jets, and charged particles [30–36]. Recently, the ATLAS experiment published limits on doubly charged Higgs production in multi-lepton events [37] based on the √s = 8 TeV data.
2 The ATLAS detector
From the inside to the outside, the ATLAS detector comprises an inner tracking detector (ID), electromagnetic and hadronic calorimeters, and a muon spectrometer (MS). The ID is embedded in a 2 T axial magnetic field produced by a superconducting solenoid and provides precision tracking within the pseudorapidity1 range |η| < 2.5. It consists of a silicon pixel detector, a semiconductor tracker (SCT) using silicon microstrip detectors, and, in the region |η| < 2, a transition-radiation straw tube tracker (TRT).
The calorimeter system consists of electromagnetic and hadronic components and cov-ers the pseudorapidity range |η| < 4.9. The electromagnetic calorimeter is a lead/liquid-argon sampling calorimeter. It covers |η| < 3.2 with a fine lateral and longitudinal seg-mentation up to |η| = 2.5, and is subdivided into a barrel (|η| < 1.4) and two endcaps (1.5 < |η| < 3.2). The steel/scintillator–tile hadronic calorimeter provides coverage up to |η| = 1.7, while the hadronic calorimeter in the endcap (1.5 < |η| < 3.2) and in the forward region (3.1 < |η| < 4.9) uses liquid argon technology.
The muon spectrometer uses toroidal magnetic fields generated by three large super-conducting magnet systems with eight coils each. The detector is made up of separate trigger and high-precision tracking chambers. The precision chambers cover the region |η| < 2.7 with three layers of monitored drift tube chambers, complemented by cathode
1ATLAS uses a right-handed coordinate system with its origin at the nominal interaction point in the
centre of the detector and the z-axis along the beam line. The x-axis points from the interaction point to the centre of the LHC ring, and the y-axis points upwards. Cylindrical coordinates (r, φ) are used in the transverse plane, φ being the azimuthal angle around the beam line. The pseudorapidity is defined in terms of the polar angle θ as η = − ln tan(θ/2).
strip chambers in the forward region. The trigger system covers the range |η| < 2.4 using resistive plate chambers in the barrel and thin-gap chambers in the endcap regions.
A three-level trigger system is used to select events. The first level is implemented in custom electronics, and is followed by two software-based trigger levels. This system selects from the collision rate of around 20 MHz about 400 Hz of events to be recorded for physics analyses.
More details about the detector and the trigger system can be found elsewhere [25].
3 Background and signal simulation
Monte Carlo (MC) simulations are used to estimate the background contributions and also to model hypothetical signal events. The MC background samples used are shown in table 1. For each process the table provides information on the generator, the chosen parton distribution function (PDF) and the order of cross-section calculations used for the normalisation.
The irreducible background in the analysis comes mainly from the purely leptonic decays of W Z and ZZ production processes. A small contribution arises from W±W± production [38], which proceeds via the t-channel exchange of a gluon and results in at least two jets in the final state, in addition to the two W bosons. The small contributions from multiple parton interactions (MPI) for W W , W Z and ZZ are also considered. In these processes two hard scatterings occur in the same pp collision, each producing either a W or Z boson. Other smaller sources of background are the processes in which a W or Z boson is produced in association with a top-quark pair (t¯tW and t¯tZ). One of the reducible backgrounds arises from the opposite-sign lepton pairs where the charge for one of the leptons is wrongly reconstructed. In order to estimate the contribution, Drell–Yan (Z/γ∗+jets), t¯t, W±W∓ and W t simulations are used, and misidentification probabilities derived from data are applied to the MC samples (see section6.2). The process W γ, where the photon converts to an e+e− pair, is also simulated. The production of Zγ is included in the Z/γ∗ process.
The MC program sherpa-1.4.1 [39] is used to model the W Z, ZZ, W±W∓ and W γ processes. These samples use the default sherpa parameterisation for the renormalisation and factorisation scales. For processes with a Z boson, the contribution from γ∗ → ℓ+ℓ− due to internal or external bremsstrahlung of final-state quarks or leptons is simulated for m(ℓ+ℓ−) > 0.1 GeV. The t¯tW , t¯tZ and W±W± events are generated using MadGraph-5.1.4.8 [40, 41], and for the fragmentation and hadronisation, pythia-6.426 [42] is used for t¯tW and t¯tZ and pythia-8.165 [43] for W±W±. The MPI samples are generated by pythia-8.165. The Drell–Yan process is modelled using alpgen-2.14 [44], and the top-quark pair production and single top-quark production in association with a W boson are generated with mc@nlo-4.06 [45,46]. These are interfaced to herwig-6.520 [47,48] for the fragmentation and hadronisation process, and jimmy-4.31 [49] is used for the underlying-event description.
The CT10 [50] PDF set is used for W Z, ZZ, W±W∓, W γ, t¯t, and W t processes
produc-Process Generator PDF set Normalisation + fragmentation/ based on hadronisation W Z sherpa-1.4.1 [39] CT10 [50] NLO QCD with mcfm-6.2[51] ZZ sherpa-1.4.1 CT10 NLO QCD with mcfm-6.2 W±W± MadGraph-5.1.4.8 [40] CTEQ6L1 [52] LO QCD pythia-8.165 [43] t¯tV , MadGraph-5.1.4.8 CTEQ6L1 NLO QCD [53,54] V = W, Z + pythia-6.426 MPI V V pythia-8.165[43] CTEQ6L1 LO QCD V = W, Z
Z/γ∗+ jets alpgen-2.14 [44] CTEQ6L1 dynnlo-1.1 [55] with
+ herwig-6.520 [47,48] MSTW2008 NNLO [56] t¯t mc@nlo-4.06 [45,46] CT10 NNLO+NNLL + herwig-6.520 QCD [57–62] W t mc@nlo-4.06 CT10 NNLO+NNLL + herwig-6.520 QCD [63, 64] W±W∓ sherpa-1.4.1 CT10 NLO QCD with mcfm-6.2 W γ sherpa-1.4.1 CT10 NLO QCD with mcfm-6.3
Table 1: Generated samples used for background estimates. The generator, PDF set and order of cross-section calculations used for the normalisation are shown for each sample. The upper part of the table shows the MC samples used for the SM background coming from leptons with the same charge (MPI stands for multiple parton interactions), the lower part gives the background sources arising in the e±e± or e±µ± channel due to electron charge misidentification.
tion are calculated at leading order (LO) in QCD. For diboson samples (W Z, ZZ and W W ), the cross-sections are normalised to next-to-leading order (NLO) in QCD using mcfm-6.2 [51]. The QCD leading-order (NNLO) and next-to-next-to-leading-logarithm (NNLL) calculations are utilised for top-quark processes [53,54,57–64]. The Drell–Yan cross-section is also calculated at NNLO in QCD by dynnlo-1.1 with MSTW2008 NNLO [55,56].
Some typical same-sign dilepton signals of physics beyond the SM are simulated to evaluate the efficiency and acceptance of the event selection, which are needed to set the cross-section limits (see section 8.2). Pair production of doubly charged Higgs bosons via a virtual Z/γ∗ exchange is generated [65]. Right-handed W bosons (W
charged lepton and a right-handed neutrino (NR) are also used [66]. The production of a fourth-generation heavy b′b¯′ pair with the b′ quarks decaying into a W boson and either a top quark or an up-type quark is considered [67]. The above processes are generated using pythia-8.165. MadGraph is used to simulate the coloured Zee–Babu process, in which a diquark (SDQ) with charge ±2/3 or ±4/3 decays into two same-sign leptoquarks (SLQ): pp → SDQ → SLQSLQ → ℓℓqq [24]. For this process, pythia-8.165 is utilised for the fragmentation and hadronisation. For all signal samples mentioned above, the MSTW2008LO PDF set is used and cross-sections are calculated at LO in QCD.
The background and some of the signal samples are processed using the geant4-based [68] ATLAS detector simulation package [69]. Other signal samples are produced with a fast simulation [70] using a parameterisation of the calorimeter response. Additional inelastic pp interactions (referred to as ‘pile-up’), generated with pythia-6.426, are overlaid on the hard-scatter events to emulate the multiple pp interactions in the current and nearby bunch crossings. The distribution of the number of interactions per bunch crossing in the MC simulation is reweighted to that observed in the data. The simulated response is also corrected for differences in efficiencies, momentum scales, and momentum resolutions observed between data and simulation.
4 Physics object reconstruction
The analysis makes use of muons and electrons and the basic reconstruction and identifi-cation is explained in the following. In addition, the jet reconstruction is detailed as jets misidentified as electrons are a main source of background and as electrons and muons in the vicinity of a jet are not considered in this analysis.
Jets are reconstructed in |η| < 4.9 from topological clusters [71] formed from the energy deposits in the calorimeter, using the anti-kt algorithm [72] with a radius parameter of 0.4. Jets are calibrated [73] using an energy- and η-dependent simulation-based calibration scheme, with in-situ corrections based on data. The impact of multiple overlapping pp interactions is accounted for using a technique that provides an event-by-event and jet-by-jet pile-up correction [74]. To reduce the effect from pile-up, for jets with pT < 50 GeV, |η| < 2.4, the pT of all tracks inside the jet is summed and the fraction belonging to tracks from the primary vertex is required to be larger than 0.5. The primary vertex is defined as the interaction vertex which has the highest squared-pT sum of associated tracks with pT > 0.4 GeV found in the event. At least three charged-particle tracks must be associated with this vertex.
An electron is formed from a cluster of cells in the electromagnetic calorimeter asso-ciated with a track in the ID. The electron pT is obtained from the calorimeter energy measurement and the direction of the associated track. The electron must be within the range |η| < 2.47 and not in the transition region between the barrel and endcap calorime-ters (1.37 < |η| < 1.52). In addition, a “tight” [75] set of identification criteria need to be satisfied. One major source of background surviving these selections comes from jets misidentified as electrons. To suppress this background, in particular at low pT, the electrons are required to be isolated. The sum of the transverse energies in the
electro-magnetic and hadronic calorimeter cells around the electron direction in a cone of size ∆R =p(∆η)2+ (∆φ)2 = 0.2 is required to be less than 3 GeV + (pe
T− 20 GeV) × 0.037, where pe
T is the electron transverse momentum. The core of the electron energy depositions in the electromagnetic calorimeter is excluded and, before the cut, the sum is corrected for lateral shower leakage and pile-up from additional pp collisions. A further isolation cut is applied using the ID information. The sum of the pT of all tracks with pT > 0.4 GeV in a cone of size ∆R = 0.3 surrounding the electron track (the latter being excluded from the sum) is required to be less than 10% of the electron pT. The isolation selections were optimised using electron pairs with a mass compatible with the Z boson in the data, such that the application of both isolation criteria to electrons yields an efficiency that is pile-up independent and more than 99% for electrons with pT> 40 GeV. The efficiency slowly decreases with diminishing pT to around 92% at pT = 20 GeV. However, these isolation selections help to suppress the background from jets misidentified as electrons, which be-comes more prominent as pT decreases. To further suppress leptons from hadron decays, jets in a cone of size ∆R = 0.4 around the electron direction are examined. Since the jet reconstruction algorithm also reconstructs electrons as jets, any jet within ∆R = 0.2 of an electron is not considered to avoid double counting. The electron is rejected if there is a remaining jet in the cone with pT > 25 GeV + peT× 0.05, where peT is the electron pT. The non-constant cut value on the jet pT is placed to maintain a high efficiency for very high-pT electrons. The background arising in particular from electrons from heavy-flavour decays is reduced by requiring that the electron track is associated with the primary vertex. The transverse impact parameter significance is required to be |d0|/σ(d0) < 3, where d0 is the transverse impact parameter and σ(d0) is the uncertainty on the measured d0. The longitudinal impact parameter z0 must fulfil |z0× sin θ| < 1 mm.
Muons are reconstructed independently in both the ID and MS. Subsequently, these two tracks are combined based on a statistical combination of the two independent mea-surements using the parameters of the reconstructed tracks and their covariance matrices. The combined track is required to be within |η| < 2.5 and the track in the ID must have at least four hits in the SCT, at least one hit in the pixel detector and one hit in the first pixel layer if an active pixel sensor is traversed. The charge measured in the ID and the MS must match as this reduces the small effect of charge misidentification to a negligible level. To reduce background from heavy-flavour hadron decays, each muon is required to be isolated in the calorimeter and the ID. The calorimeter-based isolation is chosen to be P ET < 3.5 GeV + (pµT− 20 GeV) × 0.06 where the P ET is calculated in a cone of size ∆R = 0.3 and pµT is the muon transverse momentum. The ID-based isolation is defined as (P pT)/pµT < 0.07, where the sum runs over ID tracks with pT > 1 GeV in a cone of size ∆R = 0.3 surrounding the muon track, the latter being excluded from the sum. These isolation cuts result in an efficiency for muons from Z decays in data which is above 99% for muons with pµT > 40 GeV and decreases to around 90% at pµT= 20 GeV. As for electrons, with diminishing pT the background becomes more pronounced and these cuts result in a better background rejection. To further reduce the background a nearby jet veto is applied, similar to that for electrons: a muon is rejected if a jet with pT > 25 GeV + pµT× 0.05 is found in a cone of size ∆R = 0.4 around the muon. The muons are required to be associated
with the primary vertex by requiring |d0|/σ(d0) < 3, |d0| < 0.2 mm and |z0×sin θ| < 1 mm.
5 Data and event selection
This analysis uses the 2012 pp collision data collected at a centre-of-mass energy of 8 TeV with, on average, 21 interactions per bunch crossing. After requiring that all detector components are operational, the dataset amounts to 20.3 fb−1 of integrated luminosity.
The events are selected by electron and muon triggers. Events in the µ±µ± channel are selected by a dimuon trigger, which requires one muon with transverse momentum larger than 18 GeV and another muon with pT > 8 GeV. At the trigger level, muons are identified by requiring that the candidate muon tracks are reconstructed in both the MS and the ID. Dielectron events are recorded if the event contains two electrons with a pT larger than 12 GeV that satisfy the “loose” identification criteria. In the e±µ± channel events are selected by the trigger if both an electron and a muon (eµ) are found or if a high-pT electron is identified. For the eµ trigger the electron must have pT > 12 GeV satisfying the “medium” set of identification criteria, whereas the muon must have pT> 8 GeV. The high-pT electron trigger selects events containing electrons, which satisfy the “medium” identification criteria and have pT > 60 GeV. These triggers yield a sample of dilepton events with high efficiency over the whole pT range considered in this analysis.
The selected events must have a reconstructed primary vertex and contain lepton pairs with pT > 25 GeV for the leading lepton and pT > 20 GeV for the subleading one. These leptons must have the same electric charge, meet the above selection requirements, and have an invariant mass m(ℓℓ′) > 15 GeV. To reduce the background from leptons from Z boson decays, events in which an opposite-sign, same-flavour lepton pair is found to be consistent with the invariant mass of the Z boson (|mℓℓ− mZ| < 10 GeV) are rejected. In the e±e±channel, electron pairs in the mass range between 70 GeV and 110 GeV are vetoed as this region is used for the background estimates (see section 6.2). Any combination of two leptons with the same charge and with pT> 25 GeV and pT> 20 GeV respectively is included. This allows more than one lepton pair per event to be considered, which happens in fewer than 0.1% of the events.
6 Background estimation
The backgrounds in this search can be subdivided into prompt background, backgrounds from SM processes with two opposite-sign leptons where the charge of one of the leptons is misidentified and non-prompt background. Prompt leptons originate from a decay of a W boson, Z boson, and include any leptonic products of a prompt τ lepton decay. Non-prompt leptons are from decays of long-lived particles and mainly arise from semileptonic decays of heavy-flavour hadrons (containing b or c-quarks). Hadrons or overlapping hadrons within a jet which may be misidentified as an electron are also called non-prompt leptons in the following. The prompt background comes from SM processes producing two same-sign leptons from the primary vertex, and arises mainly from W Z, ZZ, W±W±, t¯tW , and t¯tZ production (see section 6.1). The method used to estimate the background from lepton
charge misidentification is described in section 6.2. Background from non-prompt leptons can arise from various sources and is discussed in section 6.3. For electrons, the main sources are jets misidentified as electrons and semileptonic decays of hadrons containing b-or c-quarks. Fb-or muons, the main contribution arises from semileptonic decays of heavy-flavour hadrons. Small contributions also come from pions and kaons that decay in flight and misidentified muons from hadronic showers in the calorimeter which reach the MS and are incorrectly matched to a reconstructed ID track.
6.1 Background from prompt same-sign lepton pairs
The background from SM processes in which prompt same-sign lepton pairs are produced is determined from MC simulations. Processes other than those listed in table 1 do not contribute significantly to this type of background and are neglected. In all of these samples, only reconstructed leptons are considered that are matched to a lepton at generator level from a decay of a W boson, a Z boson, and include any leptonic products of a prompt τ lepton decay. Leptons from any other sources are discarded to avoid double counting with the background from non-prompt leptons.
6.2 Background from opposite-sign lepton pairs
Monte Carlo samples are also used to simulate the contributions from processes in which opposite-sign lepton pairs are produced and one of the leptons has an incorrect charge as-signed. In principle, this charge misidentification can occur for muons as well as electrons. However, a study using muons from Z boson decays shows that this effect is negligible in this analysis. In the case of electrons, the dominant process that leads to charge misiden-tification is electrons emitting hard bremsstrahlung and subsequently producing electron– positron pairs by photon conversion, with one of these leptons having a high pT. Typically these conversions would be reconstructed as such, but in some asymmetric conversions only one of the tracks is reconstructed and the charge may be opposite to the charge of the original lepton that radiated the photon. The charge misidentification probability is measured using electrons from Z boson decays. This is done in a data-driven way using the same likelihood method as used in ref. [26]. The electrons are required to pass the same selection cuts as detailed in sections4 and5, and are selected by requiring same-sign elec-tron pairs with an invariant mass between 80 GeV and 100 GeV. This results in a very pure sample of electron pairs for which the charge of one of the electrons is incorrectly assigned. A comparison between data and MC events shows that the charge misidentification rate as a function of ET is well modelled in the simulation. Simulation is used to predict the backgrounds from Drell–Yan, t¯t, and W±W∓ production, correcting the event weights for events with a charge-misidentified electron by an |η|-dependent factor derived from these studies. The process V γ → ℓℓ′γ → ℓℓ′ee, V = W, Z can also give rise to same-sign lepton pairs when the photon converts. Since this background is closely related to the electron charge misidentification, the same correction factor is applied to the electrons from con-verted photons in the MC simulation. The contribution of conversions from Zγ events is implicitly accounted for in the simulation of the Z/γ process and is included in the charge misidentification category.
The uncertainty in the measurement of the charge misidentification rate is estimated by varying the invariant mass window and by loosening the isolation criteria. The total systematic error varies between 6% and 20% depending on the pseudorapidity. For tracks with very high pT, the charge can be incorrectly assigned due to the imperfect resolu-tion and alignment of the detector, since the curvature of the tracks is very small. An additional uncertainty of 20% is assigned to the misidentification rate for electrons with pT > 100 GeV, based on the following study. Since the charge misidentification rate is affected by the detector material description in the simulation, simulations with different material descriptions2 are compared with the nominal simulation. The largest variation is
found in the endcap region and this difference is taken as the overall uncertainty.
6.3 Background from non-prompt leptons
The background from non-prompt and misidentified leptons is determined in a data-driven way as a function of the lepton pT and |η|. For both the electrons and the muons (see sec-tions6.3.1and6.3.2) the following method is used to predict the contribution of non-prompt leptons in the signal region. A background region is defined that contains predominantly non-prompt leptons or jets that are kinematically similar to those in the signal region. A factor f is determined, which is the ratio of the number of leptons satisfying a given selection criterion (NP) to the number of leptons, which do not meet this requirement but satisfy a less stringent criterion (NF),
f = NP− N prompt P NF− NFprompt
. (6.1)
This ratio, which is determined as a function of pT and |η|, is corrected for the residual contribution of prompt leptons (NPprompt and NFprompt) using MC simulations. The factors f are calculated separately for the different pass and fail criteria that apply to the signal and validation regions discussed in sections 4and 6.4, respectively.
The total number of events with non-prompt leptons, NNP, in a given signal or vali-dation region is predicted to be
NNP = NPl+Fs X i fs(pTi, |ηi|) + NFl+Ps X i fl(pTi, |ηi|) − NFl+Fs X i fl(pTi, |ηi|) × fs(pTi, |ηi|). (6.2) The first term is the number of pairs NPl+Fs, where the leading lepton (denoted by l) fulfils
the selection requirements (Pl) and the subleading lepton (denoted by s) fails to satisfy its selection criteria (Fs). This is weighted per pair by the factor fs of the subleading lepton (the lepton which failed). Similarly for the second term, the leading lepton fails its selection (Fl) and the subleading lepton satisfies its respective selection criteria (Ps), hence the weight per pair is given by the factor fl for the leading lepton. The last term is included to avoid double counting and represents the case where both the leading and subleading leptons fail to satisfy their respective criteria, and so a weight for each lepton is
2
These simulations contain the following additional material: 5% in the whole of the ID, 20% for the
needed. The factors fland fsare taken to be the same in regions where both leptons fulfil the same selection requirement, as in the signal region and some of the validation regions.
6.3.1 Measurement of f for muons
In the case of muons the factor f is determined using a background region that contains mainly muons from semileptonic decays of b- and c-hadrons. This region is defined by taking advantage of the long lifetimes of b- and c-hadrons. Events are selected containing same-sign muon pairs that fulfil the same selection criteria as for the same-signal region (see section
4), but requiring that at least one of the leptons has |d0|/σ(d0) > 3 and |d0| < 10 mm. The same dimuon trigger as in the signal region is used here. The number of muons passing these impact parameter cuts is subdivided in two categories: NP, which are those muons passing the calorimeter and track-based isolation cuts, and NF, which contain those muons which fail the calorimeter-based isolation cut, the track-based isolation cut or both. The measured factor f is between 0.11 and 0.20 for muons with pT> 20 GeV.
Muons from b- and c-hadron decays tend to have large impact parameters, to be accom-panied by other tracks, and to be less isolated than prompt muons, which are associated with the primary vertex. Since the muon isolation can depend on the impact parameter, a correction needs to be applied to the factor f in the signal region. This correction is deter-mined using b¯b and c¯c MC simulations. In both the signal region and background region f is determined and the correction is then given by the ratio of these two quantities. As the correction factor is found to be independent of pT, the overall value of 1.3 is measured using same-sign muon pairs with pT > 20 GeV and mµµ > 15 GeV.
The two main sources of uncertainty in this procedure come from the uncertainty associated with the correction made to f before its use in the signal region, which comes primarily from the statistical error on the MC sample used in its derivation, and from the statistical uncertainties in the background data sample. Further sources of uncertainty arise from the prompt background subtraction and a possible difference between the signal and background region in the fraction of non-prompt muons from heavy-flavour decays and light particles, such as pions and kaons, which decay in flight. The total uncertainty on f is 17% at pT ≈ 20 GeV increasing to 23% for pT ≈ 60 GeV. A value of 100% is used for pT > 100 GeV due to a lack of statistics to determine f .
6.3.2 Measurement of f for electrons
To measure f for electrons a dijet data sample is selected which contains events with either a jet misidentified as an electron or a non-prompt electron from a semileptonic decay of b-and c-hadrons. The selected region consists of events that contain exactly one electron with pT > 20 GeV and a jet in the opposite azimuthal direction (∆φ(e, jet) > 2.4). The electron has to satisfy the “medium” identification criteria, the same impact parameter cuts as for the signal region and is rejected if, after removal of any jet within ∆R = 0.2 of the electron, there is a remaining jet within ∆R = 0.4. These events are selected by a set of prescaled single-electron triggers with different electron pT thresholds. To ensure that the electron and the jet are well balanced in terms of energy, a pT > 30 GeV requirement is applied to the jet. The different cut value from the electron case accounts for the differences in
the electron and jet energy scale calibrations and for energy depositions from other decay products in the isolation cone around the electron direction. Electron pairs from Z/γ∗ or t¯t events do not satisfy the above selection criteria. To suppress electrons from W boson decays, events are rejected if the transverse mass3 exceeds 40 GeV.
The number NPis calculated from events in this background region for which the elec-tron satisfies the same elecelec-tron selection criteria as applied in the signal region. The value of NFis based on electron candidates satisfying the signal selection criteria but passing less stringent electron identification cuts (“medium”) and failing to meet the calorimeter-based or track-based isolation requirements, or both. The numbers are corrected for the small remaining contribution from prompt electrons (see equation (6.1)). The measured factor f is 0.18 at pT = 20 GeV and increases to around 0.3 for pT ≈ 100 GeV. The main systematic uncertainty is due to the jet requirements in the event selection. This effect is estimated by varying the jet pT between 30 GeV and 50 GeV, which leads to an uncertainty rang-ing between 10% and 30% dependrang-ing on the electron pT. Other systematic uncertainties arise from a possible difference in the heavy-flavour fraction in the signal and background region, and the prompt background subtraction. The total uncertainty varies between ap-proximately 40% at pT ≈ 20 GeV and 13% for pT ≈ 100 GeV. Due to a lack of statistics to calculate f for electrons with pT > 100 GeV, the value of f for 60 < pT < 100 GeV electrons is used, and the uncertainty is increased to 100%.
6.4 Validation of background extraction methods
The background predictions from the various sources (prompt, non-prompt and charge misidentification) are validated using different methods, as discussed in the following and summarised in table2.
To test the predictions for the non-prompt background, validation regions (VR) that contain same-sign lepton pairs are defined. In these regions one or both of the leptons fail one of the signal selection cuts but pass a less stringent cut, which is called a “weaker” selection in the following. The dilepton invariant mass, the lepton pT and η distributions are compared between data and predictions.
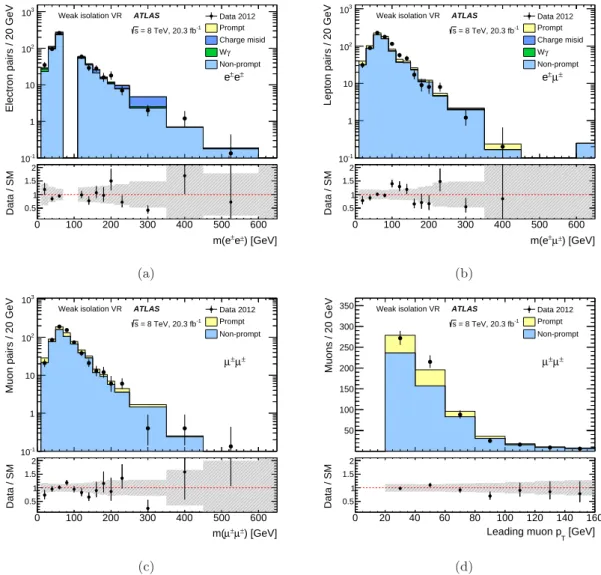
One of the validation regions selects a leading lepton that satisfies the signal selection criteria and a subleading lepton that passes the “weak” isolation cuts, which means the subleading lepton fails to meet the signal calorimeter or ID-based isolation requirement and instead passes isolation cuts that are loosened by 4 GeV (weak isolation on subleading lepton VR). For this region, the factor f for the subleading lepton is determined according to equation (6.1) using as pass criteria the “weak” isolation requirements and as fail criteria the loose isolation criteria applied in the “weak” selection. The invariant mass distributions for the three final states in this validation region are shown in figure 1 together with one example for the pT distribution. The predictions agree well with the data.
3
Transverse mass mT = p2 × EℓT× E
miss
T × (1 − cos ∆φ), where ∆φ is the azimuthal angle between
the directions of the electron and the missing transverse momentum (with magnitude Emiss
T ). The missing
transverse momentum is defined as the momentum imbalance in the plane transverse to the beam axis and
Validation method Primary background or validation criterion
Weak isolation VR’s Electron and muon non-prompt background
Fail-d0 VR’s Electron and muon non-prompt background
Medium VR Electron and muon non-prompt background
Low muon pT VR Muon non-prompt background
Opposite-sign VR Normalisation, efficiencies, lepton pT scale
and resolution
Prompt VR Prompt MC background predictions
Same-sign dielectron Z peak closure test Charge misidentification correction applied to opposite-sign MC background samples
Table 2: A summary of the validation methods used and an explanation of the type of background the methods are testing or which data-driven estimates they validate. These tests are carried out using validation regions (VR) or closure tests and are discussed in detail in the text.
In another validation region the “weak” isolation selection is applied to the leading lepton (weak isolation on leading lepton VR). In the µ±µ± and e±µ± channel one valida-tion region (fail-d0 VR) requires that one muon has an impact parameter significance of |d0|/σ(d0) > 3 and in order to increase the statistics the |d0| cut is loosened to 10 mm. In the e±e± final state one region (medium VR) contains same-sign electron pairs, in which one of the electrons fails the “tight” identification cuts but passes the looser “medium” se-lections instead. One region (low muon pTVR) used in the e±µ±channel selects same-sign electron–muon pairs, where both leptons satisfy the signal selection criteria but the muon has a transverse momentum between 18 GeV and 20 GeV.
To test the trigger and reconstruction efficiencies, as well as the lepton momentum scale and resolution, an opposite-sign validation region (opposite-sign VR) is defined. This region is populated with prompt lepton pairs that pass the same event selection as for the same-sign signal region, but the leptons have opposite charge. In order to cross-check the normalisation of the dominant W Z and ZZ MC predictions, a prompt validation region (prompt VR) is utilised. Events are selected in which at least three leptons are present. One pair must be from a sign lepton pair and another from an opposite-sign same-flavour lepton pair that has an invariant mass (mℓℓ) compatible with the Z boson mass (|mℓℓ− mZ| < 10 GeV). The data and predictions are compared for different cuts on the invariant mass of the same-sign lepton pair. To test the correction factor for the charge misidentification (see section 6.2), the factor f is applied to simulated Z decays into an electron pair where one electron is reconstructed with the wrong charge. A closure test is carried out in the region around the Z peak. This test shows that the shape of the background from charge misidentification is correctly reproduced.
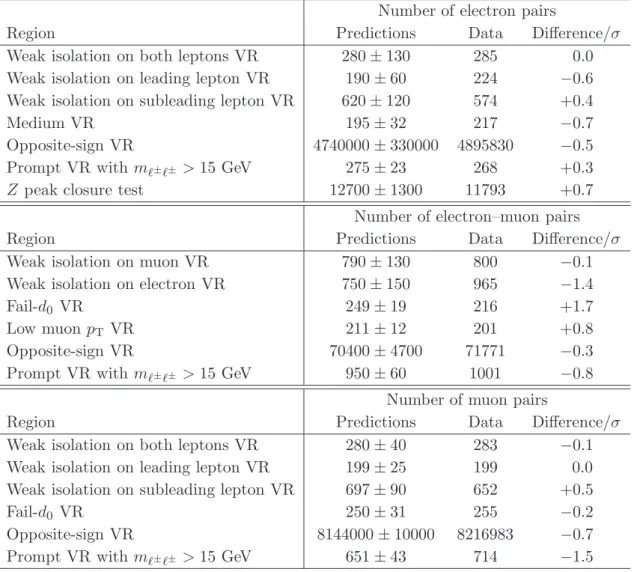
In all channels and validation regions the agreement between observation and predic-tion is good, as can be seen in table 3. The agreement between data and predictions is typically better than 1σ and at most 1.7σ.
Electron pairs / 20 GeV -1 10 1 10 2 10 3 10 Data 2012 Prompt Charge misid γ W Non-prompt ATLAS -1 = 8 TeV, 20.3 fb s ± e ± e Weak isolation VR ) [GeV] ± e ± m(e 0 100 200 300 400 500 600 Data / SM 0.5 1 1.5 2 (a)
Lepton pairs / 20 GeV
-1 10 1 10 2 10 3 10 Data 2012 Prompt Charge misid γ W Non-prompt ATLAS -1 = 8 TeV, 20.3 fb s ± µ ± e Weak isolation VR ) [GeV] ± µ ± m(e 0 100 200 300 400 500 600 Data / SM 0.5 1 1.5 2 (b)
Muon pairs / 20 GeV
-1 10 1 10 2 10 3 10 Data 2012 Prompt Non-prompt ATLAS -1 = 8 TeV, 20.3 fb s ± µ ± µ Weak isolation VR ) [GeV] ± µ ± µ m( 0 100 200 300 400 500 600 Data / SM 0.5 1 1.5 2 (c) Muons / 20 GeV 50 100 150 200 250 300 350 Data 2012 Prompt Non-prompt ATLAS -1 = 8 TeV, 20.3 fb s ± µ ± µ Weak isolation VR [GeV] T Leading muon p 0 20 40 60 80 100 120 140 160 Data / SM 0.5 1 1.5 2 (d)
Figure 1: Invariant mass distributions in one of the validation regions (VR) used in the (a) e±e± (b) e±µ± and (c) µ±µ± channels. The p
T distribution for the leading muon in the µ±µ± channel is shown in (d). In (a), (c) and (d) the leading lepton of the pair passes the signal isolation cuts while the subleading lepton passes the “weak” isolation cuts (weak isolation on subleading lepton VR). The mass range between 70 GeV and 110 GeV is not included in the e±e± channel as this region is used to estimate the background from charge misidentification. The electron passes the isolation cuts defined for the signal region while the muon passes the “weak” isolation cuts in (b) (weak isolation on muon VR). The data are compared to the background expectations and the lower panels show the ratio of data to the background prediction. The error bars on the data points show the statistical uncertainty and the dashed band shows the total uncertainties of the predictions. The last bin in the histograms includes overflows, and is normalised as though it is 50 GeV wide in (a) - (c) and 20 GeV wide in (d).
Number of electron pairs
Region Predictions Data Difference/σ
Weak isolation on both leptons VR 280 ± 130 285 0.0
Weak isolation on leading lepton VR 190 ± 60 224 −0.6
Weak isolation on subleading lepton VR 620 ± 120 574 +0.4
Medium VR 195 ± 32 217 −0.7
Opposite-sign VR 4740000 ± 330000 4895830 −0.5
Prompt VR with mℓ±ℓ± > 15 GeV 275 ± 23 268 +0.3
Z peak closure test 12700 ± 1300 11793 +0.7
Number of electron–muon pairs
Region Predictions Data Difference/σ
Weak isolation on muon VR 790 ± 130 800 −0.1
Weak isolation on electron VR 750 ± 150 965 −1.4
Fail-d0 VR 249 ± 19 216 +1.7
Low muon pT VR 211 ± 12 201 +0.8
Opposite-sign VR 70400 ± 4700 71771 −0.3
Prompt VR with mℓ±ℓ± > 15 GeV 950 ± 60 1001 −0.8
Number of muon pairs
Region Predictions Data Difference/σ
Weak isolation on both leptons VR 280 ± 40 283 −0.1
Weak isolation on leading lepton VR 199 ± 25 199 0.0
Weak isolation on subleading lepton VR 697 ± 90 652 +0.5
Fail-d0 VR 250 ± 31 255 −0.2
Opposite-sign VR 8144000 ± 10000 8216983 −0.7
Prompt VR with mℓ±ℓ± > 15 GeV 651 ± 43 714 −1.5
Table 3: Expected and observed numbers of lepton pairs for the different validation re-gions, explained in detail in the text. The uncertainties on the predictions include the statistical and systematic uncertainties. The column ’Difference/σ’ is calculated by di-viding the difference between the predictions and the data by the uncertainty (σ) of the prediction.
7 Systematic uncertainties
The systematic uncertainties considered in this analysis are summarised in table 4. Ex-perimental systematic uncertainties arise from the trigger selection and the lepton recon-struction and identification. These include the effects of the energy scale and resolution uncertainties. Also shown is the overall uncertainty in the e±e± and e±µ± channels from electron charge misidentification (discussed in section6.2) and the non-prompt background estimation (presented in section 6.3).
The uncertainty on the integrated luminosity is 2.8%. It is derived following the same methodology as that detailed in ref. [77]. Another systematic uncertainty is due to the
Source Process Uncertainty
e±e± e±µ± µ±µ±
Trigger Signal and background 2.1-2.6% 2.1-2.6% 2.1–2.6%
from MC simulations Electron reconstruction Signal, prompt
1.9–2.7% 1.4%
and identification background
Muon reconstruction Signal, prompt
0.28% 0.6%
and identification background
Electron charge Opposite-sign
9% 1.2%
misidentification backgrounds
Determination of Non-prompt
22% 24% 17%
factor f for e/µ backgrounds
Luminosity Signal and background 2.8% 2.8% 2.8%
from MC simulations
MC statistics Backgrounds from 5% 1.6% 1.3%
MC simulations Photon misidentification
W γ 13% 11%
as electron
MC cross-sections Prompt, opposite- 4% 2.5% 4%
sign backgrounds
Table 4: Sources of systematic uncertainty (in %) on the signal yield and the expected background predictions, described in the second column, for the mass range mℓℓ> 15 GeV.
limited number of events available in the MC samples and also the data control samples used for the background predictions. The overall effect from the MC samples used per channel is shown in table4. Systematic uncertainties on different physics processes from the same source are assumed to be 100% correlated. An example is the charge misidentification rate uncertainty for the Z/γ∗, t¯t, W W and W γ samples.
Theoretical uncertainties on the production cross-section arise from the choice of renor-malisation and factorisation scales in the fixed-order calculations as well as the uncertainties on the PDF sets and the value of the strong coupling constant αs used in the perturbative expansion. The uncertainties due to the renormalisation and factorisation scales are found by varying the scales by a factor of two relative to their nominal values. The PDF and αs uncertainties are determined using different PDF sets and PDF error sets following the recommendations documented in ref. [78]. The uncertainties on the MC modelling of back-ground processes are estimated by testing different generators as well as parton shower and hadronisation models. The resulting total cross-section uncertainties are 7% for W Z [79], 5% for ZZ [79], and 22% for t¯tV [54,80]. The uncertainties on W±W± cross-sections and diboson production in MPI processes are taken to be 50% and 100% respectively, but their contributions to the final results are small.
8 Results and interpretation
8.1 Signal region
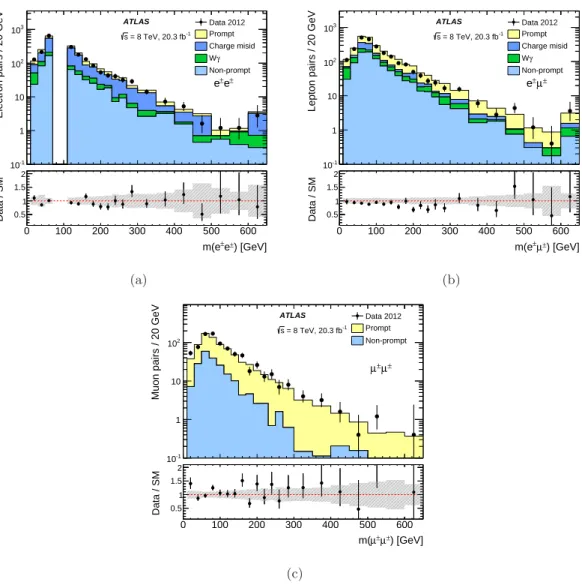
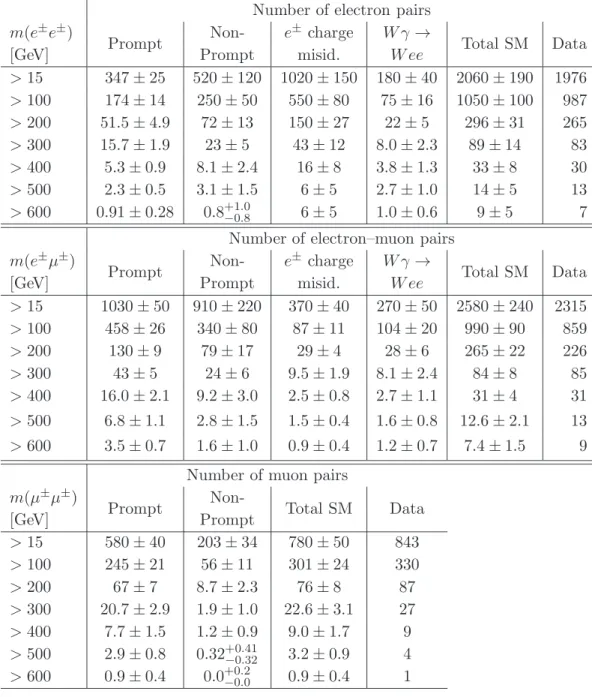
The invariant mass distributions for the data and the expected SM background are shown in figure2, separately for the e±e±, e±µ± and µ±µ±final states. In general, good agreement is seen in both the total normalisation and shapes for all channels within the uncertainties. The last bin in the figures contains the overflow bin. There is no event in the overflow in the µ±µ± channel, while the mass distribution extends up to around 1300 (1100) GeV in the e±e±(e±µ±) channel. The expected and observed numbers of events for several cuts on the dilepton mass for each final state are given in table 5, which also shows the contributions from the different background types. In the e±e±channel the dominant background contri-bution comes from charge misidentification of electrons from the Drell–Yan process. In the e±µ± and µ±µ± channel the prompt production dominates the background. The prompt background predominantly arises from W Z boson production, which amounts to around 70% of the prompt background. This fraction slightly decreases for high-mass dilepton pairs. Other contributions are from ZZ and W±W± production and a very small fraction comes from the t¯tW and t¯tZ production or from diboson production in MPI processes. For dilepton masses mℓℓ> 500 GeV, the contribution from W±W±and ZZ to the prompt background becomes more pronounced with W±W± being the largest contribution to the prompt background for mℓℓ > 600 GeV in the µ±µ± channel.
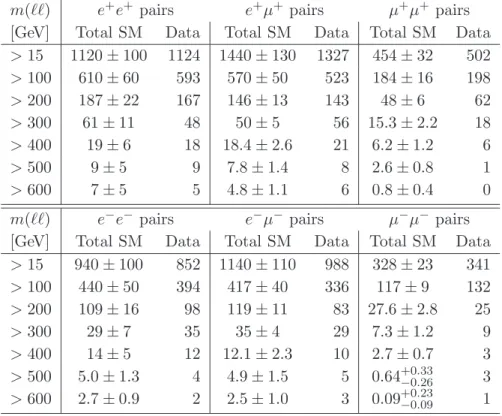
Table6shows a similar comparison of the data with the SM expectation separately for ℓ+ℓ+ and ℓ−ℓ− pairs. Due to the contribution of the valence quarks in the proton, more W+than W− bosons are produced in pp collisions resulting in a higher background for the ℓ+ℓ+ final state. For all final states no significant excesses or deficits are observed between the data and the SM background predictions.
Based on the above findings, upper limits are computed at the 95% confidence level (CL) using the CLS [81] prescription. Limits are given on the number of same-sign lepton pairs (N95) contributed by new physics beyond the SM for various invariant mass thresh-olds. In this procedure the number of pairs in each mass bin is described using a Poisson probability density function. The systematic uncertainties (as discussed in section 7) are incorporated into the limit calculation as nuisance parameters with Gaussian priors with the correlations between uncertainties taken into account. The limits can be translated into an upper limit on the fiducial cross-section using: σ95fid= N95/(ǫfid×R Ldt), where ǫfid is the efficiency for finding a lepton pair from a possible signal from new physics in the fiducial region at particle level, andR Ldt is the integrated luminosity. The efficiency ǫfid is discussed in detail in the next section.
The fiducial volume at particle level, as summarised in table 7, is chosen to be very similar to the one used in the object and event selections (see sections4and5). The leptons must be isolated and fulfil the same kinematic requirements on transverse momentum and pseudorapidity as imposed at reconstruction level. Lepton isolation is implemented by requiring that the sum of the pT of the stable charged particles with pT > 1 (0.4) GeV in a cone of size ∆R = 0.3 around the lepton is required to be less than 7% (10%) of the lepton pT for muons (electrons). In addition, the two leptons must have the same
Electron pairs / 20 GeV -1 10 1 10 2 10 3 10 Data 2012 Prompt Charge misid γ W Non-prompt ATLAS -1 = 8 TeV, 20.3 fb s ± e ± e ) [GeV] ± e ± m(e 0 100 200 300 400 500 600 Data / SM 0.5 1 1.5 2 (a)
Lepton pairs / 20 GeV
-1 10 1 10 2 10 3 10 Data 2012Prompt Charge misid γ W Non-prompt ATLAS -1 = 8 TeV, 20.3 fb s ± µ ± e ) [GeV] ± µ ± m(e 0 100 200 300 400 500 600 Data / SM 0.5 1 1.5 2 (b)
Muon pairs / 20 GeV
-1 10 1 10 2 10 Data 2012 Prompt Non-prompt ATLAS -1 = 8 TeV, 20.3 fb s ± µ ± µ ) [GeV] ± µ ± µ m( 0 100 200 300 400 500 600 Data / SM 0.5 1 1.5 2 (c)
Figure 2: Invariant mass distribution of (a) e±e± (b) e±µ± and (c) µ±µ± pairs as a function of a threshold on the dilepton mass in the same-sign signal region. The mass range between 70 GeV and 110 GeV is not included in the e±e± channel as this region is used to estimate the background from charge misidentification. The data are compared to the SM expectations and the lower panels show the ratio of data to the background prediction. The error bars on the data points show the statistical uncertainty and the dashed band shows the total uncertainties of the predictions. The last bin in the histograms includes overflows, and is normalised as though it is 50 GeV wide.
charge and pass the same invariant mass cut, mℓℓ > 15 GeV, as required at reconstruction level. In addition, in the e±e± channel the mass range 70 < m
ℓℓ < 110 GeV is vetoed. Finally, events are rejected in which an opposite-sign, same-flavour lepton pair is found with |mℓℓ− mZ| < 10 GeV.
Number of electron pairs m(e±e±)
Prompt Non- e
± charge W γ →
Total SM Data
[GeV] Prompt misid. W ee
> 15 347 ± 25 520 ± 120 1020 ± 150 180 ± 40 2060 ± 190 1976 > 100 174 ± 14 250 ± 50 550 ± 80 75 ± 16 1050 ± 100 987 > 200 51.5 ± 4.9 72 ± 13 150 ± 27 22 ± 5 296 ± 31 265 > 300 15.7 ± 1.9 23 ± 5 43 ± 12 8.0 ± 2.3 89 ± 14 83 > 400 5.3 ± 0.9 8.1 ± 2.4 16 ± 8 3.8 ± 1.3 33 ± 8 30 > 500 2.3 ± 0.5 3.1 ± 1.5 6 ± 5 2.7 ± 1.0 14 ± 5 13 > 600 0.91 ± 0.28 0.8+1.0−0.8 6 ± 5 1.0 ± 0.6 9 ± 5 7
Number of electron–muon pairs m(e±µ±)
Prompt Non- e
± charge W γ →
Total SM Data
[GeV] Prompt misid. W ee
> 15 1030 ± 50 910 ± 220 370 ± 40 270 ± 50 2580 ± 240 2315 > 100 458 ± 26 340 ± 80 87 ± 11 104 ± 20 990 ± 90 859 > 200 130 ± 9 79 ± 17 29 ± 4 28 ± 6 265 ± 22 226 > 300 43 ± 5 24 ± 6 9.5 ± 1.9 8.1 ± 2.4 84 ± 8 85 > 400 16.0 ± 2.1 9.2 ± 3.0 2.5 ± 0.8 2.7 ± 1.1 31 ± 4 31 > 500 6.8 ± 1.1 2.8 ± 1.5 1.5 ± 0.4 1.6 ± 0.8 12.6 ± 2.1 13 > 600 3.5 ± 0.7 1.6 ± 1.0 0.9 ± 0.4 1.2 ± 0.7 7.4 ± 1.5 9
Number of muon pairs m(µ±µ±)
Prompt Non- Total SM Data
[GeV] Prompt > 15 580 ± 40 203 ± 34 780 ± 50 843 > 100 245 ± 21 56 ± 11 301 ± 24 330 > 200 67 ± 7 8.7 ± 2.3 76 ± 8 87 > 300 20.7 ± 2.9 1.9 ± 1.0 22.6 ± 3.1 27 > 400 7.7 ± 1.5 1.2 ± 0.9 9.0 ± 1.7 9 > 500 2.9 ± 0.8 0.32+0.41−0.32 3.2 ± 0.9 4 > 600 0.9 ± 0.4 0.0+0.2−0.0 0.9 ± 0.4 1
Table 5: Expected and observed numbers of isolated same-sign lepton pairs in the e±e±, e±µ± and µ±µ± channel for various cuts on the dilepton invariant mass, m(ℓ±ℓ±). The uncertainties shown are the systematic uncertainties.
8.2 Fiducial cross-section limits
To derive upper limits on the cross-section due to physics beyond the SM, the fiducial efficiency, ǫfid, is calculated. The quantity ǫfid is the ratio, for leptons from the signal processes, of the number of selected lepton pairs to the number of true same-sign lepton pairs satisfying the fiducial selection at particle level. The value of ǫfidgenerally depends on the new physics process, e.g. the number of leptons in the final state passing the kinematic
m(ℓℓ) e+e+ pairs e+µ+ pairs µ+µ+ pairs
[GeV] Total SM Data Total SM Data Total SM Data
> 15 1120 ± 100 1124 1440 ± 130 1327 454 ± 32 502 > 100 610 ± 60 593 570 ± 50 523 184 ± 16 198 > 200 187 ± 22 167 146 ± 13 143 48 ± 6 62 > 300 61 ± 11 48 50 ± 5 56 15.3 ± 2.2 18 > 400 19 ± 6 18 18.4 ± 2.6 21 6.2 ± 1.2 6 > 500 9 ± 5 9 7.8 ± 1.4 8 2.6 ± 0.8 1 > 600 7 ± 5 5 4.8 ± 1.1 6 0.8 ± 0.4 0
m(ℓℓ) e−e− pairs e−µ− pairs µ−µ− pairs
[GeV] Total SM Data Total SM Data Total SM Data
> 15 940 ± 100 852 1140 ± 110 988 328 ± 23 341 > 100 440 ± 50 394 417 ± 40 336 117 ± 9 132 > 200 109 ± 16 98 119 ± 11 83 27.6 ± 2.8 25 > 300 29 ± 7 35 35 ± 4 29 7.3 ± 1.2 9 > 400 14 ± 5 12 12.1 ± 2.3 10 2.7 ± 0.7 3 > 500 5.0 ± 1.3 4 4.9 ± 1.5 5 0.64+0.33−0.26 3 > 600 2.7 ± 0.9 2 2.5 ± 1.0 3 0.09+0.23−0.09 1
Table 6: Expected and observed numbers of positively or negatively charged lepton pairs for various cuts on the dilepton invariant mass, m(ℓℓ). The uncertainties shown are the systematic uncertainties.
Selection Electron requirement Muon requirement
Leading lepton pT pT > 25 GeV pT> 25 GeV
Subleading lepton pT pT > 20 GeV pT> 20 GeV
Lepton η |η| < 1.37 or 1.52 < |η| < 2.47 |η| < 2.5
Isolation P pT(∆R = 0.3)/peT< 0.1 P pT(∆R = 0.3)/pµT < 0.07
Selection Event selection
Lepton pair Same-sign pair with mℓℓ > 15 GeV
Electron pair Veto pairs with 70 < mℓℓ< 110 GeV
Event No opposite-sign same-flavour pair with |mℓℓ− mZ| < 10 GeV
Table 7: Summary of requirements on generated leptons and lepton pairs in the fiducial region at particle level. More information on the calculation of the isolation pT is given in the text.
selection criteria or the number of jets that may affect the lepton isolation. To minimise this dependence, the definition of the fiducial region is closely related to the analysis selection. The limits are quoted using the lowest fiducial efficiency obtained for the following beyond-the-SM processes.
Firstly, production of doubly charged Higgs boson pairs with masses ranging between 100 GeV and 1 TeV is considered. Another process is production of a diquark (SDQ) with charge ±2/3 or ±4/3 in the Zee–Babu model, which decays into two same-sign leptoquarks (SLQ), decaying subsequently into a same-sign lepton pair. This model is considered for diquark masses between 2.5 TeV and 3.5 TeV and leptoquark masses between 1 TeV and 1.4 TeV. The third process is a production of a right-handed WR boson decaying into a lepton and a Majorana neutrino NR, with NR subsequently decaying into a lepton and two jets, for WR masses between 1 TeV and 2 TeV, and NR masses between 250 GeV and 1.5 TeV. The last process is pair production of b′ chiral quarks, decaying either exclusively into W t or decaying into W q, q being an up-type quark, with a 33% branching ratio in each quark channel, for b′ masses between 400 GeV and 1 TeV.
The fiducial efficiencies vary between 46% and 74% with similar values for the e±e±, e±µ± and µ±µ± final states. The lowest values of ǫ
fid are found in the case of the fourth-generation down-type chiral quark model, and the highest for the production of WR bosons and NR neutrinos. The primary reason for this dependence is that the electron identifica-tion efficiency varies by about 15% over the relevant pT range [75]. For muons differences in the efficiencies arise due to the detector acceptances [82], which are populated differently depending on the kinematics of the leptons produced in the new physics process. Further differences of the order of 1% arise since the calorimeter-based isolation criterion is not emulated because the isolation energy has a poor resolution in the calorimeter. The fidu-cial efficiencies are also derived separately for ℓ+ℓ+and ℓ−ℓ− pairs and found to be charge independent.
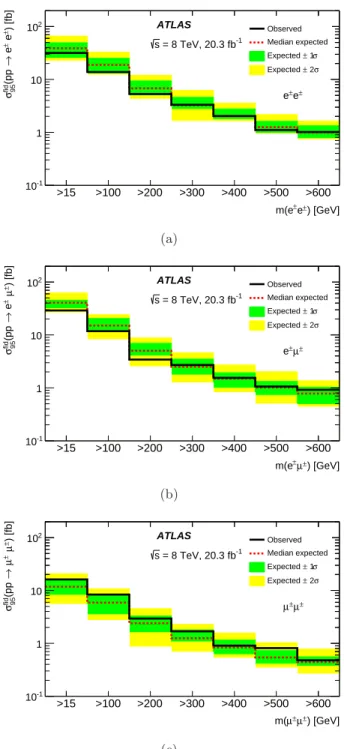
In the following, cross-section limits are presented for the case which yields the lowest fiducial efficiency, that is 48%, 50% and 46% in the e±e±, e±µ±and µ±µ±channel respec-tively. The 95% CL upper limits on the fiducial cross-section are shown in figure3 and in table 8separately for each final state. The cross-section limits are statistical combinations of the ℓ+ℓ+ and ℓ−ℓ−limits and observed limits vary between 0.48 fb and 32 fb depending on the mass cut and the final state for the inclusive analysis. The limits obtained for ℓ+ℓ+ and ℓ−ℓ− pairs are also shown in table 8 and range between 0.32 fb to 28 fb. Since the total limits are the limits on the sum of ℓ+ℓ+ and ℓ−ℓ−, they are, in general, larger than charge separated limits. For all final states the observed limits are generally within 1σ of the expected limits, which are obtained using simulated pseudo-experiments using only SM processes.
8.3 Cross-section and mass limits for pair-produced doubly charged Higgs
bosons
As an example of the models producing same-sign lepton pairs, mass limits are obtained for doubly charged Higgs bosons, which are pair produced via s-channel Z boson or photon exchange in the framework of the left-right symmetric models [3–6]. In this framework, left-handed states, H±±
L , and right-handed states HR±± are predicted. These Higgs bosons have identical kinematic properties, but their production rate differs due to the different couplings to Z bosons [7]. The cross-section, which is known at NLO, is around 2.5 times higher for HL++H−−
) [GeV] ± e ± m(e >15 >100 >200 >300 >400 >500 >600 ) [fb] ± e ± e → (pp 95 fid σ -1 10 1 10 2 10 Observed Median expected σ 1 ± Expected σ 2 ± Expected ATLAS -1 = 8 TeV, 20.3 fb s ± e ± e (a) ) [GeV] ± µ ± m(e >15 >100 >200 >300 >400 >500 >600 ) [fb] ±µ ± e → (pp 95 fidσ -1 10 1 10 2 10 Observed Median expected σ 1 ± Expected σ 2 ± Expected ATLAS -1 = 8 TeV, 20.3 fb s ± µ ± e (b) ) [GeV] ± µ ± µ m( >15 >100 >200 >300 >400 >500 >600 ) [fb] ±µ ±µ → (pp 95 fid σ -1 10 1 10 2 10 Observed Median expected σ 1 ± Expected σ 2 ± Expected ATLAS -1 = 8 TeV, 20.3 fb s ± µ ± µ (c)
Figure 3: Fiducial cross-section limits at 95% CL for (a) e±e±, (b) e±µ± and (c) µ±µ± pairs, as a function of the lower bound on the lepton pair mass. The green and yellow bands show the 1σ and 2σ bands on the expected limits. The mass range between 70 GeV and 110 GeV is not included in the e±e± channel as this region is used to estimate the background from charge misidentification.
95% CL upper limit [fb]
e±e± e±µ± µ±µ±
Mass range Expected Observed Expected Observed Expected Observed
> 15 GeV 39+10−13 32 41+5−8 29 12+4−3 16 > 100 GeV 19+6−6 14 15.1+5.5−2.6 11.8 5.9+2.2−2.3 8.4 > 200 GeV 6.8+2.6−1.7 5.3 5.0+1.9−0.9 3.4 2.4+0.9−0.8 2.9 > 300 GeV 3.3+1.3−0.4 3.3 2.5+1.0−0.7 2.7 1.25+0.55−0.15 1.69 > 400 GeV 2.02+0.74−0.21 2.03 1.5+0.4−0.5 1.6 0.83+0.32−0.20 0.91 > 500 GeV 1.25+0.36−0.26 1.10 1.02+0.30−0.27 1.06 0.54+0.19−0.12 0.82 > 600 GeV 0.99+0.34−0.20 1.02 0.78+0.24−0.28 0.92 0.44+0.11−0.06 0.48 e+e+ e+µ+ µ+µ+
Mass range Expected Observed Expected Observed Expected Observed
> 15 GeV 27+11−6 28 25+10−4 23 9.5+3.3−3.1 14 > 100 GeV 14.3+5.4−2.8 13.5 11+4−2.1 9 5.0+1.6−1.3 6.3 > 200 GeV 5.4+2.0−1.4 4.6 3.6+1.3−0.7 3.6 2.2+0.8−0.5 3.6 > 300 GeV 2.5+0.9−0.6 2.0 1.9+0.8−0.5 2.6 1.11+0.46−0.29 1.42 > 400 GeV 1.59+0.47−0.34 1.64 1.10+0.46−0.23 1.39 0.74+0.27−0.17 0.74 > 500 GeV 1.44+0.34−0.36 1.55 0.79+0.21−0.22 0.89 0.42+0.24−0.10 0.38 > 600 GeV 1.27+0.37−0.26 1.10 0.65+0.14−0.16 0.77 0.37+0.09−0.05 0.32 e−e− e−µ− µ−µ−
Mass range Expected Observed Expected Observed Expected Observed
> 15 GeV 23+8−5 19 19.0+8.0−2.8 16.0 6.8+2.7−1.5 8.3 > 100 GeV 10.8+4.4−2.4 9.0 8.2+2.2−2.1 5.6 3.5+1.4−0.9 5.1 > 200 GeV 3.9+1.4−1.2 3.5 2.8+1.2−0.9 1.5 1.41+0.54−0.33 1.29 > 300 GeV 2.1+0.7−0.5 2.6 1.6+0.6−0.4 1.3 0.79+0.30−0.16 1.0 > 400 GeV 1.56+0.41−0.31 1.35 0.91+0.34−0.26 0.77 0.52+0.20−0.13 0.59 > 500 GeV 0.69+0.27−0.17 0.64 0.62+0.12−0.12 0.65 0.355+0.139−0.013 0.683 > 600 GeV 0.58+0.21−0.08 0.61 0.49+0.16−0.10 0.59 0.332+0.014−0.011 0.454
Table 8: Upper limit at 95% CL on the fiducial cross-section for ℓ±ℓ± pairs from non-SM signals. The expected limits and their 1σ uncertainties are given together with the observed limits derived from the data. Limits are given separately for the e±e±, e±µ± and µ±µ± channel inclusively and separated by charge.
of the two H±± bosons into leptons (H±±H∓∓ → ℓ±
1ℓ±2ℓ∓3ℓ∓4) is considered. This is done using the same search strategy as for the fiducial cross-section limits, which looks for signs of new physics in events containing same-sign lepton pairs. Alternatively this search could be carried out looking for events with two same-sign lepton pairs (four-lepton final states). However, the four-lepton channel has a low efficiency due to the cases where at least one of the leptons falls outside the acceptance.
In the following, H±±boson mass values in the range 50 GeV to 1 TeV are considered. The cross-section is determined using σHH× BR = NHrec/(2 × A × ǫ ×R Ldt), where BR is the branching ratio of the decay into a lepton pair (H±±→ ℓ±ℓ′±), Nrec
H is the number of reconstructed Higgs boson candidates, A × ǫ is the acceptance times efficiency to find a lepton pair from the H±± decay, and the factor of two accounts for the two same-sign lepton pairs from the H++ and H−− bosons. The A × ǫ is calculated for the simulated mass points and masses in between are interpolated via an empirical fit function. In the mass range considered in this analysis, the width of the H±± resonance is much smaller than the detector resolution of the lepton pairs. To extract the cross-section limits of H±± bosons the size of the mass bins used is optimised for each final state, such that in each mass bin the Higgs selection efficiency is very similar. Limits on the cross-section for pair production of H±± and H∓∓ bosons times the branching ratio in each of the three final states are extracted using the CLS technique.
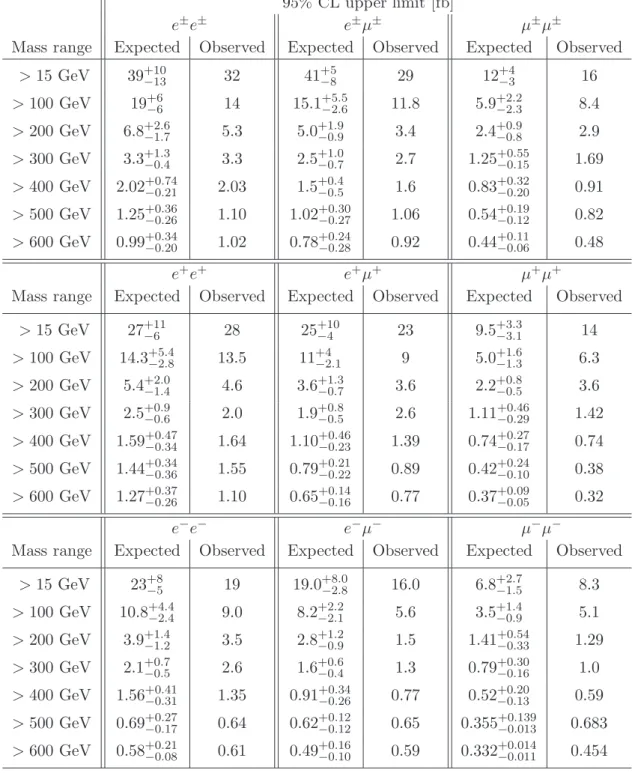
The results at 95% CL are shown in figure4. The scatter between adjacent mass bins in the observed limits is due to fluctuations in the background yields derived from limited statistics. In general, good agreement is seen between observed and expected limits with maximum deviations of 2σ. In the three final states, the cross-section limits vary between 11 fb for a H±±mass of 50 GeV to around 0.3 fb for a H±±mass of 600 GeV. The expected cross-section curves for the pair production of HL and HR are also shown in figure4. The
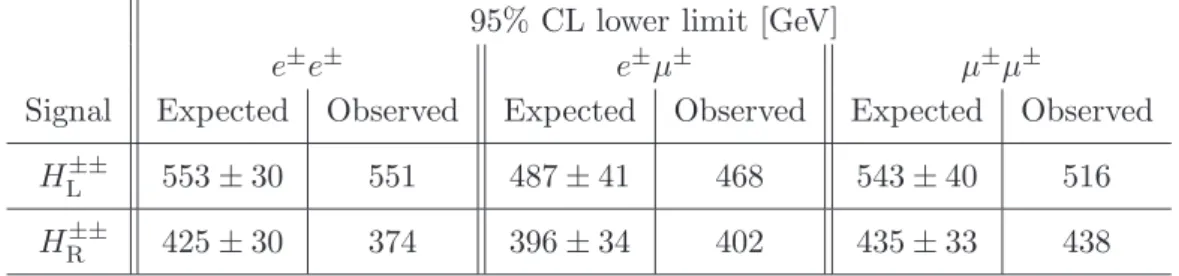
95% CL lower limit [GeV]
e±e± e±µ± µ±µ±
Signal Expected Observed Expected Observed Expected Observed
HL±± 553 ± 30 551 487 ± 41 468 543 ± 40 516
HR±± 425 ± 30 374 396 ± 34 402 435 ± 33 438
Table 9: Lower limits at 95% CL on the mass of HL±±and HR±±bosons, assuming a 100% branching ratio to e±e±, e±µ± and µ±µ± pairs. The 1σ variations are also shown for the expected limits.
lower mass limits are given by the crossing point of the cross-section limit curve and the expected curve, and are summarised in table 9. The 1σ errors on the expected limits are symmetrised to reduce the effect from bin by bin statistical fluctuations. For this scenario the best limits are obtained for HL±± in the e±e± channel with a limit around 550 GeV and for HR±± in the µ±µ± channel with a limit around 430 GeV. The limits are 10–20% worse in the e±µ± channel due to the larger background at high invariant masses from
) [GeV] ± ± m(H 100 200 300 400 500 600 ) [fb] ± e ± e → ±± BR(H × ) −− H ++ H → (pp σ 10-1 1 10 2 10 Observed 95% CL Expected 95% CL σ 1 ± Expected limit σ 2 ± Expected limit )=1 ± e ± e → ± ± L ), BR(H − − L H ++ L H → (pp σ )=1 ± e ± e → ± ± R ), BR(H − − R H ++ R H → (pp σ ATLAS ± e ± e -1 = 8 TeV, 20.3 fb s (a) ) [GeV] ± ± m(H 100 200 300 400 500 600 ) [fb] ± µ ± e → ±± BR(H × ) −− H ++ H → (pp σ 10-1 1 10 Observed 95% CL Expected 95% CL σ 1 ± Expected limit σ 2 ± Expected limit )=1 ± µ ± e → ± ± L ), BR(H − − L H ++ L H → (pp σ )=1 ± µ ± e → ± ± R ), BR(H − − R H ++ R H → (pp σ ATLAS ± µ ± e -1 = 8 TeV, 20.3 fb s (b) ) [GeV] ± ± m(H 100 200 300 400 500 600 ) [fb] ±µ ± µ → ±± BR(H × ) −− H ++ H → (pp σ -1 10 1 10 2 10 Observed 95% CL Expected 95% CL σ 1 ± Expected limit σ 2 ± Expected limit )=1 ± µ ± µ → ± ± L ), BR(H − − L H ++ L H → (pp σ )=1 ± µ ± µ → ± ± R ), BR(H − − R H ++ R H → (pp σ ATLAS ± µ ± µ -1 = 8 TeV, 20.3 fb s (c)
Figure 4: Upper limits at 95% CL on the cross-section as a function of the dilepton invariant mass for the production of a doubly charged Higgs boson decaying into (a) e±e±, (b) e±µ±, and (c) µ±µ±pairs with a branching ratio of 100%. The green and yellow bands correspond to the 1σ and 2σ bands on the expected limits respectively. Also shown are the expected cross-sections as a function of mass for left- and right-handed H±±. The mass range between 70 GeV and 110 GeV is not included in the e±e± channel as this region is used to estimate the background from charge misidentification.