Publisher’s version / Version de l'éditeur:
Vous avez des questions? Nous pouvons vous aider. Pour communiquer directement avec un auteur, consultez la
première page de la revue dans laquelle son article a été publié afin de trouver ses coordonnées. Si vous n’arrivez pas à les repérer, communiquez avec nous à PublicationsArchive-ArchivesPublications@nrc-cnrc.gc.ca.
Questions? Contact the NRC Publications Archive team at
PublicationsArchive-ArchivesPublications@nrc-cnrc.gc.ca. If you wish to email the authors directly, please see the first page of the publication for their contact information.
https://publications-cnrc.canada.ca/fra/droits
L’accès à ce site Web et l’utilisation de son contenu sont assujettis aux conditions présentées dans le site LISEZ CES CONDITIONS ATTENTIVEMENT AVANT D’UTILISER CE SITE WEB.
Proceedings of IAQVEC Conference 2010, 2010-08-15
READ THESE TERMS AND CONDITIONS CAREFULLY BEFORE USING THIS WEBSITE.
https://nrc-publications.canada.ca/eng/copyright
NRC Publications Archive Record / Notice des Archives des publications du CNRC :
https://nrc-publications.canada.ca/eng/view/object/?id=6622eb87-94cd-41e2-9a04-be22f05eedcf https://publications-cnrc.canada.ca/fra/voir/objet/?id=6622eb87-94cd-41e2-9a04-be22f05eedcf
NRC Publications Archive
Archives des publications du CNRC
This publication could be one of several versions: author’s original, accepted manuscript or the publisher’s version. / La version de cette publication peut être l’une des suivantes : la version prépublication de l’auteur, la version acceptée du manuscrit ou la version de l’éditeur.
Access and use of this website and the material on it are subject to the Terms and Conditions set forth at Improve energy and environmental efficiency of a generic office building
I m prove e ne rgy a nd e nvironm e nt a l e ffic ie nc y of a ge ne ric offic e building
N R C C - 5 4 4 7 4
Z h o u , L . ; M o r o f s k y , E . ; H a g h i g h a t , F .
A u g u s t 2 0 1 0
A version of this document is published in / Une version de ce document se trouve dans:
Proceedings of IAQVEC Conference 2010, Syracuse, New York, USA, August 15-18, 2010, pp. 1-9,
http://www.nrc-cnrc.gc.ca/irc
The material in this document is covered by the provisions of the Copyright Act, by Canadian laws, policies, regulations and international agreements. Such provisions serve to identify the information source and, in specific instances, to prohibit reproduction of materials without written permission. For more information visit http://laws.justice.gc.ca/en/showtdm/cs/C-42
Les renseignements dans ce document sont protégés par la Loi sur le droit d'auteur, par les lois, les politiques et les règlements du Canada et des accords internationaux. Ces dispositions permettent d'identifier la source de l'information et, dans certains cas, d'interdire la copie de documents sans permission écrite. Pour obtenir de plus amples renseignements : http://lois.justice.gc.ca/fr/showtdm/cs/C-42
Improve Energy and Environmental Efficiency of a Generic Office
Building
Liang Zhou1,*, Edward Morofsky2, and Fariborz Haghighat3
1
Institute for Research in Construction, National Research Council of Canada, Ottawa, Canada
2
Innovations and Solutions Directorate, Public Works and Government Services Canada, Ottawa, Canada
3
Department of Building, Civil and Environmental Engineering, Concordia University, Montreal, Canada
*
Corresponding email: liang.zhou@nrc-cnrc.gc.ca
ABSTRACT
A world wide effort has been made to promote green measures among office buildings, as this building sector consumes a substantial amount of energy and contributes to Green House Gases (GHG) emissions. For example, commercial and institutional buildings consumed 6% of Canada’s secondary energy use in 2001 (NRCan, 2002, 2007). This study was geared at exploring the applications of low energy technologies in office buildings. Energy and resource saving measures were extracted through a review of 55 energy efficient buildings from a wide range of climates, building sizes, and occupancy densities. The most commonly used measures were applied to a synthetic office building. The baseline building was conceived to meet the requirements of the Canadian Model National Energy Code for Buildings (MNECB) (NRC, 1997). Trnsys and the Comprehensive Assessment System for Building Environmental Efficiency (CASBEE) from Japan were used to investigate the energy performance and eco-efficiency of this building. The final results demonstrated that, by applying those commonly used energy saving measures, the annual energy use of the building was reduced by 82%. More interestingly, the eco-efficiency ranking of the building was increased from B+ (good) to A (very good) only by integrating a ground source heat pump (GSHP) into the building energy system.
INTRODUCTION
Citing the data from National Resources Canada (2007), commercial and institutional buildings accounted for 13% of Canada’ secondary energy use and 12.6% of the nation’s annual GHG emissions in 2006; out of this amount a large portion attributed to office buildings. These numbers reveal that a broader effort is needed to promote energy effective office building design practices. In response to this demand, the current study set out to explore the applications of low energy technologies in office buildings, in attempt to improve the energy and environmental performance of a generic office building. This paper summarizes the survey results from 55 energy efficient office buildings regarding their energy facts. The building projects surveyed in this study include 43 office type buildings from the high performance buildings database developed by the U.S (http://www.eere.energy.gov/ buildings/database/). Department of Energy and the National Renewable Energy Laboratory. 12 other examples of zero energy or energy efficient buildings (4 from the U.S., 3 from Canada, 2 from England, 1 from Australia, 1
from Malaysia, and 1 from Singapore) were also reviewed. Those 55 office buildings projects covered a wide range of climate type, rating level (including 4 LEED Platinum buildings, 10 LEED Gold buildings, 7 LEED Silver buildings, 4 LEED Certified buildings, and 1 BREEAM excellent building), building size, and yearly energy use intensity (EUI) by design. The most commonly adopted energy and environment beneficial measures were then investigated in a generic office building to examine the energy efficiency by performing simulations in Trnsys. In addition, the eco-efficiency of this building was investigated by employing the CASBEE approach from Japan (www.ibec.or.jp/CASBEE/english/overviewE.htm).
A REVIEW OF ENERGY EFFICIENT OFFICE BUILDINGS Building Characteristics
The building projects reviewed in this study were distributed across a very wide range of total floor areas (as shown in Figure 1 left), with the smallest building being 14.6 m2 and the largest one being 149000 m2.
0% 10% 20% 30% 40% 50% LJ1k 1k~10k 10k~100k Lj100k Size category (sq m) % o f b u il d in g s 0% 5% 10% 15% 20% 25% 30% 35% Very hot (1) Hot (2) Warm (3) Mixed (4) Cool (5) Cold (6) Very cold (7)
ASHRAE climate zone
% o f b u il d in g s
Figure 1. Size (left) and climate type (right) of reviewed building projects
In this study we follow the same approach adopted by ASHRAE 90.1 to define climate zones (http://resourcecenter.pnl.gov/cocoon/morf/ResourceCenter/article/1420). England, Australia, Malaysia, Singapore, and Canada are considered belonging to climate zone 4, 5, 1, 1, and 7, respectively. These 7 climate types were grouped into a cool-very cold type (cold) and a mixed-very hot type (warm) here for energy efficient measure analysis by climate type. As can be observed from Figure 1 (right), about 55% of the building reviewed was in cool-very cold zone (cities such as Chicago and Montreal).
Energy Efficient and Green Measures
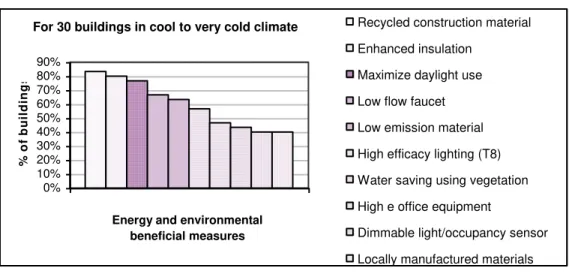
A wide range of measures and strategies were adopted by the reviewed building projects to shrink their energy use and environmental footprint. The most commonly adopted energy efficient and environmental friendly measures are summarized in Figure 2 by climate type. As observed from Figure 2, measures taken in cold climate deviate from those in warm climate. In cold climate, more emphasize was placed upon building envelop insulation level to reduce heating load (as 80% of reviewed buildings in cold climate did so), while in warm climate, building studied here focused more on
maximizing daylight use (e.g. high ceiling, high reflectance surface material, maximizing south/north facing window, low partition height, etc.) to reduce cooling load.
ENERGY PERFORMANCE OF A GENERIC BUILDING WITH COMMON GREEN MEASURES
Green Measures and Assumptions
As observed from the reviewed energy efficient buildings, energy saving measures such as optimizing building orientation/form, integrating natural ventilation, responsive shading, using photoelectric/occupancy sensor for light control, using T8 fluorescent lamp, using energy start office equipment, enhancing building envelop insulation, optimizing infiltration rate, using high efficiency condensing boiler for domestic hot water and heating generation, using high efficiency chiller for cooling generation, and replacing conventional boiler/chiller with GSHP were commonly used in existing energy efficient office buildings. In this study, such active energy efficient measures were applied to a synthetic office building, and Trnsys was used as the simulation tool to investigate the consequent energy performance. A screen shot of the Trnsys model is shown in Figure 3, with some of the energy saving components highlighted. Simulations were performed for one-year duration, and the time step was set to 0.025 hr (1.5 min) to enable quick response to the control signal.
For 25 buildings in very hot to mixed climate
0% 10% 20% 30% 40% 50% 60% 70% 80% 1
Energy and environmental beneficial measures % o f b u il d in g s
Maximize daylight use
Recycled construction material Low emission material Enhanced insulation
Dimmable light/occupancy sensor Locally manufactured materials PV cells
Operable windows Ground source heat pump Low flow faucet
For 30 buildings in cool to very cold climate 0% 10% 20% 30% 40% 50% 60% 70% 80% 90% 1
Energy and environmental beneficial measures % o f b u il d in g s
Recycled construction material Enhanced insulation
Maximize daylight use Low flow faucet Low emission material High efficacy lighting (T8) Water saving using vegetation High e office equipment
Dimmable light/occupancy sensor Locally manufactured materials
Figure 2. Top ten green measures in warm climate (up) and cold climate (down) The basic information and baseline model of those buildings were introduced in previous paper (Morofsky and Cane, 2003; Zhou etc., 2008). Based on the information obtained from the reviewed building projects, the control mechanism of natural ventilation, responsive shading, and lighting (in response to daylighting by using photoelectric sensor) were as follows:
When relative humidity of outdoor air was between 35% and 55%, and outdoor air temperature was between 20 and 23 °C, outside fresh air was directly introduced into the building, resulting an overall air change rate at 4 ACH. Chiller was switched off at the same time;
Figure 3. Trnsys model of the synthetic office building
When solar radiation incident on a vertical wall was higher than 504 kJ/hr/m2
(140 W/m2) and outdoor temperature was higher than 25 °C (cooling mode), the shading
Natural Ventilation Responsive shading
Ground source heat pump
Photoelectric sensor/T8 lamp Insulation, infiltration,
factors of all windows were set to 0.7; when solar radiation was lower than 432 kJ/hr/m2 (120 W/m2), then all the shading factor was set to 0;
When illuminance resulting from transmitted solar radiation (46.6% of which was in the visible spectrum and acted on lighting control) went below 500 lm, task lights were turned on, provided that the building was occupied (working day schedule).
Taking reference to reviewed applications, other energy saving measures were also implemented:
In the baseline case, conventional lamps with efficacy of 28 lm/W were used for illumination, resulting a internal heat load of 18 W/m2; while T8 fluorescent lamps with efficacy of 90 lm/W were used in the improved case;
In the baseline case, ordinary office equipment was assumed to present in the office: a 230 W computer was assigned to each office worker and a 200 W office equipment (could be a fax machine, a photocopier, a printer, or a scanner) was shared by every 5 people, which resulted in a 1.6 W/m2 internal heat load. Energy Star office equipment was used in the improved case, with a 45% saving in plug demand;
In the baseline case, the U-values of wall, roof, floor, and window were set to 0.55, 0.47, 0.47, and 3.2 W/m2˚C, respectively. And for the upgraded building envelop, the U-values of wall, roof, floor, and window were adapted to 0.037 (R30), 0.037 (R30), 0.4, and 1 W/m2˚C. The solar heat gain factors of all window glazing were set to 0.332; In the improved case, the thermal efficiency of the boiler was increased from 0.72 to 0.95, while the COP of the chiller was increased from 2.6 to 3.5;
Four identical water-to-water GSHPs (one for west zone, two for central zone, and one for east zone) were integrated into the small building to replace the original roof-top air cooled chiller and conventional boiler. Due to lack of technical data, it was assumed that the peak cooling capacity and power of the GSHP were around 80kW and 13 kW with chilled water temperatures at ~5°C/10°C and condenser water temperatures at ~20°C/10°C (by setting the water temperature out from the ground heat exchanger at 10°C in summer); in heating season, the peak heating capacity and power of the heat pump with auxiliary heater were assumed to be around 90 kW and 40 kW (heat pump plus auxiliary heater), with load side water from heat pump at temperatures ~30°C/22°C and source side water (to/from ground heat exchanger) at temperatures at ~8°C/6°C (by setting the water temperature out from the ground heat exchanger at 6°C in winter). The ground heat exchanger consisted of 20 vertical boreholes with 100m depth that were buried 1.2 m beneath the ground surface and spaced at 2 m (center to center), which in total resulted in 5,200 linear meters of piping. In the same borehole, the distance from the center of the downward flowing U-tube pipe to the center of the upward flowing U-tube pipe was 0.0254 m. The water flow rate through such a ground heat exchanger was modulated to provide constant outlet temperature (supply to the heat pump, 10°C in cooling mode/summer and 6°C in heating mode/winter);
The domestic hot water heater used in this study had a rated capacity of 15120 W (to meet the peak load of 90 W/person) with an overall efficiency at 0.8. It is on from 9:00 AM to 18:00 AM, off other time.
In the original case, the infiltration rate was assumed to be 0.25 L/s/m2
exterior wall area, and investigative simulation runs indicated this value was the most favorable infiltration rate to achieve minimum energy demand. And it was kept unchanged for all the simulation case.
0.00E+00 5.00E+08 1.00E+09 1.50E+09 2.00E+09 2.50E+09 3.00E+09 3.50E+09 Lite ratu re 40m (L)* 35m (W) 35m (L)* 40m (W) Nat ural ven tilat ion Res pons ive shad ing Day light con trol on light s Enh ance d in sula tion leve l Ene rgy star equ ipm ent Hig h E boi ler/ chill er With gro up s ourc e he at p um p T8 la mp
Improvement of energy performance in small building
Eequipment Light DHW Cooling Heating
Figure 4. Performance improvements from energy saving measures
Energy Simulation Results
The energy simulation results presented here include the annual energy consumption for space heating and cooling, domestic hot water heating, and artificial lighting in the building. Figures 4 and Tables 1 present energy consumptions (in kJ/yr) resulting from the combination of aforementioned energy saving strategies.
It should be noted the above 10 energy saving measures (corresponding to cases 2 to 11) were taken one on top of another, that is, once a building parameter/component was adapted and was found to result in energy saving, it was kept unchanged for further simulation and investigation. For example, in case 4 with “Natural ventilation”, natural ventilation was introduced to the building with the size of 35m (L)*40m(W) (as in case3); while in case 5, “Responsive shading” was applied to the building with the size of 35m (L)*40m(W) and natural ventilation, and so on.
Table 1. Case studies in the small office building with energy saving measures
Case Measures Heating Cooling DHW Light Equipment Total
1 Literature (baseline case) 1.613E+09 2.350E+08 1.580E+08 7.840E+08 4.220E+08 3.212E+09
2 40m(L)*35m(W) † 1.593E+09 2.569E+08 1.598E+08 7.743E+08 4.205E+08 3.204E+09
3 35m(L)*40m(W) 1.549E+09 2.960E+08 1.598E+08 7.743E+08 4.205E+08 3.200E+09
4 Natural ventilation 1.591E+09 2.523E+08 1.598E+08 7.743E+08 4.205E+08 3.198E+09
5 Responsive shading 1.592E+09 2.347E+08 1.598E+08 7.743E+08 4.205E+08 3.182E+09
6 Daylight control on lights 1.658E+09 1.945E+08 1.598E+08 4.507E+08 4.205E+08 2.883E+09
7 Enhanced insulation level 3.309E+08 2.945E+08 1.598E+08 4.307E+08 4.205E+08 1.636E+09
8 Energy star equipment 3.309E+08 2.945E+08 1.598E+08 4.307E+08 2.313E+08 1.447E+09
9
High efficiency
boiler/chiller 2.612E+08 2.196E+08 1.346E+08 4.307E+08 2.313E+08 1.277E+09
10 Group source heat pump 6.153E+07 9.921E+07 1.346E+08 8.509E+07 2.313E+08 6.117E+08
11 T8 lamp 6.163E+07 9.921E+07 1.346E+08 2.364E+07 2.313E+08 5.503E+08
† L aligns with South-North orientation; W aligns with East-West orientation
Results presented in Figure 4 and Table 1 demonstrate that by applying these ten energy saving measures together to the building under consideration, the annual energy use of
the building was reduced from 3.21E+09 kJ/yr (0.764 GJ/m2yr) to 5.50E+08 kJ/yr (0.131 GJ/m2yr), resulting an energy saving over 82%.
0% 10% 20% 30% 40% 50% 40m (L)* 35m (W) 35m (L)* 40m (W) Natu ral v entil ation Res pons ive shad ing Day light contr ol o n lig hts Enha nced insu latio n le vel Ener gy s tar e quip men t Hig h E boile r/chi ller Gro up s ourc e he at pu mp T8 la mp E n e rg y s a v in g i n s m a ll b u il d in g ( % )
Figure 5. Energy savings in the building resulting from individual energy measure Figure 5 shows the break-down energy savings resulting from each of the individual energy efficient measures, which allows the identification of relative significance of each measure. It can be observed that rigorous insulation, GSHP, and daylight control on lighting were ranked as the top three efficient measures for the building, which realized 38.8%, 20.7%, and 9.2% energy saving, respectively. These were followed by the adoption of energy star office equipment, high efficiency boiler/chiller, and T8 fluorescent lamps. In contrast, other energy saving measures such as adapted building orientation and form, natural ventilation, responsive shading were found to have limited influence on the annual energy consumption of the building under the studied conditions (climate type, building size, occupancy density, etc.).
ECO-EFFICIENCY OF THE BUILDING WITH COMMON GREEN MEASURES
This section discusses how the green measures studied here can affect the eco-efficiency of this generic building. Since the building studied here integrated a GSHP system, which would be a very interesting subject to study when performing eco-efficiency analysis. The approach chosen to explore here is CASBEE, an eco-efficiency assessment tool developed by Japan Sustainable Building Consortium.
The rating criterion of CASBEE, named Building Environment Efficiency (BEE), evaluates two aspects pertaining to a building: environmental quality (Q) and environmental load (L). A hypothetical building boundary was introduced to define a building’s Q and L. Building’s environmental quality (Q) embraces three elements including indoor environment (Q-1), quality of service (Q-2), and outdoor environment on site (Q-3). Building environmental loadings (L) can be reduced by controlling the energy consumption (LR-1), resources and materials use (LR-2), and environmental impact on-site (LR-3). Each component can be further sub-categorized into several assessment items, and the rating of each item can be a value from 0 to 1, with zero being the most unfavorable and one being the worst. Since extensive information regarding the indoor environment and system/equipment maintenance routine was required by the evaluation of BEE, a survey was distributed in the EV pavilion at Concordia (which was also included in the review section of this work) to collect such information, which was
then attributed to the synthetic building in this study. The survey result is not elaborated here due to space limit. Where information was still missing from the survey result, intermediate values were assigned to the corresponding rating items. It should be mentioned that CASBEE needs a large weighting coefficients matrix to realize assessment and scoring, which was originally determined through a widespread questionnaire among Japanese building designers, owners, operators, and related officers. Due to the lack of information here, weights for all the evaluation items in the same category were assumed to be identical; that is, all the evaluation items were of equal importance.
As a result, BEE of the current building with the aforementioned green features is symbolized as a green star in Figure 6.
8037 . 1 12 / 208 . 4 10 / 325 . 6 oadings vironmentL BuildingEn lQuality vironmenta BuildingEn BEE
If GSHP system was not used in the building, then the rating for “Local characteristics and outdoor amenity” will be reduced by 0.25, and the building quality score will change from 6.325 to 6.075. This is simply because the ground heat exchanger was assumed to be included in the virtually enclosed space defined in CASBEE, and the heat released from the borehole to the soil should not be considered negative impact on “thermal environment on the site”. Meanwhile, the rating for “Building thermal load” and “Natural energy use” will switch from 0 to 0.25 and from 0.25 to 0.75, respectively; as a result, the building environmental score will be shifted from 4.208 to 4.958. Consequently, the BEE value of the same building without GSHP is 1.5484 (marked as a orange star in Figure 6).
47 . 1 3167 . 41 75 . 60 12 / 958 . 4 10 / 075 . 6 s oading vironmentL BuildingEn y lQualit vironmenta BuildingEn E BE
Figure 6. Eco-efficiency of the building w/wo GSHP
DISCUSSIONS AND CONCLUSIONS
The authors reviewed the energy facts (including climate type, building size, EUI by design) of 55 office buildings, in attempt to summarize the most commonly used energy saving and environment friendly measures. The top ten “green” measures were extracted from the reviewed building projects and applied to a generic office building through
energy modeling in Trnsys. Such energy saving measures, in combination, were able to reduce the energy use in this particular building by 82%. The results from eco-efficiency analysis demonstrated that the integration of ground source heat pump in the current building had a noticeable positive impact on the eco-efficiency of the building—the BEE ranking of the building was improved from B+ to A.
This study was based on many assumptions. Examples include (but not limited to) the operating conditions of the GSHP and building environmental quality assessment items. Further investigation should be directed to such area to align simulation input conditions with real-world system operation states.
REFERENCES
Morofsky E and Cane D (2003) “Low-energy Building Design, Economics and the Role of Energy Storage”, Proceedings of the 9th
International Conference on Thermal Storage, Warsaw, Poland.
National Research Council of Canada (1997) “Canadian Model National Energy Code for Buildings 1997” [online], available: http://www.nationalcodes.ca/mnecb/index_e.shtml#
Natural Resources Canada (2007) “Energy Use Data Handbook Tables (Canada): Table 2&3” [online], available:
http://oee.nrcan.gc.ca/corporate/statistics/neud/dpa/handbook_totalsectors_ca.cfm?attr=0 Natural Resources Canada (2002) “Survey 2000 Commercial and Institutional Building Energy
Use: Detailed Statistical Report” [online], available:
http://oee.nrcan.gc.ca/corporate/statistics/neud/dpa/data_e/CIBEUS_ENG.pdf
Zhou, L, Morofsky, E, and Haghighat, H. 2008. Applying Simulation-based Optimization to Improve Energy Efficiency in Two Generic Office Buildings, Proceedings of The First International Conference on Building Energy and Environment, pp 378-385.