Publisher’s version / Version de l'éditeur:
Applied Physiology, Nutrition, and Metabolism, 2017-03-31
READ THESE TERMS AND CONDITIONS CAREFULLY BEFORE USING THIS WEBSITE. https://nrc-publications.canada.ca/eng/copyright
Vous avez des questions? Nous pouvons vous aider. Pour communiquer directement avec un auteur, consultez la première page de la revue dans laquelle son article a été publié afin de trouver ses coordonnées. Si vous n’arrivez pas à les repérer, communiquez avec nous à PublicationsArchive-ArchivesPublications@nrc-cnrc.gc.ca.
Questions? Contact the NRC Publications Archive team at
PublicationsArchive-ArchivesPublications@nrc-cnrc.gc.ca. If you wish to email the authors directly, please see the first page of the publication for their contact information.
Archives des publications du CNRC
This publication could be one of several versions: author’s original, accepted manuscript or the publisher’s version. / La version de cette publication peut être l’une des suivantes : la version prépublication de l’auteur, la version acceptée du manuscrit ou la version de l’éditeur.
For the publisher’s version, please access the DOI link below./ Pour consulter la version de l’éditeur, utilisez le lien DOI ci-dessous.
https://doi.org/10.1139/apnm-2016-0644
Access and use of this website and the material on it are subject to the Terms and Conditions set forth at
Shrimp oil extracted from the shrimp processing waste reduces the
development of insulin resistance and metabolic phenotypes in
diet-induced obese rats
Nair, Sandhya; Gagnon, Jacques; Pelletier, Claude; Tchoukanova, Nadia;
Zhang, Junzeng; Ewart, H. Stephen; Ewart, Vanya; Jiao, Guangling; Wang,
Yanwen
https://publications-cnrc.canada.ca/fra/droits
L’accès à ce site Web et l’utilisation de son contenu sont assujettis aux conditions présentées dans le site LISEZ CES CONDITIONS ATTENTIVEMENT AVANT D’UTILISER CE SITE WEB.
NRC Publications Record / Notice d'Archives des publications de CNRC:
https://nrc-publications.canada.ca/eng/view/object/?id=07a747b9-4bb7-4152-a457-bb2afa385a53
https://publications-cnrc.canada.ca/fra/voir/objet/?id=07a747b9-4bb7-4152-a457-bb2afa385a53
ARTICLE
Shrimp oil extracted from the shrimp processing waste
reduces the development of insulin resistance and metabolic
phenotypes in diet-induced obese rats
Sandhya
Nair
,
Jacques
Gagnon
,
Claude
Pelletier
,
Nadia
Tchoukanova
,
Junzeng
Zhang
,
H. Stephen
Ewart
,
K. Vanya
Ewart
,
Guangling
Jiao
, and
Yanwen
Wang
Abstract:Diet-induced obesity, insulin resistance, impaired glucose tolerance, chronic inflammation, and oxidative stress represent the main features of type 2 diabetes mellitus. The present study was conducted to examine the efficacy and mecha-nisms of shrimp oil on glucose homeostasis in obese rats. Male CD rats fed a high-fat diet (52 kcal% fat) and 20% fructose drinking water were divided into 4 groups and treated with the dietary replacement of 0%, 10%, 15%, or 20% of lard with shrimp oil for 10 weeks. Age-matched rats fed a low-fat diet (10 kcal% fat) were used as the normal control. Rats on the high-fat diet showed impaired (p < 0.05) glucose tolerance and insulin resistance compared with rats fed the low-fat diet. Shrimp oil improved (p < 0.05) oral glucose tolerance, insulin response, and homeostatic model assessment-estimated insulin resistance index; decreased serum insulin, leptin and hemoglobin A1c, and free fatty acids; and increased adiponectin. Shrimp oil also increased (p < 0.05) antioxidant capacity and reduced oxidative stress and chronic inflammation. The results demonstrated that shrimp oil dose-dependently improved glycemic control in obese rats through multiple mechanisms.
Key words:diet-induced obesity, glucose tolerance, insulin sensitivity, oxidative stress, inflammation, rat.
Résumé :l’obésité de cause alimentaire, l’insulinorésistance, l’intolérance au glucose, l’inflammation chronique et le stress oxydatif sont les principales caractéristiques du diabète sucré. La présente étude examine l’efficacité et les mécanismes de l’huile de crevette sur l’homéostasie du glucose chez des rats obèses. On divise des rats CD mâles ayant reçu une alimentation riche en gras (52 kcal % gras) et de l’eau contenant 20 % de fructose en quatre groupes recevant durant 10 semaines un substitut alimentaire constitué de 0 %, 10 %, 15 % ou 20 % de saindoux et d’huile de crevette. Le groupe de contrôle normal comprend des rats appariés selon l’âge et ayant reçu une alimentation faible en gras (10 kcal % gras). Les rats ayant reçu une alimentation riche en gras présentent des troubles (p < 0,05) de tolérance au glucose et de résistance a` l’insuline comparativement aux rats ayant reçu une alimentation faible en gras. L’huile de crevette améliore (p < 0,05) la tolérance au glucose per os, la réponse insulinique et l’indice homeostatic model assessment-estimated insulin
resistance index, suscite une diminution de l’insuline sérique, de la leptine et de l’hémoglobine A1c et des acides gras libres ainsi qu’une augmentation de l’adiponectine. L’huile de crevette améliore aussi (p < 0,05) la capacité antioxydante et diminue le stress oxydatif ainsi que l’inflammation chronique. Ces observations démontrent que l’huile de crevette améliore de façon proportionnelle a` la dose le contrôle glycémique chez des rats obèses, et ce, au moyen de mécanismes multiples. [Traduit par la Rédaction]
Mots-clés :obésité d’origine alimentaire, tolérance au glucose, sensibilité insulinique, stress oxydatif, inflammation, rat.
Introduction
Obesity is growing in high-income and low- to middle-income countries alike, particularly in urban settings (Popkin et al. 2012). As the rates of obesity continue to rise, insulin resistance is be-coming one of society’s major public health issues. Obesity is considered to be a result of an imbalance between calories con-sumed and calories expended (Hill et al. 2012). Tissues such as muscle, fat, and liver become less responsive to insulin and thus results in a state of insulin resistance; this is characterized by an
impaired ability of insulin to inhibit glucose output from the liver and to promote glucose uptake in the peripheral tissues, mainly muscle and adipose tissues (Wilcox 2005). Although increasing physical activity improves weight loss (Jakicic 2009) and insulin sensitivity (Ross 2003), it is difficult to achieve in modern societ-ies. Alternatively, dietary modifications including taking supple-ments and nutraceuticals may improve insulin sensitivity and lower the incidence of type 2 diabetes and other metabolic dis-eases (Mirmiran et al. 2014).
Received 16 November 2016. Accepted 20 March 2017.
S. Nair.Coastal Zones Research Institute Inc. (CZRI), Shippagan, NB E8S 1J2, Canada; Natural Health Products Program, Aquatic and Crop Resource Development, National Research Council of Canada, 550 University Avenue, Charlottetown, PE C1A 4P3, Canada.
J. Gagnon, C. Pelletier, and N. Tchoukanova.Coastal Zones Research Institute Inc. (CZRI), Shippagan, NB E8S 1J2, Canada.
J. Zhang.Natural Health Products Program, Aquatic and Crop Resource Development, National Research Council of Canada, 1411 Oxford Street, Halifax, NS B3H 3Y8, Canada.
H.S. Ewart.Novaceutics Consulting, 6501 Oak St, Halifax, NS B3L 1H5, Canada.
K.V. Ewart.Department of Biochemistry and Molecular Biology, Dalhousie University, 5850 College Street, Halifax, NS B3H 4R2, Canada. G. Jiao.Coastal Zones Research Institute Inc. (CZRI), Shippagan, NB E8S 1J2, Canada; Natural Health Products Program, Aquatic and Crop Resource Development, National Research Council of Canada, 1411 Oxford Street, Halifax, NS B3H 3Y8, Canada.
Y. Wang.Natural Health Products Program, Aquatic and Crop Resource Development, National Research Council of Canada, 550 University Avenue, Charlottetown, PE C1A 4P3, Canada.
Corresponding authors:Yanwen Wang (email:yanwen.wang@nrc.ca); Jacques Gagnon (email:Jacques.gagnon@umoncton.ca). Copyright remains with the author(s) or their institution(s). Permission for reuse (free in most cases) can be obtained fromRightsLink.
Among different foods and nutraceuticals, seafood appears to have an inverse relationship with the incidence of metabolic syn-drome (Baik et al. 2010;Kim et al. 2015;Patel et al. 2009). Fish is mostly studied for its various nutritional values and health bene-fits (Hosomi et al. 2012). Supplementation of fish oil is reported to improve insulin resistance (Albert et al. 2014; Lombardo and Chicco 2006), an effect that might be due to its content of mono-unsaturated fatty acids (MUFA) and n-3 polymono-unsaturated fatty ac-ids (PUFA) compared with other animal foods (Larsen et al. 2011;
Nettleton and Katz 2005;Ramel et al. 2008;Swanson et al. 2012). Northern shrimp (Pandalus borealis) is the most abundant cold-water shrimp in the North Atlantic and Pacific areas and has been widely harvested since the early 1960s. The head and tail of this shrimp is rich in lipids. A recent study showed that Northern shrimp oil contains not only a high content of n-3 PUFA but also a high concentration of antioxidants (Subramanian et al. 2015), the latter are also beneficial to metabolic health and glucose homeo-stasis (Vincent et al. 2009). However, the heads and tails of shrimp are disposed of as a waste material at shrimp processing plants, impacting the environment and increasing production cost. The reason that shrimp heads and tails are discarded as waste by the processing industry is the lack of understanding regarding their nutritional value and potential for value-added products. As a result, the industry has not invested in technology and equipment required to efficiently extract valuable ingredients such as n-3 PUFAs and antioxidants from the waste stream. With our recent development of an extraction technology (US 20160145533 A1), efficient extraction and preservation of oil from shrimp process-ing wastes has become feasible. The present study reports that PUFA-rich oil extracted from the shrimp processing waste with this technology has beneficial effects on insulin sensitivity, glyce-mic control, and other metabolic phenotypes associated with di-abetes in a rat model of insulin resistance.
Materials and methods
Preparation of shrimp oil for animal study and analyses
The shrimp oil used for this study was extracted from the pro-cessing water of Northern shrimp caught in the Atlantic area, specifically the Anticosti fishing zone of the Gulf of Saint Law-rence and further cleaned using a patented technology (US 20160145533 A1). Briefly, during the processing of Northern shrimp, the water was recovered and subjected to a dissolved air flotation system with a flocculating agent. The suspended and/or dissolved solids formed aggregates, which were collected and di-rected into a horizontal centrifuge to further separate solids from liquids. The liquid phase containing mainly water and oil was pumped into a 3-phase vertical centrifuge to separate oil from water and solid residues. The oil fraction was used for animal studies.
After washing with 5 mL hexane, a Supelclean LC-Si SPE car-tridge (Sigma–Aldrich Corp., St Louis, Mo., USA) was loaded with 10 mL of shrimp oil dissolved in 5 mL hexane. The cartridge was eluted with 2 × 5 mL hexane containing 6% diethyl ether to obtain a triacylglycerol-rich fraction and then 2 × 5 mL acetone contain-ing 200 mg/L butylated hydroxytoluene to obtain the pigment fraction. The 2 acetone fractions were pooled, evaporated under nitrogen, and stored at –20 °C until analysis.
Analysis of astaxanthin in shrimp oil
The shrimp oil was subjected to a solid-phase extraction to sep-arate sterols, carotenoids, and other components using silica Strat-si-1 cartridge (Phenomenex Inc., Torrance, Calif., USA). The astaxanthin was released from the mono and di-esters following the reported method (Del Campo et al. 2004) and analyzed on an
Varian Prostar 240 HPLC (Agilent Technologies, Mississauga, Ont., Canada) according to the method described elsewhere (Yuan and Chen 1997).
Analysis of vitamins A and E in shrimp oil
The content of vitamin A in shrimp oil was measured according to an Association of Official Analytical Chemists (AOAC) method (AOAC 2001.13-2001) while the content of vitamin E was deter-mined using an American Association of Clinical Chemistry (AACC) method (AACC 86-06) using the HPLC.
Analysis of fatty acids in shrimp oil
An aliquot of shrimp oil was transferred to a screw-capped glass tube that contains 1 mg of nonadecanoic acid (C19:0) as an internal standard and evaporated to dryness under nitrogen. Fatty acids were trans-esterified by re-dissolving the dried lipid samples in 3 mL of methanol/toluene mix (3:2, v/v) with additional 2 mL of 5% acetyl chloride in methanol. The tubes were flushed with ni-trogen, closed tightly, and heated at 100 °C for 1 h, with gentle shaking every 15 min. After cooling to room temperature, 4 mL of distilled water and 1 mL of hexane were added. The tubes were shaken vigorously and centrifuged at 2000 r/min for 2 min. The hexane/toluene phase containing methylated fatty acids was transferred to a GC vial. An Agilent DB-WAX capillary column (20 m × 0.18 mm internal diameter × 0.18 m) on an Agilent 7890B GC (Agilent Technologies), equipped with an autosampler, a purge ultimate union backflush, and flame ionization detector, was used to separate and quantify the fatty acid methyl esters. One L of sample was injected onto the column using a split mode (1:50) and hydrogen was used as the carrier gas. The initial col-umn/oven temperature was set at 140 °C for 0.2 min, increased to 170 °C at 40 °C/min, and held for 3 min, then to 185 °C at 4.9 °C/ min, further to 200 °C at 2.5 °C/min and held 3 min, and finally ramped to 220 °C at 2.5 °C/min. At the end of each run, the purge ultimate union backflush was used to flush out the sterols and other less volatile compounds through the split line of the injec-tion port. Individual fatty acids were identified against the reten-tion time of corresponding standards running in parallel with the samples, and quantitated in reference to the internal standard.
Rats and diets
The animal use and experimental procedures were approved by the Joint Animal Care and Research Ethics Committee of the Na-tional Research Council of Canada and the University of Prince Edward Island, Charlottetown, Prince Edward Island, Canada. The study was conducted in accordance with the guidelines of the Canadian Council on Animal Care.
Male CD rats (200–225 g) were obtained from Charles River (Saint Constant, Que., Canada) and housed individually in rat cages with a 12-h light/12-h dark cycle and free access to rodent chow and water. After 7 days of adaptation, body weight was obtained and blood glucose was measured. Rats were then ran-domly assigned based on body weight and blood glucose concen-tration into 2 groups of 12 rats and 48 rats, respectively. The group of 12 rats was fed a low-fat control (LFC) diet and the remaining 48 rats were fed a high-fat control (HFC) diet. A week later, rats on the HFC diet were segregated into 4 groups. One group was used as the control (continued on the HFC diet) whereas the other 3 groups were fed the HFC diet with 10% (SO10), 15% (SO15), or 20% (SO20) of lard being replaced with shrimp oil. The composition of diets is provided in Supplementary Table S11. Rats on the HFC, SO10, SO15,
and SO20 diets also received 20% fructose drinking water, which was started at the same time as the HFC diet and prepared every other day. The inclusion of 20% fructose in drinking water in addition to the high-fat diet was used to accelerate the
develop-1Supplementary data are available with the article through the journal Web site athttp://nrcresearchpress.com/doi/suppl/10.1139/apnm-2016-0644.
Pagination not final (cite DOI) / Pagination provisoire (citer le DOI)
2 Appl. Physiol. Nutr. Metab. Vol. 00, 0000
Published by NRC Research Press
ment of insulin resistance (Stranahan et al. 2008). Rats were weighed weekly and food intake was monitored daily for 10 weeks. At the end of the study, the rats were fasted overnight and then anesthetized by inhalation of isoflurane (Pharmaceutical Partners of Canada Inc., Richmond Hill, Ont., Canada) and blood was col-lected immediately via cardiac puncture into serum and plasma tubes (BD Biosciences, Ont., Canada). The rats were euthanized by cervical dislocation and the liver was immediately dissected, weighed, and flash-frozen in liquid nitrogen. Serum, plasma, and liver samples were stored in a –80 °C freezer.
Glucose and insulin tolerance tests
Oral glucose tolerance test (OGTT) was carried out during weeks 4 and 9 of the treatment and insulin tolerance test (ITT) was con-ducted in all rats during week 10 of treatment after 4-h fasting as reported previously (Wang et al. 2015). The area under the curve (AUC) of blood glucose levels was calculated for the OGTT and ITT, respectively.
Analysis of blood glucose and lipids
The fasting serum glucose concentration was measured in trip-licate as reported previously (Wang et al. 2015). The fasting serum total cholesterol, high-density lipoprotein cholesterol (HDL-C), and triacylglycerol (TAG) were measured in triplicate following the published methods (Wang et al. 2014). The serum free fatty acids were determined in duplicate using commercial kits follow-ing the kit instructions (Abcam Inc., Toronto, Ont., Canada).
Measurement of serum insulin, leptin, adiponectin, and glycated hemoglobin (HbA1c)
HbA1c in the fasting serum was measured in duplicate using a commercial assay kit (Crystal Chem, Ill., USA) following the kit instructions. The concentration of serum insulin, leptin, and adi-ponectin was also measured using the ELISA kits, with the rat insulin kits being obtained from Mercodia (Uppsala, Sweden), leptin kits from R&D Systems (Minneapolis, Minn., USA) and adi-ponectin kits from Abcam Inc. The coefficient of variance be-tween replicates was 7.2%, 5.1%, and 4.3% and detection range was 1.56–100 ng/mL, 0.15–5.5 g/mL, and 62.5–4000 pg/mL for adi-ponectin, insulin, and leptin ELISA kits, respectively. All samples were within the detection range except those for adiponectin for which a dilution factor of 1:400 was applied.
Measurement of inflammatory biomarkers
The serum concentrations of C-reactive protein (CRP), tumor necrosis factor-␣ (TNF-␣), interleukin-6 (IL-6), interleukin-1 (IL-1), and monocyte chemoattractant protein-1 (MCP-1) were measured in duplicate using commercial ELISA kits following the kits instruc-tions. The rat CRP ELISA kit was from Abcam Inc., the TNF-␣ kit from Biolegend (San Diego, Calif., USA), the IL-1 and MCP-1 ELISA kits from Affymetrix-eBioscience (San Diego, Calif., USA), and the IL-6 ELISA kit from Cusabio (Wuhan, Hubei, China). The coefficient of variation between replicates was 7.4%, 6.7%, <10%, <8%, and <4.9% for TNF-␣, MCP-1, IL-1, IL-6, and CRP assays, respectively. The detection range was 7.5–800 pg/mL, 0.31–20 pg/mL, and 0.78– 50 ng/mL for the TNF-␣, IL-6, and CRP, respectively. The sensitivity was >4.7 pg/mL and >4 pg/mL for the MCP-1 and IL-1 assays, respectively. The samples were diluted at 1:60 000 for CRP analysis.
Measurement of oxidative stress biomarkers
The activity of catalase, superoxide dismutase (SOD), glutathione peroxidase, glutathione reductase, reduced glutathione (GSH), oxidized glutathione (GSSG), and thiobarbituric acid reactive substances (TBARS) in the liver and the concentration of total antioxidants in the serum (1:20 dilution) were measured in dupli-cate using the commercial assay kits (Cayman chemicals, Mich., USA) following the kits instructions. It should be noted that TBARS assay is nonspecific, measuring several products of
oxida-tive stress rather than directly measuring reacoxida-tive oxygen species, which have extremely short half-lives (Pryor 1991).
Calculation of homeostatic model assessment of insulin resistance (HOMA-IR)
HOMA-IR was calculated as (glucose in mmol/L × insulin in mU/L)/22.5.
Statistical analysis
All analyses were performed using SAS software version 9.2 (SAS Institute, N.C., USA). The difference between the HFC and LFC was analyzed using the Student’s t test. The treatment effect was analyzed using 1-way ANOVA. Repeated-measures t test and re-peated measures 1-way ANOVA were employed for the parameters that were measured multiple times. When a significant treatment effect was obtained, differences among the HFC, SO10, SO15, and SO20 were determined by using the least-squares means test ad-justed to Tukey. Significance level was set at p < 0.05. The results are presented as means ± SE (n = 11–12).
Results
Composition of shrimp oil
The shrimp oil used in the present study contains ≥95% of tria-cylglycerols and 1.7% sterols (Subramanian et al. 2015). Although not measured in the present study, the phospholipids content was estimated to be less than 3%, considering that the oil also contains a small amount of free fatty acids and other fat-soluble compo-nents. Fatty acid composition and content of shrimp oil are pro-vided in Supplementary Table S2.1 It was found that this oil
contained a low content of saturated fatty acids (18.2%) while hav-ing high levels of MUFA (54.6%) and PUFA (27.2%). Moreover, there were many different MUFA with different positions of the first double-bond. The predominant MUFA were C18:1n-9 (13.0%), C16: 1n-7 (12.0%), C22:1n-11+13 (9.7%), C20:1n-9 (7.5%), C18:1n-7 (4.1%), C22:1n-9 (2.6%), and C20:1n-7 (2.3%). A high level of n-3 PUFA, es-pecially eicosapentaenoic acid (EPA) (9.9%) and docosahexaenoic acid (DHA) (10.3%), was another beneficial characteristic of this oil. Thus, the fatty acid composition of the experimental diets dif-fered substantially. The saturated fatty acids decreased whereas the monounsaturated and polyunsaturated fatty acids increased with the replacement of 10%–20% dietary lard with shrimp oil. There was a marked increase of n-3, especially EPA and DHA, while n-6 fatty acids were decreased by replacing lard with shrimp oil (Supplementary Table S31). In addition to its fatty acid profile,
shrimp oil used in the present study was also analyzed for the content of antioxidants (Supplementary Table S41). Ketocarotenoid
astaxanthin (≥400 g/g), vitamin E (≥50 IU/100 g), and vitamin A (≥1000 retinol equivalents/100 g) were the main antioxidants. Fur-thermore, astaxanthin in this shrimp oil existed as 75% diesters and 23% monoesters and of the total astaxanthin, 57% was trans-astaxanthin, and 43% was cis-astaxanthin (Subramanian et al. 2015). In addition, the oil contained 1.7% sterols, of which 0.8% was cholesterol (Subramanian et al. 2015). Analysis for contaminants in the shrimp oil revealed that dioxins, furans, and polychlori-nated biphenyls were below the levels of detection or the accept-able limits for consumption set by regulatory agencies such as the Canadian Food Inspection Agency (data not shown).
Body weight and food intake
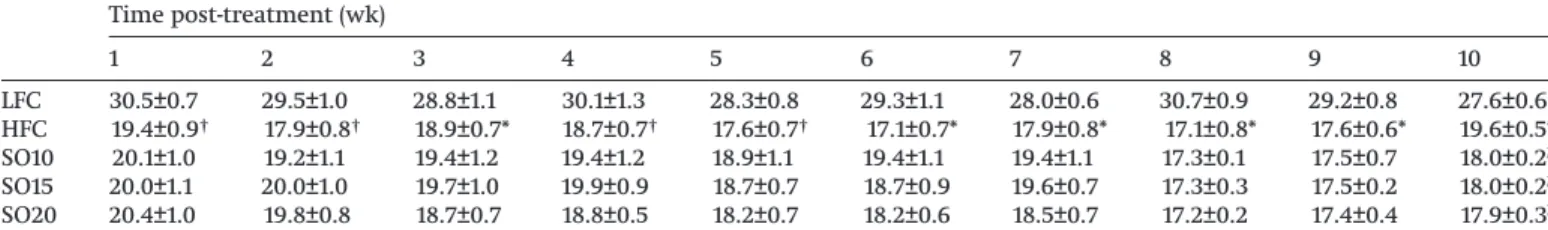
As shown inTable 1, the HFC group had higher (p < 0.05) body weights than the LFC group. However, no differences were found among the HFC, SO10, SO15, and SO20 groups. The food intake was lower (p < 0.05) in the HFC group than in the LFC group (Table 2). The shrimp oil supplementation did not alter food consumption from week 1 to week 9 of the treatment. On week 10, food intake increased in the HFC group whereas it decreased in the SO10, SO15, and SO20 groups (p < 0.01).
T1
Shrimp oil improves oral glucose tolerance
Semi-fasting (4-h) blood glucose was elevated in the HFC group as compared with the LFC group from week 7 to the end of the study (Table 3). The 3 doses of shrimp oil did not show significant effects compared with the HFC group. The fasting (12-h) serum glucose levels did not differ among the HFC, LFC, and treatment groups (Table 4).
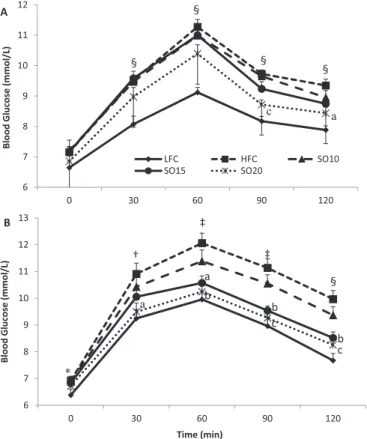
The oral glucose loading induced significant increases of blood glucose level in rats of the HFC group at every time point post-oral glucose loading compared with the LFC control in weeks 4 (Fig. 1A) and 9 (Fig. 1B) of the treatment, respectively, indicating that glu-cose intolerance was developed in the HFC group as a result of free access to the high-fat diet and 20% fructose drinking water. This effect was reversed completely or partially by replacing a small portion of dietary lard with shrimp oil. In the first oral glucose tolerance test conducted during week 4 of the treatment, rats of the SO20 group showed lower (p < 0.05) blood glucose levels at 90 and 120 min after the oral glucose loading (Fig. 1A). The same test was repeated in week 9 of the treatment. The blood glucose levels was lowered (p < 0.05) in both the SO20 and SO15 groups at 60, 90, and 120 min (Fig. 1B) and the SO20 group also showed lower (p < 0.05) glucose levels at 30 min compared with the HFC group. Despite a lack of an effect on body weight, replacing 20% or 15% of dietary lard with shrimp oil resulted in a significant improvement of oral glucose tolerance. Consistently, the AUC of OGTT in either week 4 or week 9 of the treatment showed significant benefits of
shrimp oil (Table 5). The AUC was higher (p < 0.01) in the HFC group than in the LFC group in both OGTTs. It was reduced (p < 0.01) by 7% in the SO20 group in week 4 of treatment. A better effect was seen in week 9 of treatment, with a 12% reduction (p < 0.001) being observed in the SO20 group relative to the HFC group. In this test, the SO15 also showed a significant effect and 11% lower (p < 0.01) than the HFC group.
Shrimp oil improves insulin sensitivity
Further to the oral glucose tolerance test, an insulin tolerance test was performed to determine the effect of shrimp oil on insu-lin sensitivity. Rats of the HFC group showed higher (p < 0.05) levels of blood glucose at 0, 30, 60, 90, and 120 min, respectively, than those of the LFC group after the intraperitoneal insulin in-jection (Fig. 2), suggesting that rats fed the high-fat diet developed insulin resistance. Interestingly, when dietary lard was partially replaced with shrimp oil the body response to the injected insulin was significantly improved. As a result, rats in the SO20 group showed markedly lower (p < 0.05) glucose levels at all time points except 30 min post-insulin injection. The blood glucose levels were also lowered (p < 0.05) in the SO15 group at 60, 90, and 120 min and in the SO10 group at 90 and 120 min compared with the HFC group. Consistently, the HFC group had a higher (p < 0.001) AUC than the LFC group (Table 5). The shrimp oil dose-dependently decreased the AUC, which was 11% (p < 0.01), 14% (p < 0.001), and 17%
Table 1.Effect of shrimp oil supplementation on the body weight (g) of rats fed a high-fat diet and fructose drinking water. Time post-treatment (wk) 0 1 2 3 4 5 6 7 8 9 10 LFC 388.2±4.2 447.2±6.0 474.6±7.1 506.3±7.7 531.7±8.2 558.3±8.7 576.7±10.8 598.4±10.8 621.3±11.6 636.0±12.0 653.6±12.4 HFC 413.6±6.4 478.9±8.6† 509.5±9.9† 552.0±10.6* 575.6±12.5† 603.2±13.6† 625.4±14.6* 651.8±15.2* 673.0±16.5* 694.2±16.9* 716.8±017.2* SO10 407.0±4.9 478.9±7.7 514.8±9.5 553.3±11.6 580.6±14.2 615.2±14.1 647.0±16.5 673.4±17.2 698.9±17.9 715.4±16.4 733.1±17.6 SO15 404.7±7.5 480.2±8.5 518.3±10.2 563.7±11.9 593.7±12.8 624.4±14.0 650.4±16.1 677.0±16.2 702.9±18.6 723.4±18.3 732.8±18.2 SO20 406.0±4.2 477.5±6.4 512.2±8.0 553.1±10.4 580.0±11.8 616.4±14.9 642.7±16.2 665.9±18.0 685.6±19.5 702.1±19.5 715.7±21.8
Note:The results are presented as means ± SE (n = 11–12). The difference between the HFC and LFC groups was analyzed using repeated-measures t test. The
treatment effect was analyzed using repeated-measures 1-way ANOVA and differences among the HFC, SO10, SO15, and SO20 groups were determined using the least-squares means test adjusted to Tukey. The significance level was set to 0.05. *, p < 0.05 and†, p < 0.01 compared with LFC. HFC, high-fat control; LFC, low-fat control; SO10, HFC diet with 10% of lard being replaced with shrimp oil; SO15, HFC diet with 15% of lard being replaced with shrimp oil; SO20, HFC diet with 20% of lard being replaced with shrimp oil.
Table 2.Effect of shrimp oil supplementation on the food intake (g) of rats fed a high-fat diet and fructose drinking water. Time post-treatment (wk) 1 2 3 4 5 6 7 8 9 10 LFC 30.5±0.7 29.5±1.0 28.8±1.1 30.1±1.3 28.3±0.8 29.3±1.1 28.0±0.6 30.7±0.9 29.2±0.8 27.6±0.6 HFC 19.4±0.9† 17.9±0.8† 18.9±0.7* 18.7±0.7† 17.6±0.7† 17.1±0.7* 17.9±0.8* 17.1±0.8* 17.6±0.6* 19.6±0.5* SO10 20.1±1.0 19.2±1.1 19.4±1.2 19.4±1.2 18.9±1.1 19.4±1.1 19.4±1.1 17.3±0.1 17.5±0.7 18.0±0.2b SO15 20.0±1.1 20.0±1.0 19.7±1.0 19.9±0.9 18.7±0.7 18.7±0.9 19.6±0.7 17.3±0.3 17.5±0.2 18.0±0.2b SO20 20.4±1.0 19.8±0.8 18.7±0.7 18.8±0.5 18.2±0.7 18.2±0.6 18.5±0.7 17.2±0.2 17.4±0.4 17.9±0.3b
Note:The results are presented as means ± SE (n = 11–12). The difference between the HFC and LFC groups was analyzed using repeated-measures t test. The
treatment effect was analyzed using repeated measures 1-way ANOVA and differences among the HFC, SO10, SO15, and SO20 were determined using the least-squares means test adjusted to Tukey. The significance level was set to 0.05. *, p < 0.05 and†, p < 0.01 compared with LFC; b, p < 0.01 compared with HFC. SeeTable 1for definitions of terms.
Table 3.Effect of shrimp oil supplementation on semi-fasting blood glucose (mmol/L) of rats fed a high-fat diet and fructose drinking water. Time post-treatment (wk) 0 1 2 3 4 5 6 7 8 9 10 LFC 6.7±0.1 6.6±0.1 6.8±0.3 6.7±0.2 6.5±0.2 6.4±0.2 6.1±0.1 6.1±0.1 5.9±0.2 6.1±0.2 6.2±0.2 HFC 7.0±0.2 7.0±0.2 6.8±0.1 7.1±0.2 7.2±0.2 6.9±0.2 6.8±0.2 6.9±0.2† 6.7±0.1† 6.9±0.1† 7.0±0.2* SO10 7.0±0.2 6.9±0.2 6.7±0.2 7.0±0.1 7.4±0.4 6.9±0.2 6.8±0.1 6.9±0.1 6.6±0.1 6.8±0.2 6.6±0.1 SO15 6.9±0.2 6.9±0.2 6.7±0.2 6.9±0.1 7.2±0.2 6.9±0.1 6.8±0.1 6.4±0.2 6.8±0.2 6.8±0.2 6.6±0.1 SO20 6.9±0.1 6.7±0.1 6.7±0.2 6.8±0.2 6.9±0.2 6.9±0.1 6.7±0.2 6.5±0.1 6.5±0.2 6.7±0.2 6.4±0.2
Note:The results are presented as means ± SE (n = 11–12). The difference between the HFC and LFC groups was analyzed using repeated-measures t test. The
treatment effect was analyzed using repeated measures 1-way ANOVA and differences among the HFC, SO10, SO15, and SO20 were determined using the least-squares means test adjusted to Tukey. The significance level was set to 0.05. *, p < 0.05 and†, p < 0.01 compared with LFC. SeeTable 1for definitions of terms.
Pagination not final (cite DOI) / Pagination provisoire (citer le DOI)
4 Appl. Physiol. Nutr. Metab. Vol. 00, 0000
Published by NRC Research Press
T3
T4
F1
T5
(p < 0.0001) lower in the SO10, SO15, and SO20 groups, respectively, compared with the HFC group.
Effect of shrimp oil on serum HbA1c, insulin, leptin, and adiponectin concentrations and HOMA-IR
The serum level of HbA1c is an important indicator of impaired glucose metabolism or insulin resistance. The HFC group mark-edly increased (p < 0.05) the serum HbA1c levels compared with LFC group (Table 4). Strikingly, the elevation of HbA1c in the HFC group was reversed by replacing dietary lard with shrimp oil at the dose of 10%, 15%, or 20%. Similarly, the serum concentrations of insulin and leptin were elevated (p < 0.01) in the HFC group compared with that in the LFC group, whereas they were dose-dependently lowered in the SO10, SO15, and SO20 groups, respec-tively. Serum insulin was lower (p < 0.01) in the SO20 group as was serum leptin (p < 0.05) relative to the HFC group. In contrast, the serum adiponectin was decreased by 40% (p < 0.001) in the HFC group compared with the LFC group, which was reversed by the replacement of dietary lard with shrimp oil. Compared with the HFC group there were 43%, 52%, and 60% increases (p < 0.01) of serum adiponectin concentrations in the SO10, SO15, and SO20 groups, respectively. The HOMA-IR is calculated based on the fast-ing blood glucose and insulin concentrations and widely used to assess the severity of insulin resistance. The present study showed a higher (p < 0.001) HOMA-IR index in the HFC group than the LFC group. This effect was improved with shrimp oil in a dose-dependent manner, resulting in a significantly lower (p < 0.05) value in the SO20 group than the HFC group.
Shrimp oil improves serum lipid profile
The replacement of dietary lard with shrimp oil dose-dependently lowered the serum total cholesterol and a significant difference was observed between the SO20 and HFC groups (p < 0.05), al-though no difference was observed between the HFC and LFC groups (Table 4). The HFC group showed lower serum TAG (p < 0.001) and HDL-C (p < 0.0001) levels than the LFC group and no significant treatment effects were observed. Compared with the LFC diet, the HFC diet increased (p < 0.05) the serum free fatty acid concentration. This was reduced by 11%, 26%, and 43% in the SO10, SO15, and SO20, respectively, but the changes did not reach sta-tistical significance (p = 0.054 for the SO20 vs. HFC group).
Effect of shrimp oil on total antioxidant capacity and oxidative stress biomarkers
The serum total antioxidant capacity was not different between the HFC and LFC groups (Table 6); however, it was increased by
dietary shrimp oil in a dose-dependent manner. As a result, the SO20 group showed a significantly higher value than the HFC group (p < 0.05). Although no differences were noticed between the HFC and LFC groups, the activity of liver glutathione reduc-tase, catalase, and SOD was increased (p < 0.05) in the SO20 group compared with the HFC group. Moreover, the 3 doses of shrimp oil increased (p < 0.05) liver glutathione compared with the HFC group while no difference was seen between the HFC and LFC groups.
Effect of shrimp oil on serum inflammatory biomarkers
As shown inTable 6, TNF-␣ was increased (p < 0.0001) by 8-fold in the HFC group relative to the LFC group but decreased (p < 0.001) significantly and dose-dependently with shrimp oil. A reduction of 34%, 36%, and 71% was observed in the SO10, SO15, and SO20 groups, respectively. Shrimp oil did not show significant effects on serum MCP-1, IL-1, IL-6, and CRP levels.
Discussion
The present study demonstrated that rats fed the high-fat diet and fructose drinking water gained more weight and became obese as compared with those given the low-fat diet. They also developed glucose intolerance and insulin and leptin resistance, and increased production of pro-inflammatory cytokine TNF-␣. These observations are in agreement with previous reports (Geng et al. 2016;Huang et al. 2004). Interestingly, these effects were reversed or significantly improved by replacing up to 20% of lard in the diet with shrimp oil. As the total fat content in each diet was identical, the improvements in glucose intolerance, insulin and leptin resistance are considered to be a result of the components of shrimp oil that are different from lard.
The improvement of oral glucose intolerance by shrimp oil was demonstrated by the results of 2 separate OGTTs, which are com-monly used in both animal and human studies to evaluate glucose tolerance (Wang et al. 2015). The insulin resistance test further demonstrated that the impaired oral glucose tolerance was, at least in part, a result of a reduced response to insulin. This notion was supported by HOMA-IR index, which has been increasingly used to assess insulin resistance (Matthews et al. 1985;Singh and Saxena 2010). This index was substantially elevated in rats fed the high-fat diet but improved with shrimp oil in a dose-dependent manner, becoming normal when 20% lard was replaced with shrimp oil. Blood concentrations of insulin and leptin are impor-tant biomarkers of obesity and diabetes and vice versa (Considine et al. 1996;Koch et al. 2014;Wilcox 2005). Rats on the HFC diet and
Table 4.Effect of shrimp oil supplementation on serum hemoglobin A1c, insulin, leptin, adiponectin, fasting glucose, lipids, and insulin resistance index in insulin-resistant rats fed a high-fat diet and fructose drinking water.
LFC HFC SO10 SO15 SO20
Fasting blood glucose (mmol/L) 8.77±0.23 9.30±0.33 9.17±0.29 8.76±0.18 8.63±0.38 Hemoglobin A1c (%) 4.0±0.1 4.6±0.2* 4.1±0.1b 4.1±0.1b 4.0±0.1c
Insulin (ng/mL) 0.59±0.04 0.92±0.08† 0.86±0.08 0.67±0.10 0.48±0.09b
Leptin (pg/mL) 660.1±43.2 1207.9±144.0† 965.6±136.1 950.8±124.3 755.7±104.6a
Adiponectin (g/mL) 10.2±0.6 6.0±0.2‡ 8.6±0.7b 9.1±0.4c 9.6±0.4d
HOMA-IR 5.1±0.4 9.3±0.9‡ 7.8±0.9 6.3±0.9 4.7±0.5a
Free fatty acids (mmol/mL) 0.35±0.05 0.72±0.13* 0.64±0.15 0.53±0.09 0.41±0.05 Total cholesterol (mg/dL) 118±9.4 125.7±7.5 114.7±9.2 108.9±4.3 94.4±7.9a
HDL-cholesterol (mg/dL) 66.9±5.1 29.7±2.8§ 28.5±1.9 28.6±2.0 26.0±2.0
Triacylglycerols (mg/dL) 195.6±22.4 92.1±6.6‡ 88.6±9.5 78.6±7.5 77.0±8.4
Note:The results are presented as means ± SE (n = 11–12). The difference between the HFC and LFC was analyzed
using Student’s t-test. The treatment effect was analysed using 1-way ANOVA and differences among the HFC, SO10, SO15, and SO20 were determined using the least-squares means test adjusted to Tukey. The significance level was set to 0.05. *, p < 0.05;†, p < 0.01;‡, p < 0.001;§, p < 0.0001 compared with LFC; a, p < 0.05; b, p < 0.01; c, p < 0.001; and
d, p < 0.0001 compared with HFC. HDL, high-density lipoprotein; HFC, high-fat control; HOMA-IR, homeostatic model assessment of insulin resistance; LFC, low-fat control; SO10, HFC diet with 10% of lard being replaced with shrimp oil; SO15, HFC diet with 15% of lard being replaced with shrimp oil; SO20, HFC diet with 20% of lard being replaced with shrimp oil.
fructose drinking water had blood insulin and leptin levels twice as high as those on the LFC diet, a hallmark of early stage insulin resistance. The significant reductions of insulin and leptin by 20% replacement of dietary lard for shrimp oil demonstrated again the beneficial effect of shrimp oil on insulin and leptin resistance. These results collectively demonstrated that replacing dietary lard with shrimp oil up to 20% produced significant benefits on insulin function and glycemic control.
Adiponectin mediates insulin function and glucose homeosta-sis and the circulating levels of adiponectin are negatively associ-ated with body fat mass and insulin resistance (Jung and Choi 2014;Yamauchi et al. 2001). In line with previous reports, the serum concentration of adiponectin was markedly reduced in rats given the high-fat diet and fructose drinking water but this effect was abolished by replacing up to 20% of dietary lard with shrimp oil in a dose-dependent manner. Adiponectin stimulates fatty acid oxidation by a sequential activation of adenosine monophosphate-activated protein kinase, P38 mitogen-monophosphate-activated protein kinase, and peroxisome proliferator-activated receptor alpha (Yoon et al.
2006), leading to the reduction of the circulating free fatty acids. Therefore, the blood concentrations of adiponectin and free fatty acids change reciprocally as observed in the present study.
HbA1c is another well-established biomarker of insulin resis-tance and widely used in the diagnosis of diabetes and evaluating the effectiveness of therapies for diabetes (Lee et al. 2014;Lorenzo et al. 2010;Singh and Saxena 2010). The blood concentration of HbA1c increases in humans and animals with insulin resistance and diabetes and decreases with improvement of disease condi-tions (Konda et al. 2014;Li et al. 2016;Yanni et al. 2016). The dose-dependent reductions of the serum HbA1c by replacing di-etary lard with shrimp oil further demonstrated the protective effect of shrimp oil on the development of insulin resistance in diet-induced obese rats.
The antidiabetic benefits of shrimp oil might be attributed to its multiple bioactive components. First, shrimp oil had significant amounts of MUFA and n-3 PUFA, which have been reported to be beneficial on glycemic control in rodents and humans (Albert et al. 2014;Madigan et al. 2000;Robbez Masson et al. 2008;Samimi et al. 2015). Replacing dietary saturated fatty acids with MUFA (Riserus et al. 2009) or n-6 linoleic acid with oleic acid (Madigan et al. 2000) improves insulin sensitivity. Dietary supplementation of n-3 PUFA, in particular EPA and DHA, increases the serum concentration of adiponectin in humans and animals (Gray et al. 2013;Sabour et al. 2015). Recent reports demonstrated that replac-ing saturated fatty acids with n-3 PUFA lowers blood glucose and HbA1c levels, HOMA-IR index, and insulin secretion in humans (Imamura et al. 2016;Iwasaki et al. 2012). Second, astaxanthin, vitamin E, and vitamin A in shrimp oil increase antioxidant ca-pacity and reduce oxidative stress (Sadighara et al. 2014). High-fat, high-fructose consumption decreases the body total antioxidant capacity, along with the inactivation of catalase and glutathione peroxidase, leading to an increase of hydrogen peroxide levels that in turn inactivate superoxide dismutase and increase super-oxide anions (Savini et al. 2013). Antioxidants quench free radi-cals, which otherwise result in lipid peroxidation and oxidative stress and consequently, cause peripheral tissue insulin resis-tance and damage of pancreatic -cells (Meydani et al. 1991). Astax-anthin is a strong antioxidant (Ambati et al. 2014) and when purified from shrimp is reported to lower malondialdehyde levels, enhance the activities of superoxide dismutase, catalase, glutathione peroxidase, and glutathione reductase, and increase the ratio of GSH to GSSG in alloxan-induced diabetic rats (Sila et al. 2015). Similar effects were observed in the present study. Vitamins A and E are decreased in diabetes (Valdes-Ramos et al. Fig. 1. Effect of shrimp oil supplementation on oral glucose
tolerance in rats fed a high-fat diet combined with fructose drinking water. The difference between the HFC and LFC was analyzed using repeated-measures t test. The treatment effect was analyzed using 1-way ANOVA with repeated measures and when a significant treatment effect was obtained, differences among the HFC, SO10, SO15, and SO20 were determined by pairwise comparisons using the least-squares means test adjusted to Tukey. Data are
presented as means ± SE. (n = 11–12). (A) The result of oral glucose tolerance test conducted in week 4 of the treatment. (B) The results of oral glucose tolerance test conducted in week 9 of the treatment. HFC, high-fat control; LFC, low-fat control; SO10, HFC diet with 10% of lard being replaced with shrimp oil; SO15, HFC diet with 15% of lard being replaced with shrimp oil; SO20, HFC diet with 20% of lard being replaced with shrimp oil. *, p < 0.05; †, p < 0.01; ‡, p < 0.001; and §, p < 0.0001 as compared with LFC. a, p < 0.05; b, p < 0.01; and c, p < 0.001 as compared with HFC.
6 7 8 9 10 11 12 13 0 30 60 90 120 Blood Glucos e (mmol/L) ‡ ‡ a a c b b b c B 6 7 8 9 10 11 12 0 30 60 90 120 Blood Glucos e (mmol/L) LFC HFC SO10 SO15 SO20 c a A * † § § § § § Time (min)
Table 5.Effect of shrimp oil supplementation on the area under the curve (AUC) of blood glucose levels in the oral glucose tolerance test (OGTT) and insulin tolerance test (ITT) in rats fed a high-fat diet and fructose drinking water.
AUC of OGTT Wk 4 Wk 9 AUC of ITT: wk 10 LFC 2232.1±49.8 2258.2±52.2 1493±58.4 HFC 2552.6±22.0 2663.1±53.9‡ 1847.6±49.7‡ SO10 2508.8±57.2 2567.1±49.5 1653.5±37.6a SO15 2488.6±39.6 2373.8±77.8a 1583.5±38.2c SO20 2373±38.1b 2334.3±65.8b 1540.9±45.3d
Note:The results are presented as means ± SE (n = 11–12). For the
AUC of OGTT, the repeated-measures t test and repeated-measures 1-way ANOVA were used. For the AUC of ITT, difference between the HFC and LFC groups was analyzed using Student’s t test and the treatment effect was analyzed using 1-way ANOVA. Differences among the HFC, SO10, SO15, and SO20 were determined using the least-squares means test adjusted to Tukey. The significance level was set to 0.05.‡, p < 0.001 compared with LFC; a, p < 0.05; b, p < 0.01;
c, p < 0.001; and d, p < 0.0001 compared with HFC. SeeTable 1for definitions of terms.
Pagination not final (cite DOI) / Pagination provisoire (citer le DOI)
6 Appl. Physiol. Nutr. Metab. Vol. 00, 0000
2015), and accordingly the supplementation of shrimp oil may improve the status of these 2 vitamins.
The anti-inflammatory effects of shrimp oil might have pro-vided an additional protection against the development of insulin resistance as chronic inflammation is well-known to be related to obesity and diabetes (Wellen and Hotamisligil 2005). Excess fat storage and acute hyperglycemia release pro-inflammatory cyto-kines into the circulating system, leading to increases of chronic inflammation in the peripheral tissues and development of insu-lin resistance (Johnson et al. 2012). The consumption of the high-fat diet and high-fructose drinking water induced a dramatic increase of the serum concentration of TNF-␣ that was reversed dose-dependently by dietary shrimp oil. This may be attributed to the inhibitory effects of shrimp oil n-3 PUFAs (Siriwardhana et al. 2012;Trebble et al. 2003) and antioxidants (Cordero-Herrera et al. 2015;Fassett and Coombes 2011;Rizvi et al. 2014) on chronic in-flammation.
The increased serum total cholesterol level in the HFC rats was consistent with earlier studies (Akiyama et al. 1996;Nair et al. 2014), indicating that lipid metabolism was altered by high-fat and/or fructose intake. The reduction of serum total cholesterol was probably a result of bile acids sequestration and subsequent excretion from the body (Smit et al. 1991). Furthermore, shrimp oil contained a lower concentration of saturated fatty acids, espe-cially palmitic acid, which promotes synthesis of cholesterol (Fernandez and West 2005).
The anti-diabetic effect of shrimp oil observed in male rats is anticipated in females (Ohta et al. 2014). However, sex differences were observed in the progression and extent of insulin resistance and diabetes (Mauvais-Jarvis 2015). Strain differences also exist, for example, the metabolic effects caused by a high-fat diet seemed to be more pronounced in Wistar than in SD rats (Marques et al. 2016). Another consideration is the amount of shrimp oil required to see similar effects in humans. According to the most
Fig. 2. Effect of shrimp oil supplementation on insulin tolerance in rats fed a high-fat diet combined with fructose drinking water. The difference between the HFC and LFC was analyzed using repeated-measures t test. The treatment effect was analyzed using 1-way ANOVA with repeated measures. When a significant treatment effect was obtained, differences among the HFC, SO10, SO15, and SO20 were determined by pairwise comparisons using the least-squares means test adjusted to Tukey. Data are presented as means ± SE. (n = 11–12). For definitions of terms, seeFig. 1. *, p < 0.05 and ‡, p < 0.001 as compared with LFC. a, p < 0.05; b, p < 0.01; and c, p < 0.001 as compared with HFC.
3.0 3.5 4.0 4.5 5.0 5.5 6.0 6.5 7.0 7.5 0 30 60 90 120
Blood Glucose (mmol/L)
LFC HFC SO10 SO15 SO20 a a c c c b a a ‡ ‡ ‡ ‡ * b Time (min)
Table 6.Effect of shrimp oil supplementation on serum total antioxidants and proinflammatory biomarkers and liver antioxidant enzymes in rats fed a high-fat diet and fructose drinking water.
LFC HFC SO10 SO15 SO20
Serum total antioxidant in Trolox equivalent (mmol/L) 1.61±0.07 1.58±0.07 1.66±0.08 1.71±0.09 1.87±0.04a
Liver glutathione reductase activity (nmol/(min·mL)) 140.3±13 144.3±8.1 181.7±7.3 177.0±11 186.6±12a
Liver glutathione peroxidase activity (nmol/(min·mL)) 139.0±7.0 148.2±7.2 161.7±7.2 162.2±5.5 168.1±8.0 Liver catalase activity (nmol/(min·mL)) 47.7±1.2 44.9±2.0 50.0±1.0 50.8±1.2a 51.9±1.3b
Liver SOD activity (U/mL) 3.1±0.1 1.7±0.2 2.3±0.2 2.7±0.2a 3.1±0.3b
Liver TBARS (mol/L) 18.1±0.9 20.2±1.5 19.5±1.4 19.4±1.1 18.4±0.7 Liver GSH (mol/L) 37.7±0.9 35.7±0.5 37.7±0.3a 37.9±0.5a 38.5±0.4c Liver GSSG (mol/L) 13.5±1.4 13.6±0.7 12.7±0.9 11.6±0.9 11.5±0.6 Liver GSH:GSSG ratio 2.9±0.3 3.0±0.2 3.3±0.3 3.5±0.3 3.6±0.2 TNF-␣ (pg/mL) 4.2±0.2 37.5±3.2‡ 24.7±1.4c 24.1±1.2c 10.7±1.1d Interleukin-1 (pg/mL) 595.1±12.3 616.6±11.9 608.1±13.2 604.5±11.7 599.5±12.1 MCP-1 (pg/mL) 189.5±4.8 216.7±4.3‡ 195.9±6.6 197.5±11.1 193.1±4.8 Interleukin-6 (pg/mL) 9.5±0.3 10.2±0.4 9.2±0.5 9.1±0.4 8.6±0.3 CRP (g/mL) 2310.1±70.8 2195.1±49.1 2243.9±48.3 2277.2±39.9 2289.9±47.7
Note:The results are presented as means ± SE (n = 11–12). The difference between the HFC and LFC was analyzed using Student’s t test. The treatment
effect was analyzed using 1-way ANOVA and differences among the HFC, SO10, SO15, and SO20 were determined using the least-squares means test adjusted to Tukey. The significance level was set to 0.05. a, p < 0.05; b, p < 0.01; c, p < 0.001; and d, p < 0.0001 compared with HFC.‡, p < 0.001 compared with LFC. CRP, C-reactive protein; GSH, reduced glutathione; GSSG, oxidized glutathione; HFC, high-fat control; LFC, low-fat control; SO10, HFC diet with 10% of lard being replaced with shrimp oil; SO15, HFC diet with 15% of lard being replaced with shrimp oil; SO20, HFC diet with 20% of lard being replaced with shrimp oil; MCP-1, monocyte chemoattractant protein-1; SOD, superoxide dismutase; TNF-␣, tumor necrosis factor-␣; TBARS, thiobarbituric acid reactive substances.
recently published method of dose translation from rodents to humans (Nair and Jacob 2016), a subject who weighs 75 kg would need to consume approximately 13–17 g/day of shrimp oil to achieve similar benefits in glucose homeostasis observed rats with 15%–20% dietary lard being replaced with shrimp oil. The higher dose should be considered for the better effect. However, this may be somewhat of an overestimate. For example, many of the beneficial effects of marine long-chain n-3 PUFA (e.g., EPA and DHA) occur at doses between 1–2 g/day whereas 17 g of shrimp oil would provide over 3 g of EPA and DHA.
Conclusion
Feeding of a high-fat diet and fructose in drinking water to rats rapidly induced obesity and insulin resistance. Replacement of up to 20% of dietary lard with shrimp oil produced substantial im-provements in oral glucose tolerance and insulin and leptin resis-tance, accompanied by the reductions of chronic inflammation and oxidative stress. Shrimp oil supplementation reversed reduc-tions of the adiponectin and increases of free fatty acids in the blood, and decreased blood total cholesterol caused by high-fat diet and fructose drinking water. These effects of shrimp oil sup-plementation occurred in the absence of a change in body weight. Shrimp oil is a promising functional food ingredient for the pre-vention and treatment of insulin resistance and type 2 diabetes.
Author contributions
J.G., J.Z., H.S.E., V.E., and Y.W. conceived the rationale and ob-jectives of the animal study; J.G., C.P., N.T., J.Z., and G.J. contrib-uted shrimp oil, analytical methods, and chemical analysis of shrimp oil. Y.W. designed and supervised the animal experiment. S.N. conducted the animal trial and laboratory analyses of samples. S.N. and Y.W. performed data analysis and manuscript preparation with all others contributing in data interpretation, discussion, and editing.
Conflict of interest statement
The authors declare that there is no conflict of interest.
Acknowledgements
The authors acknowledge financial support from the Atlantic Canada Opportunities Agency through the Atlantic Innovation Fund grant (no. 193594) and from the Natural Health Products program with the Aquatic and Crop Resource Development Port-folio of National Research Council of Canada. The authors thank all members of the Laboratory and Analytical Services team at the Coastal Zones Research Institute (CZRI) for their technical assis-tance. The authors are indebted to Island Fisherman Cooperative Association (IFCA) for providing the shrimp oil. The authors ap-preciate the assistance of Long Ma in the Department of Psychol-ogy and Neuroscience, Dalhousie University, Halifax, Nova Scotia, Canada, in animal necropsy and the support and care of animals provided by technicians in the animal facility of the Atlantic Veterinary College, University of Prince Edward Island, Charlotte-town, Prince Edward Island, Canada, over the course of the exper-iments.
References
Akiyama, T., Tachibana, I., Shirohara, H., Watanabe, N., and Otsuki, M. 1996. High-fat hypercaloric diet induces obesity, glucose intolerance and hyperlip-idemia in normal adult male Wistar rat. Diabetes Res. Clin. Pract. 31(1–3): 27–35. doi:10.1016/0168-8227(96)01205-3. PMID:8792099.
Albert, B.B., Derraik, J.G.B., Brennan, C.M., Biggs, J.B., Smith, G.C., Garg, M.L., et al. 2014. Higher omega-3 index is associated with increased insulin sensi-tivity and more favourable metabolic profile in middle-aged overweight men. Sci. Rep. 4(2014): 6697. doi:10.1038/srep06697. PMID:25331725. Ambati, R.R., Phang, S.M., Ravi, S., and Aswathanarayana, R.G. 2014.
Astaxan-thin: sources, extraction, stability, biological activities and its commercial applications–a review. Mar. Drugs, 12(1): 128–152. doi:10.3390/md12010128. PMID:24402174.
Baik, I., Abbott, R.D., Curb, J.D., and Shin, C. 2010. Intake of fish and n-3 fatty
acids and future risk of metabolic syndrome. J. Am. Diet. Assoc. 110(7): 1018– 1026. doi:10.1016/j.jada.2010.04.013. PMID:20630158.
Considine, R.V., Sinha, M.K., Heiman, M.L., Kriauciunas, A., Stephens, T.W., Nyce, M.R., et al. 1996. Serum immunoreactive-leptin concentrations in normal-weight and obese humans. N. Engl. J. Med. 334(5): 292–295. doi:10. 1056/NEJM199602013340503. PMID:8532024.
Cordero-Herrera, I., Martín, M.Á., Goya, L., and Ramos, S. 2015. Cocoa intake ameliorates hepatic oxidative stress in young Zucker diabetic fatty rats. Food Res. Int. 69(2015): 194–201. doi:10.1016/j.foodres.2014.12.039.
Del Campo, J.A., Rodriguez, H., Moreno, J., Vargas, M.A., Rivas, J., and Guerrero, M.G. 2004. Accumulation of astaxanthin and lutein in Chlorella zofingiensis (Chlorophyta). Appl. Microbiol. Biotechnol. 64(6): 848–854. doi:
10.1007/s00253-003-1510-5. PMID:14689249.
Fassett, R.G., and Coombes, J.S. 2011. Astaxanthin: a potential therapeutic agent in cardiovascular disease. Mar. Drugs, 9(3): 447–465. doi:10.3390/md9030447. PMID:21556169.
Fernandez, M.L., and West, K.L. 2005. Mechanisms by which dietary fatty acids modulate plasma lipids. J. Nutr. 135(9): 2075–2078. PMID:16140878. Geng, S., Zhu, W., Xie, C., Li, X., Wu, J., Liang, Z., et al. 2016. Medium-chain
triglyceride ameliorates insulin resistance and inflammation in high fat diet-induced obese mice. Eur. J. Nutr. 55(3): 931–940. doi: 10.1007/s00394-015-0907-0. PMID:25911003.
Gray, B., Steyn, F., Davies, P.S., and Vitetta, L. 2013. Omega-3 fatty acids: a review of the effects on adiponectin and leptin and potential implications for obe-sity management. Eur. J. Clin. Nutr. 67(12): 1234–1242. doi:10.1038/ejcn.2013. 197. PMID:24129365.
Hill, J.O., Wyatt, H.R., and Peters, J.C. 2012. Energy balance and obesity. Circulation,
126(1): 126–132. doi:10.1161/CIRCULATIONAHA.111.087213. PMID:22753534. Hosomi, R., Yoshida, M., and Fukunaga, K. 2012. Seafood consumption and
com-ponents for health. Glob. J. Health Sci. 4(3): 72–86. doi:10.5539/gjhs.v4n3p72. PMID:22980234.
Huang, B.W., Chiang, M.T., Yao, H.T., and Chiang, W. 2004. The effect of high-fat and high-fructose diets on glucose tolerance and plasma lipid and leptin levels in rats. Diabetes Obes. Metab. 6(2): 120–126. doi:10.1111/j.1462-8902.2004. 00323.x. PMID:14746577.
Imamura, F., Micha, R., Wu, J.H., de Oliveira Otto, M.C., Otite, F.O., Abioye, A.I., et al. 2016. Effects of saturated fat, polyunsaturated fat, monounsaturated fat, and carbohydrate on glucose-insulin homeostasis: a systematic review and meta-analysis of randomised controlled feeding trials. PLoS Med. 13(7): e1002087. doi:10.1371/journal.pmed.1002087. PMID:27434027.
Iwasaki, M., Hoshian, F., Tsuji, T., Hirose, N., Matsumoto, T., Kitatani, N., et al. 2012. Predicting efficacy of dipeptidyl peptidase-4 inhibitors in patients with type 2 diabetes: Association of glycated hemoglobin reduction with serum eicosapentaenoic acid and docosahexaenoic acid levels. J. Diabetes Invest.
3(5): 464–467. doi:10.1111/j.2040-1124.2012.00214.x. PMID:24843607. Jakicic, J.M. 2009. The effect of physical activity on body weight. Obesity (Silver
Spring), 17(Suppl 3): S34–S38. doi:10.1038/oby.2009.386. PMID:19927144. Johnson, A.R., Milner, J.J., and Makowski, L. 2012. The inflammation highway:
metabolism accelerates inflammatory traffic in obesity. Immunol. Rev.
249(1): 218–238. doi:10.1111/j.1600-065X.2012.01151.x. PMID:22889225. Jung, U.J., and Choi, M.S. 2014. Obesity and its metabolic complications: the role
of adipokines and the relationship between obesity, inflammation, insulin resistance, dyslipidemia and nonalcoholic fatty liver disease. Int. J. Mol. Sci.
15(4): 6184–6223. doi:10.3390/ijms15046184. PMID:24733068.
Kim, Y.S., Xun, P., and He, K. 2015. Fish consumption, long-chain omega-3 poly-unsaturated fatty acid intake and risk of metabolic syndrome: a meta-analysis. Nutrients, 7(4): 2085–2100. doi:10.3390/nu7042085. PMID:25811108. Koch, C.E., Lowe, C., Pretz, D., Steger, J., Williams, L.M., and Tups, A. 2014. High-fat diet induces leptin resistance in leptin-deficient mice. J. Neuroendo-crinol. 26(2): 58–67. doi:10.1111/jne.12131. PMID:24382295.
Konda, V.R., Desai, A., Darland, G., Grayson, N., and Bland, J.S. 2014. KDT501, a derivative from hops, normalizes glucose metabolism and body weight in rodent models of diabetes. PLoS ONE, 9(1): e87848. doi:10.1371/journal.pone. 0087848. PMID:24498211.
Larsen, R., Eilertsen, K.-E., and Elvevoll, E.O. 2011. Health benefits of marine foods and ingredients. Biotechnol. Adv. 29(5): 508–518. doi:10.1016/j.biotechadv. 2011.05.017. PMID:21683131.
Lee, K.H., Ha, K.S., Jo, S.H., Lee, C.M., Kim, Y.C., Chung, K.H., and Kwon, Y.I. 2014. Effect of long-term dietary arginyl-fructose (AF) on hyperglycemia and HbA1c in diabetic db/db mice. Int. J. Mol. Sci. 15(5): 8352–8359. doi:10.3390/ ijms15058352. PMID:24823880.
Li, X., Cai, X., Ma, X., Jing, L., Gu, J., Bao, L., et al. 2016. Short- and long-term effects of wholegrain oat intake on weight management and glucolipid me-tabolism in overweight type-2 diabetics: a randomized control trial. Nutri-ents, 8(9): 549. doi:10.3390/nu8090549. PMID:27618090.
Lombardo, Y.B., and Chicco, A.G. 2006. Effects of dietary polyunsaturated n-3 fatty acids on dyslipidemia and insulin resistance in rodents and humans. A review. J. Nutr. Biochem. 17(1): 1–13. doi:10.1016/j.jnutbio.2005.08.002. PMID:
16214332.
Lorenzo, C., Wagenknecht, L.E., Hanley, A.J.G., Rewers, M.J., Karter, A.J., and Haffner, S.M. 2010. Hemoglobin A1c between 5.7 and 6.4% as a marker for identifying pre-diabetes, insulin sensitivity and secretion, and cardiovascular
Pagination not final (cite DOI) / Pagination provisoire (citer le DOI)
8 Appl. Physiol. Nutr. Metab. Vol. 00, 0000
risk factors: The Insulin Resistance Atherosclerosis Study (IRAS). Diabetes Care, 33(9): 2104–2109. doi:10.2337/dc10-0679. PMID:20573754.
Madigan, C., Ryan, M., Owens, D., Collins, P., and Tomkin, G.H. 2000. Dietary unsaturated fatty acids in type 2 diabetes: higher levels of postprandial lipo-protein on a linoleic acid-rich sunflower oil diet compared with an oleic acid-rich olive oil diet. Diabetes Care, 23(10): 1472–1477. doi:10.2337/diacare. 23.10.1472. PMID:11023139.
Marques, C., Meireles, M., Norberto, S., Leite, J., Freitas, J., Pestana, D., et al. 2016. High-fat diet-induced obesity Rat model: a comparison between Wistar and Sprague-Dawley rats. Adipocyte, 5(1): 11–21. doi:10.1080/21623945.2015. 1061723. PMID:27144092.
Matthews, D.R., Hosker, J.P., Rudenski, A.S., Naylor, B.A., Treacher, D.F., and Turner, R.C. 1985. Homeostasis model assessment: insulin resistance and beta-cell function from fasting plasma glucose and insulin concentrations in man. Diabetologia, 28(7): 412–419. doi:10.1007/BF00280883. PMID:3899825. Mauvais-Jarvis, F. 2015. Sex differences in metabolic homeostasis, diabetes, and
obesity. Biol. Sex Differ. 6: 14. doi:10.1186/s13293-015-0033-y. PMID:26339468. Meydani, M., Natiello, F., Goldin, B., Free, N., Woods, M., Schaefer, E., et al. 1991. Effect of long-term fish oil supplementation on vitamin E status and lipid peroxidation in women. J. Nutr. 121(4): 484–491. PMID:1826131.
Mirmiran, P., Bahadoran, Z., and Azizi, F. 2014. Functional foods-based diet as a novel dietary approach for management of type 2 diabetes and its complica-tions: a review. World J. Diabetes, 5(3): 267–281. doi:10.4239/wjd.v5.i3.267. PMID:24936248.
Nair, A.B., and Jacob, S. 2016. A simple practice guide for dose conversion be-tween animals and human. J. Basic. Clin. Pharm. 7(2): 27–31. doi: 10.4103/0976-0105.177703. PMID:27057123.
Nair, S.V., Zhang, J., and Wang, Y. 2014. Ethanol extract of Liuwei Dihuang reduces weight gain and visceral fat in obese-prone CD rats fed a high-fat diet. Exp. Biol. Med. (Maywood), 239(5): 552–558. doi:10.1177/1535370214525313. PMID:24603076.
Nettleton, J.A., and Katz, R. 2005. n-3 long-chain polyunsaturated fatty acids in type 2 diabetes: a review. J. Am. Diet. Assoc. 105(3): 428–440. doi:10.1016/j. jada.2004.11.029. PMID:15746832.
Ohta, T., Katsuda, Y., Miyajima, K., Sasase, T., Kimura, S., Tong, B., and Yamada, T. 2014. Gender differences in metabolic disorders and related dis-eases in spontaneously diabetic Torii-Leprfarats. J. Diabetes Res. 2014(2014):
841957. doi:10.1155/2014/841957. PMID:24892034.
Patel, P.S., Sharp, S.J., Luben, R.N., Khaw, K.T., Bingham, S.A., Wareham, N.J., and Forouhi, N.G. 2009. Association between type of dietary fish and seafood intake and the risk of incident type 2 diabetes: the European prospective investigation of cancer (EPIC)-Norfolk cohort study. Diabetes Care, 32(10): 1857–1863. doi:10.2337/dc09-0116. PMID:19592633.
Popkin, B.M., Adair, L.S., and Ng, S.W. 2012. Global nutrition transition and the pandemic of obesity in developing countries. Nutr. Rev. 70(1): 3–21. doi:10. 1111/j.1753-4887.2011.00456.x. PMID:22221213.
Pryor, W.A. 1991. The antioxidant nutrients and disease prevention–what do we know and what do we need to find out? Am. J. Clin. Nutr. 53(1 Suppl.): 391S–393S. PMID:1985418.
Ramel, A., Martinéz, A., Kiely, M., Morais, G., Bandarra, N.M., and Thorsdottir, I. 2008. Beneficial effects of long-chain n-3 fatty acids included in an energy-restricted diet on insulin resistance in overweight and obese European young adults. Diabetologia, 51(7): 1261–1268. doi:10.1007/s00125-008-1035-7. PMID:
18491071.
Riserus, U., Willett, W.C., and Hu, F.B. 2009. Dietary fats and prevention of type 2 diabetes. Prog. Lipid Res. 48(1): 44–51. doi:10.1016/j.plipres.2008.10.002. PMID:19032965.
Rizvi, S., Raza, S.T., Ahmed, F., Ahmad, A., Abbas, S., and Mahdi, F. 2014. The role of vitamin E in human health and some diseases. Sultan Qaboos Univ. Med. J.
14(2): e157–e165. PMID:24790736.
Robbez Masson, V., Lucas, A., Gueugneau, A.-M., Macaire, J.-P., Paul, J.-L., Grynberg, A., and Rousseau, D. 2008. Long-Chain (n-3) Polyunsaturated fatty acids prevent metabolic and vascular disorders in fructose-fed rats. J. Nutr.
138(10): 1915–1922. PMID:18806101.
Ross, R. 2003. Does exercise without weight loss improve insulin sensitivity? Diabetes Care, 26(3): 944–945. doi:10.2337/diacare.26.3.944. PMID:12610063. Sabour, H., Norouzi Javidan, A., Latifi, S., Shidfar, F., Heshmat, R., Emami Razavi, S.H., et al. 2015. Omega-3 fatty acids’ effect on leptin and adiponectin concentrations in patients with spinal cord injury: a double-blinded randomized clinical trial. J. Spinal Cord Med. 38(5): 599–606. doi:10. 1179/2045772314Y.0000000251. PMID:25096818.
Sadighara, P., Saatloo, N.V., Omid, N.J., and Araghi, A. 2014. Shrimp waste oil: a natural supplement of resistance carotenoids against oxidation. Pharmaco-logia, 5(2014): 107–109. doi:10.5567/pharmacologia.2014.107.109.
Samimi, M., Jamilian, M., Asemi, Z., and Esmaillzadeh, A. 2015. Effects of
omega-3 fatty acid supplementation on insulin metabolism and lipid profiles in gestational diabetes: Randomized, double-blind, placebo-controlled trial. Clin. Nutr. 34(3): 388–393. doi:10.1016/j.clnu.2014.06.005. PMID:24973862. Savini, I., Catani, M.V., Evangelista, D., Gasperi, V., and Avigliano, L. 2013.
Obesity-associated oxidative stress: strategies finalized to improve redox state. Int. J. Mol. Sci. 14(5): 10497–10538. doi:10.3390/ijms140510497. PMID:
23698776.
Sila, A., Ghlissi, Z., Kamoun, Z., Makni, M., Nasri, M., Bougatef, A., and Sahnoun, Z. 2015. Astaxanthin from shrimp by-products ameliorates ne-phropathy in diabetic rats. Eur. J. Nutr. 54(2): 301–307. doi: 10.1007/s00394-014-0711-2. PMID:24821271.
Singh, B., and Saxena, A. 2010. Surrogate markers of insulin resistance: a review. World J. Diabetes, 1(2): 36–47. doi:10.4239/wjd.v1.i2.36. PMID:21537426. Siriwardhana, N., Kalupahana, N.S., and Moustaid-Moussa, N. 2012. Health
benefits of n-3 polyunsaturated fatty acids: eicosapentaenoic acid and doco-sahexaenoic acid. Adv. Food Nutr. Res. 65(2012): 211–222. doi: 10.1016/B978-0-12-416003-3.00013-5. PMID:22361189.
Smit, M.J., Temmerman, A.M., Wolters, H., Kuipers, F., Beynen, A.C., and Vonk, R.J. 1991. Dietary fish oil-induced changes in intrahepatic cholesterol transport and bile acid synthesis in rats. J. Clin. Invest. 88(3): 943–951. doi:10. 1172/JCI115397. PMID:1885779.
Stranahan, A.M., Norman, E.D., Lee, K., Cutler, R.G., Telljohann, R.S., Egan, J.M., and Mattson, M.P. 2008. Diet-induced insulin resistance impairs hippocampal synaptic plasticity and cognition in middle-aged rats. Hippocampus, 18(11): 1085–1088. doi:10.1002/hipo.20470. PMID:18651634.
Subramanian, B., Thibault, M.H., Djaoued, Y., Pelletier, C., Touaibia, M., and Tchoukanova, N. 2015. Chromatographic, NMR and vibrational spectroscopic investigations of astaxanthin esters: application to “Astaxanthin-rich shrimp oil” obtained from processing of Nordic shrimps. Analyst, 140(21): 7423–7433. doi:10.1039/C5AN01261A. PMID:26393239.
Swanson, D., Block, R., and Mousa, S.A. 2012. Omega-3 fatty acids EPA and DHA: health benefits throughout life. Adv. Nutr. 3(1): 1–7. doi:10.3945/an.111.000893. PMID:22332096.
Trebble, T., Arden, N.K., Stroud, M.A., Wootton, S.A., Burdge, G.C., Miles, E.A., et al. 2003. Inhibition of tumour necrosis factor-alpha and interleukin 6 production by mononuclear cells following dietary fish-oil supplementation in healthy men and response to antioxidant co-supplementation. Br. J. Nutr.
90(2): 405–412. doi:10.1079/BJN2003892. PMID:12908901.
Valdes-Ramos, R., Guadarrama-Lopez, A.L., Martinez-Carrillo, B.E., and Benitez-Arciniega, A.D. 2015. Vitamins and type 2 diabetes mellitus. Endocr. Metab. Immune Disord. Drug Targets, 15(1): 54–63. doi:10.2174/1871530314666141111103217. PMID:25388747.
Vincent, H.K., Bourguignon, C.M., Weltman, A.L., Vincent, K.R., Barrett, E., Innes, K.E., and Taylor, A.G. 2009. Effects of antioxidant supplementation on insulin sensitivity, endothelial adhesion molecules, and oxidative stress in normal-weight and overweight young adults. Metabolism, 58(2): 254–262. doi:10.1016/j.metabol.2008.09.022. PMID:19154960.
Wang, Y., Yi, X., Ghanam, K., Zhang, S., Zhao, T., and Zhu, X. 2014. Berberine decreases cholesterol levels in rats through multiple mechanisms, including inhibition of cholesterol absorption. Metabolism, 63(9): 1167–1177. doi:10.1016/ j.metabol.2014.05.013. PMID:25002181.
Wang, Y., Fofana, B., Roy, M., Ghose, K., Yao, X., Nixon, M., et al 2015. Flaxseed lignan secoisolariciresinol diglucoside improves insulin sensitivity through upregulation of GLUT4 expression in diet-induced obese mice. J. Funct. Foods, 18(Part A): 1–9. doi:10.1016/j.jff.2015.06.053.
Wellen, K.E., and Hotamisligil, G.S. 2005. Inflammation, stress, and diabetes. J. Clin. Invest. 115(5): 1111–1119. doi:10.1172/JCI25102. PMID:15864338. Wilcox, G. 2005. Insulin and insulin resistance. Clin. Biochem. Rev. 26(2): 19–39.
PMID:16278749.
Yamauchi, T., Kamon, J., Waki, H., Terauchi, Y., Kubota, N., Hara, K., et al. 2001. The fat-derived hormone adiponectin reverses insulin resistance associated with both lipoatrophy and obesity. Nat. Med. 7(8): 941–946. doi:10.1038/90984. PMID:11479627.
Yanni, A.E., Stamataki, N.S., Konstantopoulos, P., Stoupaki, M., Abeliatis, A., Nikolakea, I., et al. 2016. Controlling type-2 diabetes by inclusion of Cr-enriched yeast bread in the daily dietary pattern: a randomized clinical trial. Eur. J. Nutr. [Epub ahead of print.] doi:10.1007/s00394-016-1315-9. PMID:
27734127.
Yoon, M.J., Lee, G.Y., Chung, J.J., Ahn, Y.H., Hong, S.H., and Kim, J.B. 2006. Adiponectin increases fatty acid oxidation in skeletal muscle cells by sequen-tial activation of AMP-activated protein kinase, p38 mitogen-activated pro-tein kinase, and peroxisome proliferator-activated receptor alpha. Diabetes,
55(9): 2562–2570. doi:10.2337/db05-1322. PMID:16936205.
Yuan, J.P., and Chen, F. 1997. Identification of astaxanthin isomers in Haematococcus
lacustrisby HPLC-photodiode array detection. Biotechnol. Techniques, 11(7): 455–459. doi:10.1023/A:1018441411746.