Publisher’s version / Version de l'éditeur:
Vous avez des questions? Nous pouvons vous aider. Pour communiquer directement avec un auteur, consultez la première page de la revue dans laquelle son article a été publié afin de trouver ses coordonnées. Si vous n’arrivez pas à les repérer, communiquez avec nous à [email protected].
Questions? Contact the NRC Publications Archive team at
[email protected]. If you wish to email the authors directly, please see the first page of the publication for their contact information.
https://publications-cnrc.canada.ca/fra/droits
L’accès à ce site Web et l’utilisation de son contenu sont assujettis aux conditions présentées dans le site LISEZ CES CONDITIONS ATTENTIVEMENT AVANT D’UTILISER CE SITE WEB.
14th International Symposium on Aerodynamics and Ventilation of Tunnels
[Proceedings], pp. 1-14, 2011-05-11
READ THESE TERMS AND CONDITIONS CAREFULLY BEFORE USING THIS WEBSITE.
https://nrc-publications.canada.ca/eng/copyright
NRC Publications Archive Record / Notice des Archives des publications du CNRC :
https://nrc-publications.canada.ca/eng/view/object/?id=e96ebac3-0c6c-4cf8-b4ff-ca9dda9d845c
https://publications-cnrc.canada.ca/fra/voir/objet/?id=e96ebac3-0c6c-4cf8-b4ff-ca9dda9d845c
NRC Publications Archive
Archives des publications du CNRC
This publication could be one of several versions: author’s original, accepted manuscript or the publisher’s version. / La version de cette publication peut être l’une des suivantes : la version prépublication de l’auteur, la version acceptée du manuscrit ou la version de l’éditeur.
Access and use of this website and the material on it are subject to the Terms and Conditions set forth at
Proposed idealized design fire curves for road tunnels
http://www.nrc-cnrc.gc.ca/irc
Propose d ide a lize d de sign fire c urve s for roa d t unne ls
N R C C - 5 4 4 3 2
K a s h e f , A . ; V i e g a s , J . ; M o s , A . ; H a r v e y , N .
M a y 2 0 1 1
A version of this document is published in / Une version de ce document se trouve dans:
14th International Symposium on Aerodynamics and Ventilation of Tunnels
Dundee, Scotland, May 11-13, 2011, pp. 1-14
The material in this document is covered by the provisions of the Copyright Act, by Canadian laws, policies, regulations and international agreements. Such provisions serve to identify the information source and, in specific instances, to prohibit reproduction of materials without written permission. For more information visit http://laws.justice.gc.ca/en/showtdm/cs/C-42
Les renseignements dans ce document sont protégés par la Loi sur le droit d'auteur, par les lois, les politiques et les règlements du Canada et des accords internationaux. Ces dispositions permettent d'identifier la source de l'information et, dans certains cas, d'interdire la copie de documents sans permission écrite. Pour obtenir de plus amples renseignements : http://lois.justice.gc.ca/fr/showtdm/cs/C-42
Proposed Idealized Design Fire Curves for Road
Tunnels
AHMED Kashef1, Joao Viegas2, Antoine Mos3, and Norris Harvey4
1National Research Council of Canada (NRC), 1200 Montréal Road, Bldg. M59,
Ottawa, Ontario K1A 0R6 Canada
2
Laboratório Nacional de Engenharia Civil, Núcleo de Acústica, Iluminação, Componentes e Instalações Av. do Brasil, 101, 1700-066 Lisboa, Portugal
3Centre d’Etudes des Tunnels (CETU), Ventilation and Environment Group, 25
av. F. Mitterrand – Case n°1, 69674 Bron Cedex – France
4
Parsons Brinckerhoff Americas, Inc., One Penn Plaza, New York, NY 10119, USA
1 ABSTRACT
In designing tunnels for fires, the design fire needs to be quantified. Design fires form the base input for emergency ventilation, evacuation, and structural design analyses. A design fire is the idealization of a real fire that may occur in a tunnel. It describes, quantitatively, the characteristics of a particular fire with respect to time and space, e.g. fuel state (solid, liquid, or gas), fuel type and quantity, fuel configuration and location, heat release rate, rate of growth, production rate of combustion products (smoke, CO, CO2, etc.). A design fire is in general defined in terms of heat release rate, and species
output as functions of time. This paper summarizes the efforts to develop a set of idealized design fire curves as a useful tool for road tunnel fire risk assessment. The developed idealized design fire curves include the following phases: (1) incubation phase, (2) growth phase, (3) fully-developed phase, and (4) decay phase.
2 INTRODUCTION
To support the use of innovative designs that lead to lower fire protection costs and result in integrated performance of fire protection systems, there is currently a strong tendency to shift from prescriptive to performance-based regulations. Performance-based designs
are usually based upon explicitly stated objectives that allow the freedom to develop innovative designs satisfying these objectives. Such innovative designs often lead to lower fire protection costs. The performance-based design approach can be used to new and existing tunnels to achieve stated fire and life safety objectives, to support the development of alternatives to prescriptive-based code requirements, appraisal of fire protection measures in existing tunnels or to evaluate the tunnel fire safety as a whole. An important step in the performance-based design is the establishment and analysis of possible fire events or scenarios. The design fire curves are the cornerstone for all aspects of tunnel safety design and are indispensable in conducting a performance-based design. Design fires form the base input for emergency ventilation, egress, structural, and fire safety tunnel equipment (e.g. detection and fixed fire fighting systems) design analyses.
A design fire is an idealisation of a real fire that might occur in a tunnel. It is a set of data that provides the actual fire characteristics such as, ignition sources, nature and configuration of the fuel, fire growth, peak heat release, production rates of combustion products (smoke CO, CO2, etc.) and extinction. For the design purposes, it is necessary
to choose a typical design fire corresponding to the traffic type and pattern in the tunnel and whether hazardous transports are permitted.
Different aspects of a design fire are more important to certain types of analysis than others. For example, the peak heat release and burning duration are important to evaluating structural response to fire. The peak heat release rate (HRR) is a consideration in evaluating tunnel ventilation equipment. The early transient stages of fire development during the growth phase are important to life safety analyses.
A design fire scenario is the qualitative description of key time events following the ignition of a fire, considering all associated conditions that will impact on the course of the fire. These conditions include: quantity and characteristics of combustible materials, material arrangement and location, tunnel geometry, environment, fire protection systems, etc. As such a fire scenario represents one possible outcome of a fire incident. This paper summarizes the efforts to develop a set of idealized design fire curves as a useful tool for road tunnel fire risk assessment. The data from major international experimental programs, such as The Eureka-project EU499 – FIRETUN Project in Europe and the Memorial Tunnel Tests in the United States, are compiled and analyzed to develop a set of idealized design fire curves for different possible fire loads in road tunnels. The fire loads include: passenger cars, buses, heavy goods vehicles and pool fires. The developed idealized design fire curves include the following phases: (1) incubation phase, (2) growth phase, (3) fully-developed phase, and (4) decay phase.
3 PARAMETERS AFFECTING FIRE CHARACTERISTICS
Experience from full scale fire tests show some specific correlation between some of the characteristics apparent in a tunnel and the fire characteristics, such as:
• Correlation between the total released energy and the peak HRR, • Impact of air velocity in the tunnel on fire growth and peak HRR,
• Impact of the fuel blocking to the cross section ratio on the tunnel ventilation efficiency and the fire growth and peak HRR.
3.1 Correlation of the Peak HRR and the Total Released Energy
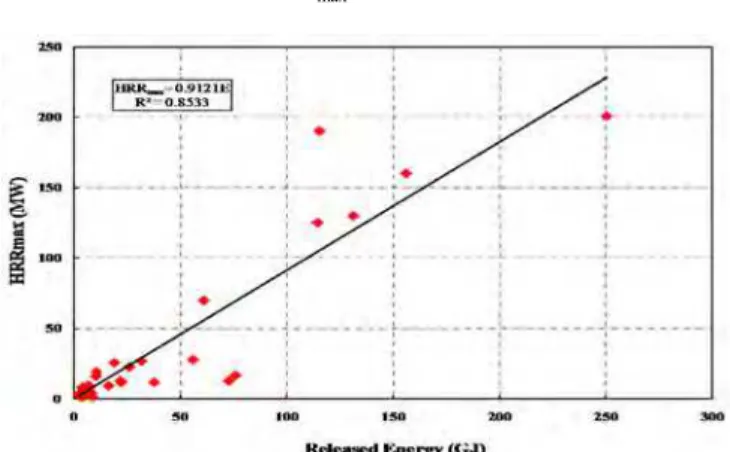
Examining the different tests data from 2nd Benelux tunnel, from tests with higher HRR Eureka tests and from Runehamar tests, it is shown that the released energy correlates well with maximum HRR (Figure 1). Therefore, the equation that relates maximum HRR (HRRmax) in MW with released energy (E) in MJ for well ventilated fire is:
HRRmax ≈ 0.0009 E
Figure 1. Maximum HRR versus total released energy 3.2 Air Velocity and Fire Growth/Peak HRR
Fire growth, for open fires, shows a substantial increase in conditions of higher air velocity. This is also in line with what could be expected, since it is well known that air forced over a fire increases the burning rate. However fires in enclosed vehicles, where the air velocity is not able to contact the fire centre, do not behave in the same way as for open fires.
The fire test in the Benelux tunnel indicated a fire growth twice as fast with forced air velocity of 4-6 m/s compared with the fire growth rate without ventilation. The same test showed about 1.5 times higher peak HRR at an air velocity of 4-6 m/s than without ventilation. The increase in fire growth when increasing the air velocity can be estimated to be about 3.5 – 5.5 times higher if the air velocity is increased from zero up to 4-6 m/s. In the Benelux test 9, the increase in fire growth rate was about 5.5 and in test 10 about 3.5. A study comparing results from full scale tests with small scale test verify that the impact of air velocity on the fire growth almost follows a linear correlation (1).
The impact of air velocity on the peak HRR is also demonstrated in the EUREKA fire test on Heavy Goods Vehicle with varying ventilation condition, 6 m/s, 0 m/s and 3 m/s. The HRR was reduced from 120 MW at a forced air velocity of 6 m/s to nearly 42 MW without forced ventilation, i.e. a factor of three. When the fan was restarted with an air velocity of about 3 m/s, the HRR increased rapidly up to about 128 MW.
3.3 Tunnel Cross-Section Characteristics and Peak HRR
Tunnel section characteristics, such as ceiling height and cross sectional area, greatly influence the fire development in terms of growth rate and HRR. Therefore, the impact
of these characteristics on the fire growth and fire size should be considered in the assessment of test results.
In the Runehamar, Test 1 the rock tunnel cross section area was about 50 m2. At the location of the fire an additional inner tunnel was set up to function as protection of the rock tunnel. That inner tunnel cross section area was about 32 m2. In that section, stacks of wood and plastic pallets, simulating a loaded truck, were placed. The simulated truck covered an area of approximately 12 m2. The space around the simulated truck was
therefore quite narrow which resulted in an air velocity in excess of 6 m/s around the burning truck in the early phase of the fire which probably increased the fire growth characteristics substantially.
The distribution of the fire load is also likely to influence the test results. The Runehamar Test 1 exceeded higher HRRs than the EUREKA HGV’s 100-120 MW, but it is important to consider that the test setup with wood and plastic pallets was extraordinarily well ventilated due to the free air flow through the open pallets and accordingly gave an ideal combustion situation. The Runehamar Test 3 with upholstered furniture, fixtures, plastic and wood cabin doors and rubber tyres showed that fire development in an early phase was faster but did not reach the high HRR as Test 1 although the fire load was almost the same. The most significant difference between these two tests was the shape of the combustible material and the exposed surface area accessible for oxygen and burning. A more compact set up of fire load leads to less surface area per kg of combustible material and accordingly a lower HRR.
Carvel et al (1) investigated which geometrical factor (e.g. width, height, aspect ratio, blockage ratio, etc.) has the most significant influence on the enhancement of the HRR. They suggested that the width of a tunnel had significantly more influence over the degree of HRR enhancement than any other geometrical factor.
4 IDEALIZATION METHODOLOGY
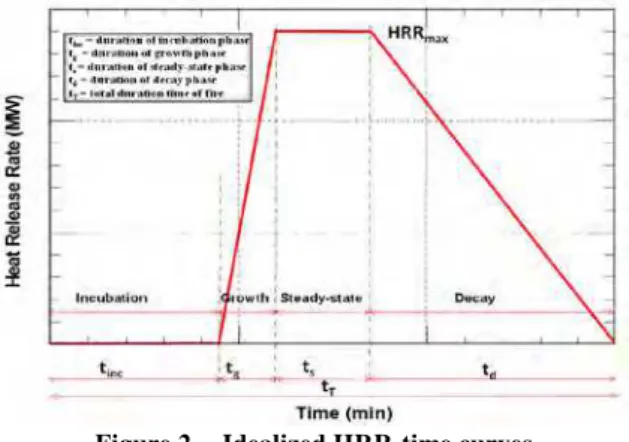
The main objective of this paper is to develop a set of idealized design fire curves as a useful tool for road tunnel fire risk assessment. The proposed idealized HRR plateau is characterized by four regions: incubation, fire growth, steady-state, and decay. Figure 2 shows a schematic of the proposed idealized HRR curve where: tinc is the time from
ignition until the fire is producing flame (smouldering region); tg is the time from end of incubation to maximum heat release (fire growth region); ts is the duration time of the
steady-state region; td is the time from the start of the decay to the end of it (decay
region); and tT is the duration time of the fire from ignition.
In this representation, the fire initially smolders for a period of time after ignition. At the end of this period, known as the “incubation” or “smouldering” phase, the fire will spread and rapidly grow. This period is known as the “fire growth” phase. At the end of the growth phase, the fire will sustain a peak HRR at the end of which the fire will decay and eventually extinguish for a lack of fuel.
In developing these idealized curves, some constraints or criteria were respected. The total energy released, growth rate, and decay rate of the idealized curves were approximately maintained the same as of the experimental data. The idealized HRR is generally not very different from the real peak HRR in realistic fires (by 12% maximum).
However, special considerations should be given to whether the experimental setup is a representative of actual road traffic.
Figure 2. Idealized HRR-time curves
In the idealized curves, the incubation time has to be as close to reality as possible. The duration of this phase is very important for the choice of early detection device. During this time, the users' safety is not really threatened, so overestimating (or underestimating) it could result in overly optimistic (or pessimistic) results of evacuation studies. The growth rate of the fire is another key parameter for the evacuation of users and intervention of the emergency services, so it also has to be accurately selected.
Adequate definition of the fire resistance objectives and intervention planning requires a good estimate of the total fire duration and total energy released. From these constraints, one can derive an average HRR during the fully developed fire phase. This value is relevant for the sizing of ventilation systems and the assessment of intervention conditions. The instantaneous peak HRR does not affect significantly the performance of ventilation systems due to their short duration periods.
5 EXPERIMENTAL DATA
One of the most important characteristic of the fire phenomenon and central in ensuring tunnel safety is the HRR. The HRR is strongly interrelated to other parameters, e.g. temperature, smoke production, radiation, fire spread, fire severity, flame profile. The main parameters influencing the HRR are probably ventilation, thermal insulation and tunnel geometry. However, there is limited data available regarding the magnitude and severity of vehicle design fires. Most of the information available is based on the relatively little experimental data available due to the high costs involved in full scale tunnel tests. The limited information available, in the absence of more specific data, provides first-order guidance in the selection of an appropriate design fire for the evaluation of a tunnel. The PIARC report (2) and NFPA 502 (3) provide summaries of vehicle fire tests.
Four major test programs were analyzed in this paper in an effort to deduce representative design fires. These tests are: EUREKA 499-project, Benelux Tunnel Tests, Runehamar Tests, and Memorial Tunnel Fire tests. In addition, the database of full-scale motor vehicle fire tests was also examined.
5.1 EUREKA 499-project
In the Eureka-project EU499 (4) full-scale tests were conducted in the unused Repparfjord Tunnel in Norway (Figure 3). The tunnel ceiling and walls in the immediate vicinity of the fire load (260 m – 345 m) were lined with a steel-fibre reinforced light-weight shotcrete. The test program consisted of 20 full-scale fire tests with different fuel sources and loads, including: wood cribs (WC), Heptane pools (HP), public bus (PB), passenger car (PC), plastic vehicle (PV), Lorry load mixed fuel (MF: wood, tyres, and plastic), and heavy goods vehicles (HGV). Extensive instrumentation was used to measure gas temperature, velocity profiles, heat fluxes, smoke obscuration, and gas composition at various distances in both directions from the location of the fire. Several approaches were used to determine the HRR of the burning object based on the available temperature, velocity, mass loss, and gas composition data. Table 1 summarises the information on the tests conducted. Figure 4 shows the measured HRR versus time for the Eureka-project tests.
Figure 3. Repparfjord Tunnel (Norway) Table 1. EUREKA Test Summary Tunnel
Geometry Fire Load
Test Parameters Measurements Length: 2.3 km Slope: Cross-section: 1% N-S Area = 34 m2 (±4 m2) Horse-shoe rock cross-section with flattened ceiling and concrete floor Humidity: 80-95% Blockage ratio: WC: 2.4/5.5 = 0.44 HP: 0.3/5.5 = 0.05 PC: 1.45/5.5 = 0.26 PB: 3.2/5.5 = 0.58 HGV: 4.25/5.5 = 0.77 PV: 2.0/5.5 = 0.40 MF: 2.4/5.5 = 0.44 Arrangement: Ambient conditions: at centre of tunnel cross-section 295 m from north portal. Prevailing wind in the N-S and S-N directions in winter and summer, respectively. Air velocity (m/s): WC: 0.3-2.2 HP: 0.6-2.5 PC: 0.3 PB: 0.3 HGV: 3.4 – 6.8 PV: 0.5 MF: 0.5 Temperature: 1 plate-type thermometer 355 TC on/in the fire, on the walls, cross-section
Radiation: 6 pyrometers Air velocity: 76 bi-directional probes and anemometers Smoke: Gases analyzers: 24 34 Opacimeters and 6 optical density Mass loss: weighing platforms
Observations: 13 videos cameras
Figure 4. Measured total heat release (HRR) 5.2 Benelux Tunnel Tests
The fire tests of the project ‘Safety Test 2001/2002’ were carried out under the auspices of the Centre for Tunnel Safety within the Civil Engineering Division of Rijkswaterstaat (5). The tests were performed in tube D of the 2nd Benelux tunnel near Rotterdam, Netherlands. The cross-section is approximately rectangular, with a width of 9.8 m and a height of 5.1 m. The ceiling was originally protected by an insulating material; extra insulation was added over a length of 75 m around the fire during the tests, on the ceiling, sidewalls and floor. A sand bed was also used to protect the floor and absorb spilt fuel.
The HGV loads were simulated by means of a construction with a synthetic canvas and a stack of loading pallets underneath to achieve a rate of heat release of approximately 20 MW in conformity with that of a small HGV (4.5 m x 2.4 m x 2.5 m). The cargo area consisted of a steel sheet floor with a self-sustaining hood made up of aluminium sheets. The cargo area was loaded with 4 stacks each having 9 wooden Euro-pallets (in total 36 pieces) and a car tyre on top of each stack. The load was ignited by lighting two small
bowls of petrol which were placed in the middle of the cargo floor between the wooden stacks.
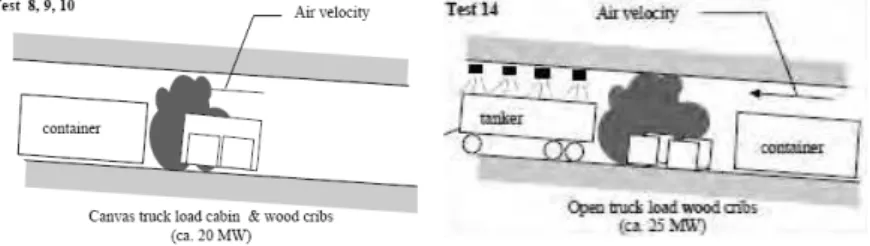
In order to realise a maximum rate of heat release of approximately 40 MW, an additional test (Test 14) comprised in total 72 pallets were conducted. In order to have extra smoke developing, 6 car tyres were added. Schematics of the test setups are given in Figure 5. Test 14 was conducted with almost no longitudinal air flow. The sprinkler system was only activated after 22 minutes in the fire region. Table 2 summarizes the main test conditions and Figure 6 shows the time versus the measured HRR for tests 9, 10, 14.
Figure 5. Benelux Test Setups Table 2. Summary of Benelux Tests Test # Fire load Intended
HRR (MW)
Intended air
velocity (m/s) Ventilation Sprinkler
Effect of wind on HRR 9 Canvas hood, 36 pallets, 4 tyres 20 6 On 10 Canvas hood, 36 pallets, 4 tyres 20 6 On Sprinkler tests 14 72 pallets, 6 tyres 35 0 – 1 Off Delayed activation 5.3 Runehamar Tests
The Runehamar large scale fire tests were conducted in 2003 in an unused tunnel in Norway (6). The 1600 m tunnel had a cross section, at the fire site, of about 9 meters wide and 6 meters high. The area was reduced to about 32 m2 due to the installation of a steel structure which supported the fire protection boards. In total four tests were performed with a fire in a semi-trailer mock-up (10.45 m in length, 2.9 m in width and a total height of 4.5 m). The height of the platform floor was 1.1 m above the road surface. In three tests mixtures of different chosen cellulose and plastic materials were used, and in one test a “real” commodity consisting of furniture and fixtures was used. In all tests the mass ratio was approximately 80% cellulose and 20% plastic. A polyester tarpaulin covered during all tests.
5.4 Memorial Tunnel Fire tests
Other large scale fire tests have been conducted to evaluate the fire and smoke behaviour in tunnels using pool fires. In most of them, measurements showed a clear correlation between the pool surface and maximum HRR. Nevertheless, due to the immediate development of the flashover phase, no interesting findings can be stated on this topic.
One of the most complete large scale fire test campaigns involving pool fires was the Memorial Tunnel (7).
Figure 6. Benelux Tunnel Test Results Table 3. Runehamar Test Data
FIRE LOAD Test 1 Test 2 Test 3 Test 4
Materials Wood pallets (82%) and plastic pallets (18%). (10160 kg) Wood pallets (82%) and PUR mattresses (18%). (6390 kg) Furniture, fixtures and rubber tires.
(8330 kg) Plastic cups in cardboard boxes on wood pallets. (2850kg) Arrangement Incubation period (min) 4.5 2.5 2.0 3.0 Growth time* (min) 18.5 14.1 10 7.4 Maximum HRR value (MW) 201.9 156.6 118.6 66.4 *
Time from developed fire to peak HRR
The Memorial Tunnel Fire Ventilation Test Program consisted of a series of full-scale fire tests conducted in an unused road tunnel. Various tunnel ventilation systems and configurations of such systems were operated to evaluate their respective smoke and temperature management capabilities. These tests generated a significant database relevant to the design and operation of road tunnel ventilation systems under fire emergency conditions. The tunnel is 853-meter-long tunnel originally built in 1953 as part of the West Virginia Turnpike in the USA. Combustion was achieved by burning diesel fuel oil that was floating on water and tests were conducted for HRR in the range 20 to 100 MW. The HRR was measured according to change of weight of the fuel pans corrected for the CO/CO2 ratio.
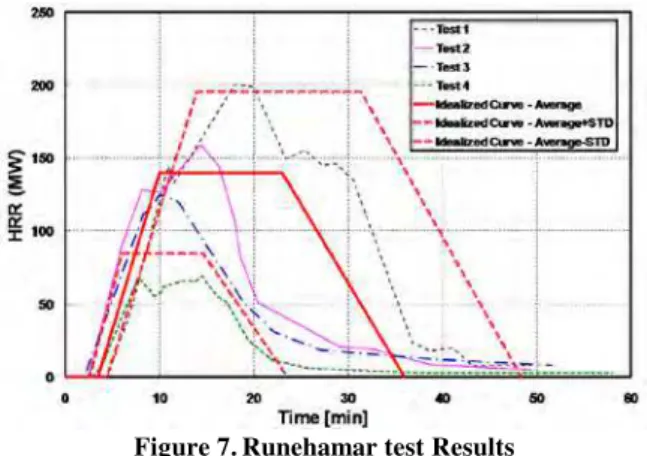
Figure 7. Runehamar test Results
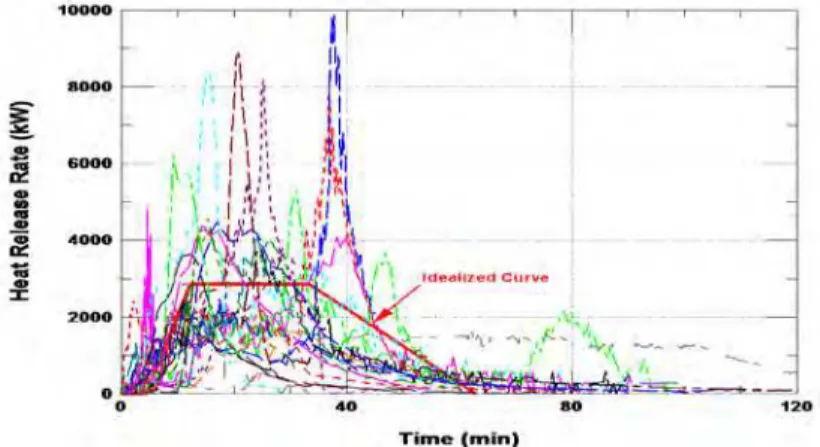
Figure 8 shows a sampling of 12 of the 20 MW tests performed. The sample is shown in order to maintain clarity in the chart. The time of incubation once the fuel was ignited ranged from 0 s to 110 s. The fire growth period took approximately 100 s and the sustained HRR was maintained (with fluctuations) as long as fuel was supplied. The tests varied widely in terms of when the fuel was shut off, so the decay is not shown.
Figure 8. Memorial tunnel – 20 MW HRR test results 5.5 Personal Vehicles
Janssens (8) reported on the development of a database of full-scale motor vehicle fire test results. The data were obtained from a review of 20 publications involved HRR measurements (a total of 34 tests in 12 studies). The objective of the study was to collect HRR data for motor vehicles and provide recommendations for suitable design fires for performance-based fire design of parking garages and similar structures.
Each test involved a single model vehicle. Vehicles were placed on a load platform under an open oxygen consumption calorimeter, room calorimeter, corner calorimeter, or tunnel. In addition to HRR, mass loss, temperature and heat flux at various locations were measured. The tests were terminated at burnout, i.e., when significant flaming ceased and the HRR returned to a negligible level. HRR measurements were, generally, based on oxygen consumption calorimetry.
A database was developed to facilitate the use of results from full-scale motor vehicle tests for fire engineering. A total of 34 tests were included. The database consists of four interrelated tables. The first table includes important information concerning the vehicle that was tested. The second table includes some important information concerning the laboratory where the test was performed. Important information concerning the publication that can be consulted to obtain more information about the test was presented in the third table. The fourth and the main table provided information concerning the test setup and conditions and the primary results.
Figure 9 shows the temporal changes of measured HRR for all of the 12 series of conducted tests along with the idealized HRR plateau based on the average of all idealized HRR plateaus.
Figure 9. full-scale motor vehicle fire test 6 IDEALIZED CURVES
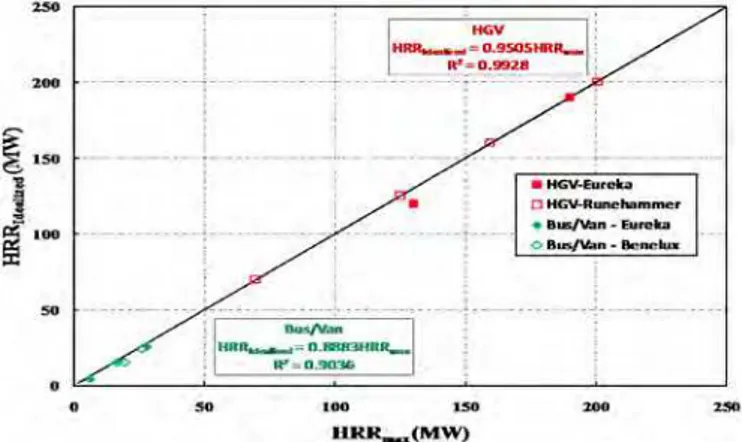
Table 4 presents the different idealization information for different tests examined. The table indicates that the ratio of the total released energy of the tests and idealization was 1.0 for all tests (a constraint of the idealization process). Both Table 4 and Figure 10 and Figure 11 show the correlation between the experimental peak HRR and the idealized HRR for all test programs examined in this study. The table and figures indicate that the correlation is much better (0.8-1.0) for real vehicles or realistic mock-ups than for so-called "controlled" fires such as pool fires.
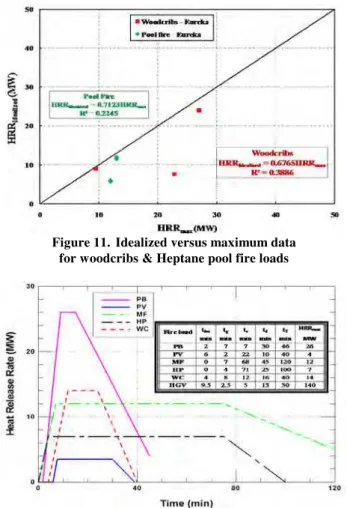
Figure 12 shows the developed idealized HRR curves for each type of fuel load (PB, PV, MF, HGV, HP, and WC) of the Eureka Tests. The figure also includes a table of the proposed values for the duration times of different regions of the curves.
7 CONCLUSIONS AND DISCUSSIONS
Table 5 shows the different events of the proposed idealized fire curves. For every class of fire, the average (AVG) and standard deviation (STD) for the timescales and HRR are calculated. It is suggested to use the average and standard deviation values in combination (average ± standard deviation). The range should reflect the variability of different influencing parameters (mainly the ventilation and load arrangement). The use of the range is adopted in order to avoid retaining spurious values, but still having values close enough to the most unfavourable fire conditions. Figure 7 shows the experimental
and idealized heat release curves for Runehamar tests. The figure shows the range of the proposed values of the HRR.
Table 4. Idealized Data
Test Program Fire Load Test tinc tg tT v HRR ET
Idealization Factor* min min min m/s MW GJ ET HRR
Eureka Wood crib W31 4.0 10 100 0 9 16 1.0 1.0 W41 4.0 17 60 2.5 24 32 1.0 0.9 W51 4.0 16 70 4.5 8 26 1.0 0.3 Heptane H11 0.0 35 100 0.5 6 22 1.0 0.5 H21 0.0 18 120 2 6 38 1.0 0.5 H31 0.0 3 50 0 12 22 1.0 0.9 H41 0.0 3 120 1.5 12 71 1.0 0.9 Cars Plastic (C21) 6.0 8 62 0 4 7 1.0 0.7 Bus (B11) 1.5 10 110 0 26 56 1.0 0.9 Mixed (LF1) 2.0 9 120 0 16 76 1.0 0.9 HGV HGV-GER 7.0 13 80 13 190 115 1.0 1.0 HGV-BR 9.0 13 65 14 120 131 1.0 0.9 Benelux HGV P9 4.0 7 30 6 15 10 1.0 0.8 P10 4.0 7 30 6 15 10 1.0 0.9 P14 6.0 11 29 0 24 19 1.0 0.9 Runehammar HGV Test 1 4.4 16 49 3 201 250 1.0 1.0 Test 2 2.5 8 49 3 160 156 1.1 1.0 Test 3 2.5 8 52 3 125 114 1.0 1.0 Test 4 2.5 8 58 3 70 61 1.0 1.0 *
Idealized value / Experimental value
Figure 10. Idealized versus Maximum data for HGV & Bus/Van fire loads
Figure 11. Idealized versus maximum data for woodcribs & Heptane pool fire loads
Figure 12. Idealized HRR Plateaus for EUREKA Tests Table 5. Experiments Idealized Data Statistics
Test Program Fire Load
tinc tg td tT HRRidealized
min min min min min min min min MW MW AVG STD AVG STD AVG STD AVG STD AVG STD
Eureka Vehicles 5 5 7 4 15 15 64 28 3 1 Wood cribs 4 0 10 4 20 2 44 21 18 8 Heptane 0 0 15 15 17 12 92 33 9 3 Vans/Bus 3 2 6 3 41 26 76 31 15 11 Benelux Vans/Bus 5 1 4 1 9 2 23 0 18 5 Eureka HGV 8 3 4 3 19 7 37 27 120 0 Runehamar HGV 3 1 7 3 13 4 30 4 139 55
8 REFERENCES
1. R.O. Carvel, A.N. Beard & P.W. Jowitt “The influence of longitudinal ventilation and tunnel size on HGV fires in tunnels” Proc. 10th Int. Fire Science & Engineering Conf. (Interflam 2004), Edinburgh, Scotland, 5-7 July 2004, pp. 815-820.
2. PIARC Committee on Road Tunnels, “Fire and Smoke Control in Road Tunnels” PIARC – World Road Association, 1999.
3. National Fire Protection Association, "NFPA 502 Standard for Road Tunnels, Bridges, and Other Limited Access Highways", 2004 Edition, NFPA, Quincy, MA. 4. Haack, A., “Introduction to the Eureka-EU 499 Firetun Project,” in International
Conference on Fires in Tunnels, Swedish National Testing and Research Institute, Borås, Sweden, pp. 3-19, 1994.
5. Dutch Ministry of Transport, Public Works and Water Management, Directorate-General for Public Works and Water Management, Civil Engineering Division, Project "Safety Test" Report on Fire Tests, 2002.
6. Ingason, H. and Lönnermark, A., Large Scale Fire Tests In The Runehamar Tunnel – Heat Release Rate (HRR), at the International Seminar on ‘Catastrophic Tunnel Fires (CTF)’, Borås, Sweden, 20-21 November 2003.
7. Bechtel/Parsons Brinckerhoff, Memorial Tunnel Fire Test Ventilation Program, Comprehensive Test Report, prepared for Massachusetts Highway Department/Federal Highway Administration, 1995.
8. Jensen, J., “Development of a Database of Full-Scale Calorimeter Tests of Motor Vehicle Burns,” Final Report, SwRI Project No. 01.06939.01.003, pp. 99, 2008.