A macroeconomic perspective on the rise of
second-tier cities in the national and
globalizing context of China
Bachelor Project submitted for the obtention of the Bachelor of Science HES in Business Administration with a major in International Management
by Fabien CADEZ
Bachelor Project Advisor: Dr. Philippe Régnier, HEG Professor
Geneva, 29th of May 2015
Haute école de gestion de Genève (HEG-GE) International Business Management
Declaration
This Bachelor Project is submitted as part of the final examination requirements of the Geneva School of Business Administration, for obtaining the Bachelor of Science HES-SO in Business Administration, with major in International Management.
The student accepts the terms of the confidentiality agreement if one has been signed. The use of any conclusions or recommendations made in the Bachelor Project, with no prejudice to their value, engages neither the responsibility of the author, nor the adviser to the Bachelor Project, nor the jury members nor the HEG.
“I attest that I have personally accomplished this work without using any sources other than those cited in the bibliography. Furthermore, I have sent this document by email, to the address supplied by my adviser, for analysis by the plagiarism detection software URKUND (http://www.urkund.com/int/en/student_gorsahar.asp). ”
Geneva, the 29th of May 2015
Fabien Cadez
Acknowledgements
First of all, I would strongly like to thank my advisor Dr. Philippe Régnier for his precious support all around the year. He has clearly been a key element in the construction of this bachelor thesis and I have deeply appreciated his extensive knowledge about Asian emerging economies, including China. I am now twice more passionate about doing business in the East and I hope he will continue to be my mentor in case I undertake some entrepreneurial project in the region!
Of course, I want to share my sincere appreciation to my family, and especially to my mother, Nathalie; my father, Vladimir; and my younger sister, Floriane. These four years of my live have been mentally and physically very intense. Undoubtedly, I would not have been successful without their unconditional encouragement. This is partly for them that I have been continuing to fight.
Last but not least, my girlfriend Viya has recently joined the adventure for my final year. She did not hesitate to help me out when I was facing troubles to find information and data about China, and I am very appreciative for all the support she provided. Of course, I cannot finish this paragraph without acknowledging my best friends Amir and Fathi, who know perfectly where I am coming from and what I am accomplishing today!
Executive Summary
Since China’s economic reforms in the late 1970s, foreign investments have initially flooded the so-called “first-tier cities” including Shanghai, Beijing, or even Shenzhen or Guangzhou. Due to rising labour costs, growing constraints over natural resources, long-term inflation and environmental issues among others (Zhuang et al. 2012; Zuojun, 2012), they have been undertaking structural economic adjustments in order to shift from a “late-developing advantage” to a “first-mover advantage” model. This requires concentrating resources on modern services industry, strategic emerging industries and entrepreneurship rather than relying on foreign investments for technology, management skills and know-how (Liu, 2015).
This process of economic restructuring and upgrading has initiated industrial relocation into the hinterland. As a consequence, several cities have emerged as new engines of economic growth in the past decade: Many second-tier cities have several millions inhabitants, the most performing achieved above 15% economic growth over the past decade, and many of them have been benefiting from massive public investments and preferential policies in order to accelerate their development path (China Briefing, 2010). Yet, the definition of a second-tier city is highly contextual and rather depends on the geographical scale we look at it. Therefore, this innovative research paper proposes to study the rise of second-tier cites in the national and globalizing context of China. In the national context, we undertake a comparative macroeconomic analysis between first-tier and second-tier cities in order to understand if the general environment is conducive to business investments. In the globalizing context, we focus our attention on the rise of secondary cities in Yangtze River Delta, a large emerging global city-region. More precisely, we study how Shanghai has become an urban vector for FDI into secondary cities, and thus stimulating their economic development by promoting industrial restructuring, upgrading and relocation.
Ultimately, we conclude that the socio-economic development of second-tier cities are led by the first-tier city, which together benefit the overall sustainable development of China. In such a fast-changing and highly competitive business environment, second-tier cities shall be fully integrated to the strategic expansion plan of companies operating in China. Whether to achieve competiveness and cost optimization to better serve international markets or to increase revenue by supplying goods or services to Chinese consumers, decision makers shall take active anticipation and think ahead, so that the company can stand out in the market very rapidly.
Table of Contents
DECLARATION ... I ACKNOWLEDGEMENTS ... II EXECUTIVE SUMMARY ... III TABLE OF CONTENTS ... III LIST OF TABLES ... V LIST OF FIGURES ... V
1. INTRODUCTION ... 1
1.1. BACKGROUND ... 1
1.2. GENERAL DEFINITION OF SECOND-TIER CITIES ... 2
1.3. THE ROLE OF SECONDARY CITIES IN THE ECONOMY ... 4
1.4. THE PERFORMANCES OF SECOND-TIER CITIES ... 5
1.5. OBJECTIVES OF THE STUDY ... 6
1.6. RESEARCH QUESTIONS & METHODOLOGY ... 7
2. SECOND-TIER CITIES IN THE NATIONAL CONTEXT OF CHINA ... 9
2.1. DEFINITIONS ... 9
2.1.1. ADMINISTRATIVE DEFINITIONS ... 9
2.1.2. MARKETING DEFINITIONS ... 11
2.2. COMPARATIVE MACRO-ECONOMIC ANALYSIS BETWEEN FIRST-TIER AND SECOND-TIER CITIES ... 13
2.2.1. INTRODUCTORY REMARKS ... 13
2.2.2. COMPARATIVE ANALYSIS ... 14
3. SHANGHAI AS AN URBAN VECTOR FOR FDI INTO SECONDARY CITIES IN THE YANGTZE RIVER DELTA UNDER THE CONTEXT OF GLOBALIZATION 25 3.1. CONCEPTUAL FRAMEWORK & LITERATURE REVIEW ... 25
3.1.1. FOREIGN DIRECT INVESTMENTS (FDI) ... 25
3.1.2. GLOBALIZATION & GLOBAL CITIES ... 26
3.1.3. GLOBAL AND MEGA CITY-REGION ... 28
3.1.4. THE YANGTZE RIVER DELTA ... 32
3.2. HISTORY, ECONOMIC REFORMS AND INTEGRATION OF SHANGHAI IN THE GLOBAL ECONOMY ... 32
3.2.1. HISTORICAL BACKGROUND OF SHANGHAI AS A WORLD CITY ... 32
3.2.2. SHANGHAI IN THE BEGINNING OF ECONOMIC REFORMS ... 33
3.2.3. THE WEAKENED STATUS OF SHANGHAI IMPEDES REGIONAL DEVELOPMENT ... 34
3.2.4. OPENING-UP OF PUDONG, ACCESSION TO THE WORLD TRADE ORGANIZATION AND RESURGING POWER OF SHANGHAI IN THE YRD 36 3.3. MASSIVE INVESTMENTS AND COORDINATION OF THE REGIONAL TRANSPORTATION NETWORK ... 37
3.4. THE ECONOMIC PROCESS OF RISING TERRITORIAL LINKAGES IN THE YANGTZE RIVER DELTA ... 40
3.5. THE RISE OF SHANGHAI AND RESTRUCTURING OF THE INDUSTRIAL TERRITORY ... 43
4. CONTRIBUTION TO THEORETICAL & EMPIRICAL KNOWLEDGE ... 47
4.1. SECOND-TIER CITIES IN THE NATIONAL CONTEXT OF CHINA ... 47
4.2. SECONDARY CITIES IN THE GLOBALIZING CONTEXT OF CHINA... 49
5. CONCLUSION ... 50
List of Tables
Table 1: Example of a tier-city system for the province of Jiangsu ... 9
Table 2: Example of administrative tier-city system based on size of cities ...10
Table 3: GDP growth for FTC and STC from 2002 to 2007 ...15
Table 4: GDP growth for FTC and STC from 2008 to 2012 ...16
Table 5: Average growth in fixed assets investments from 2002 to 2012 ...18
Table 6: Average growth in retail sales from 2002 to 2012 ...23
Table 7: Sector contribution to GDP in 202, 2007 and 2012 ...24
Table 8: Empirical evidences of industrial upgrading and restructuring for some cities in the Yangzte River Delta Region in 1996 and 2005 ...41
Table 9: Sector contribution to GDP for major cities in the YRD ...45
Table 10: Key Industries in Shanghai and secondary cities ...46
List of Figures
Figure 1: Framework for Defining Systems of Secondary Cities ... 4Figure 2: Location of various tier cities according to JLL ...12
Figure 3: Total GDP for some FTC and STC from 2002 to 2012 ...14
Figure 4: Fixed Assets investments for selected cities for 2002-12 ...17
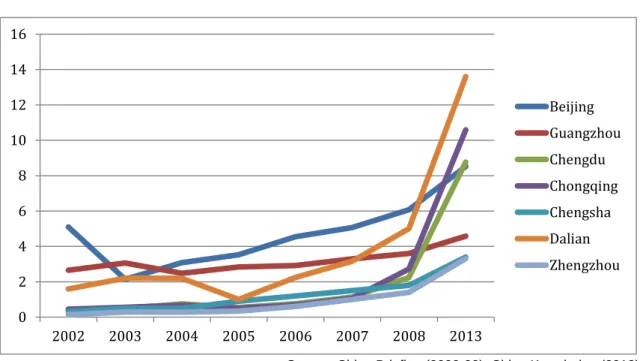
Figure 5: Utilization of FDI from 2002 to 2008 and 2013 ...20
Figure 6: Urban disposable income per capita from 2002 to 2012 ...21
Figure 7: Retail sales for our selected cities from 2002 to 2012 ...22
Figure 8: The outlook of emerging cities’ global influence ...28
Figure 9: The location of regional plans in China ...30
Figure 10: The YRD as a key region for the overall development of China ...35
Figure 12: The complete transporation network of the Yangtze River Delta ...38
1. Introduction
1.1. Background
China has been developing at a very strong pace and occurred drastic societal changes in the last decades. Among other facts, the country achieved at least 10% economic growth on average over the past 35 years, more than 680 millions people were lifted out of poverty (The Economist, 2013) and it became the world’s largest economy in 2014, outstripping the USA at purchasing power parity (Business Insider, 2014). China’s transition from a centrally-planned to a market-oriented economy has caught the attention of economic and business spheres for two main reasons. Firstly, resources availability and low labour wage represented a great opportunity to achieve competitiveness and economy of scale for multinational companies. And secondly, China had a huge potential of becoming the largest consumer market worldwide. Consequently, we understand why entrepreneurs and investors took the risk to put their money into the so-called “first-tier cities” such as Shanghai, Beijing, or even Shenzhen or Guangzhou. Initially, foreign investments have flooded into those areas because they actually benefited from investments preferential policies since the early years of economic reforms.
While the economic growth has mainly benefited to the cities along Coastal China driving huge social and economic inequalities with the other geographic regions, the Chinese government decided to implement a rebalancing policy under the leadership of Jiang Zemin. Back in 1999, they launched the “Go West Policy” to reduce the socio-economic gap between Coastal China and the hinterland. Today, those efforts are coming to climax: The transportation network and public facilities have drastically improved across the country, and hence, the development of new infrastructures are setting the ground for a friendly-investment environment, not only for domestic companies but also for foreign enterprises.
Consequently, several cities have emerged as new engines of economic growth in recent years. In fact, many of them have some millions inhabitants, the most performing achieve over 15% economic growth on average over the past decade, and most of them are now benefiting from investments preferential policies in order to accelerate their development path (China Briefing, 2010). While we tend to call Indonesia and Malaysia the “forgotten countries”, secondary cities in China could be nicknamed the “forgotten metropolises” due to the rare coverage in business media.
In such a challenging, fast-changing and highly competitive business environment like China, decisions-makers shall already have a step in the future, because the lack of anticipation and forward thinking can drive a company out of the market very rapidly. Therefore, secondary cities are not an option anymore, but rather a must: Whether it is to achieve competiveness and cost optimization to better serve international markets or to increase revenue by supplying goods or services to Chinese consumers, second-tier cities shall be fully integrated to the strategic expansion plan of companies operating in China.
1.2. General definition of second-tier cities
Foremost, it is important to say that there is no commonly agreed definition related to the term “second-tier cities”. Here, the challenge is to proceed to a careful selection of relevant studies. Therefore, the general definition is composed of experts from various backgrounds, especially in the fields of urban studies and business consulting.
Initially, the most standardized definition related to “second-tier cities” refers to a classification of cities based on the population size (Davis, 1955). In this regard, a secondary city can be described as an urban settlement from 100’000 to 500’000 inhabitants (UNCHS, 1996). However, we rapidly notice that this definition fails to take into account the complexity of different territorial realities. For example, the above description would not fit on the scale of Switzerland: As the largest city in the country, Zurich barely has more than 390’000 inhabitants whereas Lugano has less than 80’000 urban-dwellers. It could neither be applied to other neighbouring countries such as Germany. For instance, there are approximately 680’000 inhabitants in Frankfurt, which is much more than the definition recommended by the UN-Habitat. Needless to say that this difference of population size can be even greater across continents, and especially with emerging countries in Asia such as China or India, where there can be several millions of inhabitants living in those secondary cities.
Over time, this term has become more complex and some authors and organizations have started to incorporate other economic or social parameters in the definition. This is for example the case of the European Spatial Planning Observation Network (2013), which considers secondary cities in Europe as “those outside the capital city whose economic and social performance is sufficiently important to affect the potential performance of the national economy”. The socio-economic status of Manchester is definitely lower than London, but the city still registers high economic performances, and provides a broad range of social services as well as a sophisticated culture.
We have discussed so far about the meaning of a second-tier city based on a national standpoint. However, does it still make sense to do so in a globalising world? Today, the competition is fierce between modern metropolises to appeal capital, labour and technology (eg: Brenner and Keil, 2006; Sassen, 2001). Accordingly, the process of globalization requires from cities to strengthen their competitiveness and increase their overall attractiveness (eg: Sinkiene and Kromalcas, 2010). From this viewpoint, a second-tier city may have a position according to the global urban hierarchy (Roberts and Hohmann, 2014). For instance, London, Tokyo and New-York are leading metropolitan hub providing with modern financial services, high level of business activities, sophisticated network of infrastructures, cultural appeal as well as engagement for global politics and diplomacy (Wu, 2006; Fridemann, 1995; Sassen, 1991). On the other hand, Shanghai and Mumbai, which are emerging cities with a current secondary order in the world urban hierarchy, may have a huge potential of becoming global first-tier cities.
That being said, governments increasingly endorse regional cooperation among clusters of cities under the globalization process (Xu and Yeh, 2010; Scott, 2001). The city cluster often includes a global (emerging) city, which collaborates with secondary cities from the hinterland. In a case of regional integration, the meaning of a second-tier city can be different again. Let us take a very local example: The canton of Geneva is trying to establish a cross-border conurbation in collaboration with the district of Nyon and French provinces of Ain and Haute-Savoie. On account of its economic, demographic and political predominance in the region, Geneva would certainly play the role of a first-tier city. Aside, Annemasse and Saint-Julien-en-Genevois would potentially undertake the function of some second-tier cities providing cheaper qualified workforce and price competitiveness for real estate, retailers and some lower-added value manufacturing activities, among others. Ultimately, Geneva would focus on advanced producer services and high-end manufacturing activities while downward pressure on wages and outsourcing of low-added value activities would potentially enhance the competitiveness of domestic enterprises on local and international markets. In the end, this would be eventually stimulating economic activities for the whole region. In this context, the role of surrounding cities is enhanced. But in the national context of France, those aforementioned cities are unquestionably considered as low-tier cities, though it may be true for Geneva to be considered as a first-tier city in the context of Switzerland. Therefore, we can draw some preliminary conclusions related to the general meaning of a second-tier city: Firstly, It mainly refers to some demographic, economic and political criteria; secondly, It is fair to say that this term is
essentially contextual and circumstantial; and thirdly, secondary cities may play a much more prominent role at sub-national or sub-metropolitan region level in the context of globalization.
1.3. The role of secondary cities in the economy
The best way to grasp and delimit the scope of the various tier cities’ functioning is based on Roberts’ framework (Figure 1). He designed a diagram based on the city order, the function & market orientation as well as the city size. From a personal viewpoint, both overlapping areas mean that the distinction between each city tier is often very complex. Consequently, there are unquestionably some linkages among different tier cities due to this intricate relationship. This relationship will be deepened further during the analysis in chapter 3.
Overall, the purpose of secondary cities in the economy may be highly heterogeneous, depending on countries, political and administrative functions, population size, and position in the global economy. Generally speaking, a second-tier city with a sub-global order will be involved in regional trade through clusters of services and manufacturing activities, while secondary cities with national and sub-national order are more likely to rely on logistics, services and manufacturing centres. Sometimes, they may be also district-level governments engaging in services & processing activities.
Figure 1: Framework for Defining Systems of Secondary Cities
Source: Roberts (2014)
Among others, the role of a secondary city is more likely to vary according to its geographical location or function (Roberts, 2014). In this regard, cities are more likely to be classified according to three different typologies.
The first typology refers to “Subnational Secondary Cities”, which is the most common type. Those are generally constituted of a population over 200’000 people and are more likely to be “subnational administrative capital, transport hub or large manufacturing or natural resource industry centre”, or sometimes important cultural centres. Additionally, they tend to contribute greatly to the economic activities of a country, and sometimes to a larger geographical scale. As such, Roberts gives the examples of Belo Horizonte, Brazil as a major secondary city engaged in export trading of metals and minerals; Bangalore, India as a pillar for Information Technology and Communication (ITC); and Cusco, Peru or Mecca, Saudi Arabia as significant cultural and historical heritages.
This second is associated to “Metropolitan Secondary City”, which is related to the expansion of the urbanization process. In so far as increasing costs impact the competiveness of the core city, enterprises are inclined to relocate manufacturing activities to the surroundings. As a consequence, this leads to “a process of deindustrialization and decentralization” from the primary city to the periphery. Ultimately, the relocation of low value-added activities and the migration of low-skilled workers foster the development of new urban settlements including economic enterprises zones, business parks, regional shopping facilities and housing.
The third and last typology is called “Corridor Secondary Cities”. The improvement of transportation network across or between countries offers a unique chance to develop new engine of growth. Better accessibility gives an incentive for firms to delocalize their lower value-added activities in order to benefit from cheap labour and be closer to the source of raw materials. Undoubtedly, this is much easier to build new infrastructures to connect remote cities.
1.4. The performances of second-tier cities
First of all, we need to distinguish second-tier cities from developed versus developing countries. In Europe, the majority of countries can be seen as mature economies. Common characteristics for such economy are the following: Diversified economic activities, slow economic growth, advanced level of public infrastructure and a sophisticated consumption market. In that situation, the performance of second-tier cities is important for the corresponding national economy. As a matter of fact, secondary cities can contribute up to 33% of Europe’s total GDP compared to 23% for capital-cities (ESPON, 2013).
In recent times, the economic and financial crisis has led to an economic slowdown all around the world, but especially in European countries, whose recovery is still very slow today. In such a case, second-tier cities can be a source of opportunities to partly overcome the deadlock. In fact, the spread of investments and resources across cities and the decentralization of power and duties can improve cities performance, and thus, the national economy as a whole (ESPON, 2013). As a result, investments in secondary cities could release performance pressure from first-tier cities (being often capital-cities) and redistribute more evenly the economic activity across a country. This could eventually drive sustainable development and reduce regional inequalities. In the developing countries, the situation is often very different. Indeed, most of second-tier cities are facing many challenges on the road of development, and more particularly in Africa, in the Middle East and in Latin America. Actually, the majority of them can barely rely on an efficient economy and the tax system is often ineffective. Consequently, those cities are not attractive enough to retain capital and investments and the level of unemployment is often high (Roberts and Hohemann, 2014).
Generally speaking, the least performing are metropolitan secondary cities, which are often poorly managed and lack fundamental infrastructures such as proper transportation, appropriate water and electricity facilities, and housing. As a result, this may lead the development of social insecurity. In practice, a lot of slums located in Latin America, and especially in Brazil and in Colombia, are part of this category. Under this configuration, the potential of secondary cities is spoiled, and contrariwise, government and society bear the burden of such uncontrolled urban development. Nevertheless, some secondary cities provide unique opportunities for economic growth and welfare improvement in developing countries: There is an increasing tendency for governments to foster the development of corridor secondary cities at regional level in order to reinforce economic cooperation and integration (Roberts and Hohemann, 2014). As a result, such region becomes much more competitive in the global economy. For instance, China is now investing much time and money to promote cooperation among cities in order to develop and integrate them into regional economic zones such as the areas of Yangtze River Delta and Pearl River Delta.
1.5. Objectives of the study
For more than a decade, China has offered unique business opportunities, and many foreign enterprises, including Swiss SMEs, have been expanding their activities in this
country. Initially, this study proposes to undertake some research to attain the following objectives:
Grasp the meaning of “second-tier cities” in China for small and medium enterprises (SME);
Sensitize such enterprises to the socio-economic emergence and the growing role of second-tier cities in China;
Understand the complex mechanisms of regional interactions between primary and secondary cities in a context of globalization.
1.6. Research questions & methodology
There are currently a lot of debates about the meaning of second-tier cities. Our preliminary researches have led us to conclude that this definition highly depends on the geographic context of study. Therefore, we divide our research paper into two parts.
The first part of the analysis focus on second-tier cities in the national context of China. As such, we need first to understand what is a second-tier city within the national border, before understanding the growing economic role of second-tier cities in the national economy of China. Ultimately chapter 2 suggests answering to the following questions:
1. What is a second-tier city in the national context of China?
2. What kinds of characteristics distinguish a second-tier city from a first-tier city? 3. Is the macro-economic environment of second-tier cites conducive to business
investments?
To answer to those questions, we undertake a macroeconomic analysis of identified second-tier cities in comparison with some first-tier cities. In this regard, we select a random sample of 7 cities, including 2 first-tier cities (Beijing and Guangzhou) and 5 second-tier cities (Chengdu, Chongqing, Changsha, Dalian and Zhengzhou). We proceed in that way because there are at least 20 second-tier cities that would correspond to our synthesis. Otherwise, it would have been impossible to perform a comparative analysis with all of them.
Subsequently, the second part of the analysis pays attention to the economic role of secondary cities in the context of globalization in China. Rather than debating on the meaning, it is much more interesting to understand how globalization effects structure
the industrial territory. As a result, we try to understand how the socio-economic development of a global (emerging) city can stimulate in turn the development of secondary cities1. To simplify the research, we focus on analysing how Shanghai is
used as an urban vector of FDI into secondary cities of the Yangtze River Delta (YRD). We mainly use qualitative and quantitative information from secondary sources. In this regard, we initially construct a conceptual framework about FDI, globalization, global cities and mega-city region before undertaking an historical approach in order to understand the current development of the YRD.
1
Because the purpose of chapter 3 is not to focus on the definition of a second-tier city in
the globalizing context of China, I voluntarily use the term « secondary city ». Aside Shanghai, this implies that cities all have an equal significance regardless of administrative status and economic performances or any other related factors.
2. Second-tier cities in the national context of China
2.1. Definitions
2.1.1. Administrative definitions
The most basic, but official definition yet, could refer to an administrative classification from political authorities. In fact, the territorial organization of China could be divided into administrative functions with typically a four tier-system of cities (China Org, 2014). In such organization, each city is held responsible to report to higher hierarchical level city, except if those benefit from an autonomous or independent status.
In that case, first-tier cities would mainly refer to municipalities and special administrative regions such as Beijing, Shanghai, Tianjin and Chongqing. Second-tier cities could be considered as provincial, sub-provincial or autonomous regional capital cities such as Xi’an, Dalian or Hohhot. Finally, third-tier and forth-tier cities would respectively be constituted of prefectural-level and county-level cities.
Table 1: Example of a tier-city system for the province of Jiangsu
Tier-level Administrative function Corresponding cityFirst-tier Municipality or special administrative regions
None; the closest city is the municipality of Shanghai
Second-tier
Provincial capital city, sub-provincial or autonomous regions capitals
Nanjing
Third-tier Prefectural-level cities
Changzhou, Huai’an, Lianyungang, Nantong, Suqian, Suzhou, Taizhou, Wuxi, Xuzhou, Yancheng, Yangzhou, Zhenjiang
Fourth-tier County-level cities
Changsu, Dafeng, Danyang, Dongtai, Gaoyou, Haimen, Jiangyin, Jingjiang, Jitan, Jurong, Liyang, Kunshan, Pizhou,
The above administrative organization is closely linked to another official classification based on the size of cities. Given the fact that China is facing new urbanization challenges, the government decided to establish a five-tier cities system to “improve population management and city planning” (China Gov., 2014). Here, first-tier cities are referenced by “super large-sized cities” with a population over 10 millions inhabitants whereas “very large-sized cities” are second-tier cities with a population from 5 to 10 millions. “Large cities” are third-tier cities with a population between 1 and 5 millions, “Medium-sized cities” is regarded as the fourth-tier with a population varying from 500’000 to 1 million inhabitants and under a population of 500’000 inhabitants, fifth-tier cities are considered as “small-sized cities”.
Table 2: Example of administrative tier-city system based on size of cities
Tier-level Characteristics Corresponding city
First-tier Super large-sized; >10 millions people
Shanghai, Beijing, Guangzhou, Shenzhen, Tianjin
Second-tier Very large-sized cities; between 5 and 10 millions
Wuhan, Dongguan, Chengdu, Chongqing, Nanjing, Xi’an, Shenyang, Hangzhou, Suzhou
Third-tier Large cities; between 1 and 5 millions
Qingdao, Harbin Jinan, Zhengzhou, Dalian, Kunming, Wuxi, Xiamen, Changchun, Ningbo, Nanning, Taiyuan, Hefei, Changzhou, Tangshan
Fouth-tier Medium-sized cities; between 500’000 and 1 million
Wuchuan, Feicheng, Xianyang, Linfen, Handan, Henyang, Xinyi, Weihai, Haimen
Fifth-tier Small-sized cities; <500’000
Lijiang, Altay, Karamay, Lhasa, Tieling, Kashgar, Lishui, Naping, Xuchang
2.1.2. Marketing definitions
We have to take into consideration that the interests of political figures can be different from those of companies. Therefore, the previous definitions may not be the most appropriate for enterprises looking to expand business activities in China. As a consequence, many unofficial definitions have flourished in recent years to tackle the challenge of business expansion and market segmentation.
When addressing the Chinese market, companies have to take into account that the country is huge and the level of development is often highly heterogeneous from one region to another in terms of purchasing power, brand sensitivity, consumption expenditures, costs of living, and so on. Consequently, it is important for them to internalize those different characteristics before designing a growth strategy for the Chinese market. That is why it is also crucial to look at second tier cities from a business standpoint.
While it is commonly agreed that first-tier cities generally include Beijing, Shanghai, Guangzhou and Shenzhen, the notion of second-tier cities is more ambiguous. In fact, some tend to incorporate population size, infrastructures and economic indicators such as GDP, disposable income and housing sales in order to define second-tier cities (China Briefing, 2010). Some consulting firms can even include more elaborated criteria such factors of employment, quantity and quality of higher education institutions, transportation linkages as well as business orientation of local administration (Wall Street Journal, 2011). In parallel of establishing major industrial, commercial and financial hubs, second-tier cities have benefited from huge investments in public infrastructures and influx of qualified workforce in the past decade, offering premium opportunities for business activities (Wall Street Journal, 2011). In an international comparative perspective, second-tier cities tend to be compared to prominent cities such as Chicago, USA or Bangalore, India and would offer preferential policies for FDI, cheaper labour costs, better environmental conditions and less traffic congestion (China Org, 2007).
Afterwards, we have another definition from All China Market Research (ACMR), which is consulting firm specialized in business intelligence. They have developed an index based on the city consumption power, which includes total urban population, GDP, total consumption, disposable income per capita, savings and other consumer spending indicators. As result, they came up with a five-tier city system, resulting in the
identification of 52 cities by consumption power2 (U.S. Department of Commerce,
2013).
Last but not least, we have a similar classification from Jones Lang LaSalle (JLL), which is a company specialized in commercial real estate services and investment management. Back in 2009, they started to launch a yearly series of reports on real estate opportunities in China. The city tier system was based on based on economic, demographic, political and financial factors. Over time, the methodology has evolved and has been improved. Nowadays, they distinguished between three different tiers.
Figure 2: Location of various tier cities according to JLL
Source: Jones Lang LaSalle (2014) Tier I “Core” cities refer to the most advanced cities such as Beijing, Shanghai, Guangzhou and Shenzhen, where there is high level of modern manufacturing and services activities, including a strong presence of corporate headquarters and advanced financial services, and strong linkages with the global business network. In those cities, the market of real estate may be already maturing or overheating due to speculative investments. Markets being the most liquid and transparent across China, Tier I cities provide fairly secure source of investments for foreign investors.
2 The link for the document with the name of second-tier cities is available in the
Tier II is divided into two categories such as “Transitional” and “Growth”. The former grouping may include cities such as Chengdu, Chongqing, Shenyang, Tianjin and Hangzhou. Over the past decade, those have received massive policy support from the central government and significant amount of investment in public infrastructure. Consequently, Tier II Transitional cities have succeeded in attracting foreign direct investments (FDI) and developing strong degree of economic activities. On the other hand, Tier II “Growth” cities may consist of Xi’an, Qingdao, Ningbo and Wuxi. Those may be sharing common characteristics with some previous transitional cities. Besides, favourable demographics factors should strongly support the development of retail sales markets and industry diversification in the near future.
Again, JLL characterizes Tier III Cities in two different categories, so-called “Emerging” and “Early adopter” cities. Emerging cities are still lagging behind in terms of economic development, but they are currently in a phase of take-off, which make them particularly attractive for some commercial activities and the real estate market. Some examples include cities such as Kunming, Harbin and Nanning. On the other side, “Early adopter” cities have recently started to establish economic conditions to attract foreign investments. This is the case of Guiyang, Taiyuan and Urumqi. Despite being risky, some foreign companies are looking for the “first-mover” advantage. Figure 2 provides a map with the location of those various tier cities across China.
2.2. Comparative macro-economic analysis between
first-tier and second-tier cities
2.2.1. Introductory remarks
Now that we have a common understanding of what is a second-tier city in China from a national perspective, it would be interesting to undertake an economic trend analysis between some first-tier and second-tier cities in order to understand if the business climate is conducive to investments. Before doing so, it is necessary to say that data is not always accurate in China. This is mainly due to the fact that provincial government officials may be subject to political pressure to achieve high economic performances. Thus, statistics are sometimes skewed. Despite the fact that there is still room for improvement, there has been huge progress in recent years to polish the way data is statistically collected and computed. Besides, many credible studies providing analysis and recommendations rely on the statistics from the National Bureau of Statistics of China. As a result, the upcoming comparative analysis is still worth doing it.
2.2.2. Comparative analysis
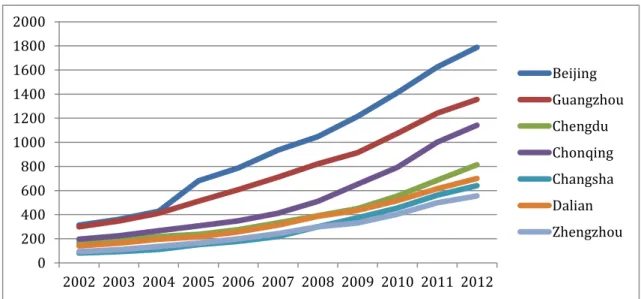
As per Figure 3, our starting point for this analysis is going to be the nominal GDP in absolute values for our selected first-tier and second-tier cities. Here, I am using the nominal GDP for the sake of simplicity. However, It is true that it would have been more accurate to consider the real GDP: The latter gives a more realistic picture of the economy, given that it take into consideration the inflation rate as well as the currency appreciation (or depreciation). At first sight, we can assert that the boom of the Chinese economy has rather spread out across the whole country. Indeed, we can see that all the cities demonstrated strong momentum from 2002 to 2012.
Figure 3: Total GDP for some FTC and STC from 2002 to 2012 (RMB bio)
Source: National bureau of statistics of China (2002-2012)
Given the fact that Beijing and Guangzhou were some of the first to enjoy the benefits of economic reforms, they naturally had a larger GDP in 2002 with regards to the second-tier cities. For the first two years, both were following the same trajectory. But suddenly, the GDP of Beijing dramatically accelerated from RMB 428 billions in 2004 to RMB 681 billions the year after. In 2012, the total GDP reached RMB 1’788 billions. After 2004, Guangzhou was not able to catch up again, and simply followed a parallel development to that of the national capital city.
Then, the economy of second-tier cities rose gradually from 2002 to 2007. Overall, we notice a much sharper increase after that year, and especially for Chongqing. In fact, we can observe two trends for this city: I) it will considerably reduce the growing gap that occurred with Guangzhou from 2004 to 2009, and II) it will distance itself from other secondary cities. On the other hand, the economic development of Changsha, Chengdu, Dalian and Zhengzhou remained pretty homogenous over the years, but we
0 200 400 600 800 1000 1200 1400 1600 1800 2000 2002 2003 2004 2005 2006 2007 2008 2009 2010 2011 2012 Beijing Guangzhou Chengdu Chonqing Changsha Dalian Zhengzhou
notice that the pattern was slowly changing as of 2009.
Nonetheless, we have to be cautious because the graph can be confusing. Indeed, we could believe that the gap between the richest and the poorest city, respectively Beijing and Zhengzhou, would be much lower back in 2002 compared to 2012. But after a quick computation, we note that the ratio for the wealth of Beijing was 3.88 times higher than Zhengzhou in 2002, and reached 3.22 in 2012, which corresponds to a decrease of 17%3.
Before pushing the analysis further, we are going to divide our dataset into two periods: The first period is between 2002 and 2007, and the second is from 2008 to 2012. Table 2.1 and Table 2.2 provide some figures related to the economic growth of our cities for both periods.
Table 3: GDP growth for FTC and STC from 2002 to 2007
GDP % 02-03 GDP % 03-04 GDP % 04-05 GDP % 05-06 GDP % 06-07 Average 03-07 China 10.0 10.1 11.3 12.7 14.2 11.7 Beijing 16.7 14.3 41.9 29.5 18.8 24.2 Guangzhou 18.6 15.7 23.8 19.2 17.0 18.9 Changsha 19.7 16.5 29.3 22.7 21.7 22.0 Chengdu 15.6 13.5 12.9 11.4 20.9 14.8 Chongqing 17.6 15.0 15.5 13.4 18.1 15.9 Dalian 19.8 16.5 15.5 13.4 21.8 17.4 Zhengzhou 24.2 19.5 23.0 18.7 23.5 21.8
Source: Computed by Fabien Cadez on year-on-year change based on GDP data provided by China’s National bureau of statistics from 2002 to 2007; For China, data provided by the World Bank (2015).
During the first five years, the average economic growth of Beijing and Guangzhou combined impressively reached 21.5%. Although it is still very remarkable, the second-tier cities were still behind and achieved on average 18.4%. Therefore, we can logically deduce that the first-tier cities were not only contributing the most to the national economy, but they were also benefiting from the strongest economic growth. Indeed, if we focus on Beijing alone, we notice that the capital city of China had registered striking performances with an average growth of 24.2%. It even reached a peak of 41.9% growth in 2005 and 29.5% in 2006! Despite Changsha and Zhengzhou being the poorest cities of our sample, we can observe that both recorded very high GDP
3
The computation is the following: wealth of Beijing divided by the wealth of Zhengzhou
(2002) = 361/93= 3.88; For 2012 = 1788/555 =3.22. Then, I used a « rule of 3 » to compute the percentage using 3.88 as 100% basis.
growth on average from 2002 to 2007, respectively 22% and 21.8%. This was even better than Guangzhou (18.9%). On the other side Chengdu, Chongqing and Dalian were relatively lagging behind in spit of rapid economic development.
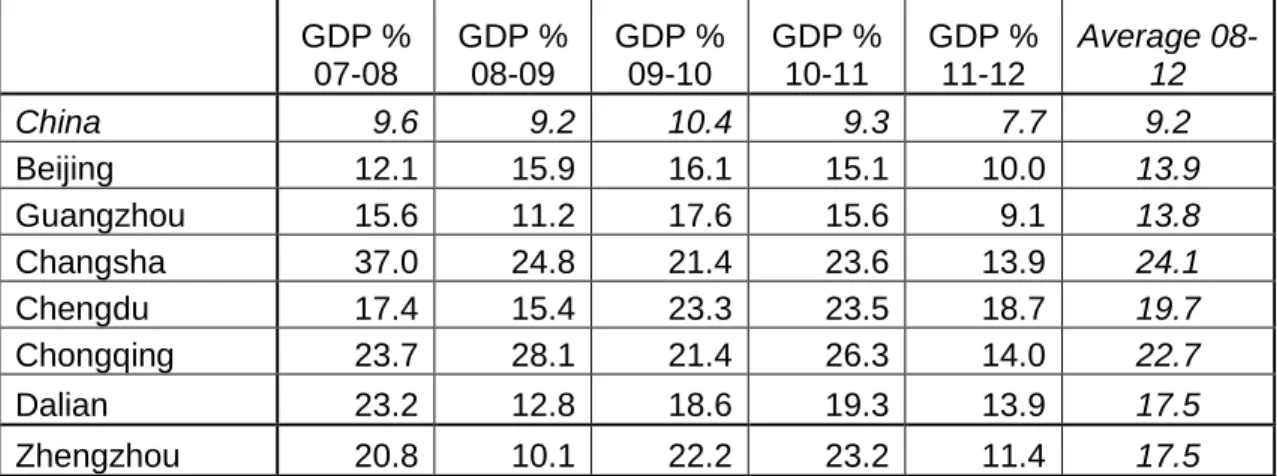
During the second period, we can observe a different pattern: Beijing and Guangzhou were still large contributors to the economy of China, but they were no longer leading the economic growth. As a matter of fact, the average growth reached respectively 13.9% and 13.8% for Beijing and Guangzhou. On the other side, the second-tier cities managed to successfully achieve a combined average of 20.3% GDP growth. In comparison to the years 2002-07, Changsha even recorded a better performance up to 24.1%, Chongqing exceeded the 20% threshold, Chengdu reached 19.7%, and Dalian maintained a pretty constant economic growth of 17.5%. The only exception is Zhengzhou, whose growth decelerated down by 4.3 points.
Table 4: GDP growth for FTC and STC from 2008 to 2012
GDP % 07-08 GDP % 08-09 GDP % 09-10 GDP % 10-11 GDP % 11-12 Average 08-12 China 9.6 9.2 10.4 9.3 7.7 9.2 Beijing 12.1 15.9 16.1 15.1 10.0 13.9 Guangzhou 15.6 11.2 17.6 15.6 9.1 13.8 Changsha 37.0 24.8 21.4 23.6 13.9 24.1 Chengdu 17.4 15.4 23.3 23.5 18.7 19.7 Chongqing 23.7 28.1 21.4 26.3 14.0 22.7 Dalian 23.2 12.8 18.6 19.3 13.9 17.5 Zhengzhou 20.8 10.1 22.2 23.2 11.4 17.5
Source: For FTC and STC, computed by the author on year-on-year change based on GDP data provided by China’s bureau of statistics from 2008 to 2012; For China, data provided by the World Bank (2013). What can eventually explain this changing paradigm? Back in 1999, the central government decided to introduce the “Go West strategy”, in order to reduce the growing gap of wealth between Coastal China and the hinterland. Therefore, one possible argument is that the political priority bound to economic development has shifted from Eastern to Inner China. Accordingly, one important aspect has been to develop the transportation network across the country. In that respect, large public investments have been made to build a modern transportation network, and more specifically, to construct new roads and airports while improving the existing rail network (China Briefing, 2010). Among others, this has included the allocation of financial resources into public facilities such as water resources, energy and telecommunication network. According to China Daily, the government has already
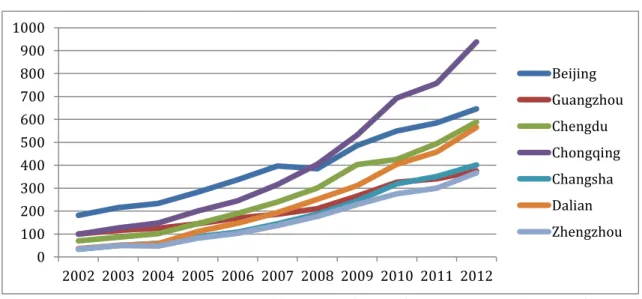
invested 325 billions RMB to develop major infrastructure projects in Western China. Given that Coastal China is now looking to move up the value chain by producing higher-added value activities, another essential part of this strategy has been to provide incentives for both domestic and foreign enterprises to relocate labour-intensive and natural resources activities from Eastern to Inner China. As a result, the government has promoted investments in some encouraged industries through a broad range of policies such as fiscal deductions or exemptions, land and resources concessions and financial support (HKTDC, 2000). Consequently, both investments in public infrastructure and relocation of business activities are possibly the main factors explaining the accelerating growth of second-tier cities in China as of 2008. Although it is difficult to estimate the correlation between policy effectiveness and economic development without a statistical method, our argument is conceivably confirmed by looking at the investments made in fixed assets, which includes investments in capital construction, innovation, real estates development and other related investments. As we can see on Figure 4, both first-tier and second-tier cities had a steady growth in fixed assets investments from 2002 to 2006. As of 2007, we notice a drastic acceleration for several second-tier cities, and especially Chongqing. In fact, this city had registered an impressive boost in fixed assets: Over the whole period, the investments went from RMB 99 billions at the beginning of the period to almost RMB 938 billions in 2012, which represents an increase of 1000% in only ten years! Ultimately, the investments made in Chongqing even exceeded those of Beijing as of 2008.
Figure 4: Fixed Assets investments from 2002 to 2012 (RMB bio)
Source: China Briefing (2002-03); China’s bureau of statistics (2004-12)
0 100 200 300 400 500 600 700 800 900 1000 2002 2003 2004 2005 2006 2007 2008 2009 2010 2011 2012 Beijing Guangzhou Chengdu Chongqing Changsha Dalian Zhengzhou
Aside, both Chengdu and Dalian were also gradually catching up with Beijing at the end of 2012. With respect to Changsha and Zhengzhou, the trend had steadily increased from 2002 to 2012. Although investments in fixed assets were relatively lagging behind, investments made in Changsha were higher than Guangzhou as of 2011 and Zhengzhou was almost overtaking in 2012.
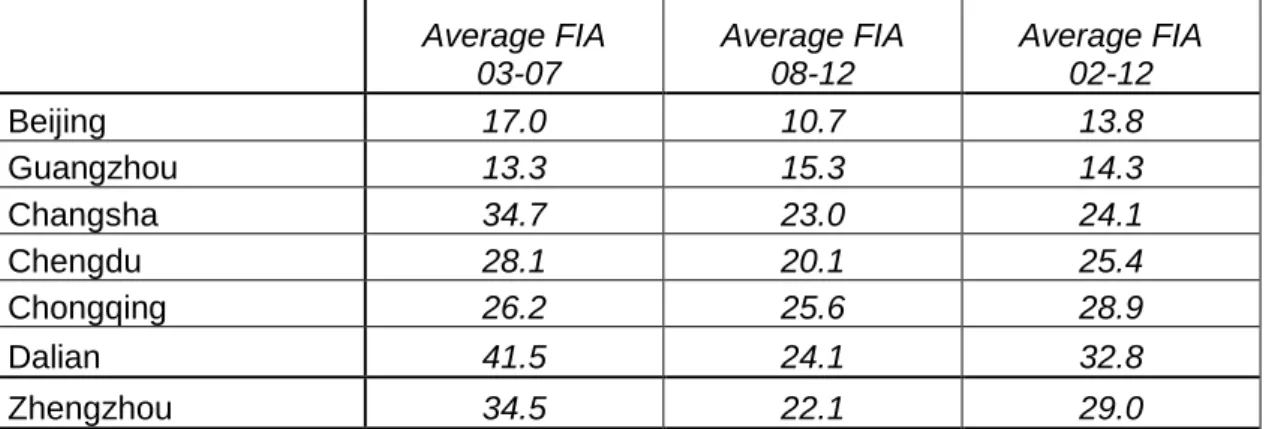
From a growth perspective (Table 5), we notice that the expansion of fixed assets investments was overall striking between 2002 and 2007. While Beijing and Guangzhou were respectively around 13.3% and 17% on average, the performances of second-tier cities were varying from 26% to 42%! However, we observe a radical slowdown in the average growth of fixed investments from 2008 to 2012, except for Guangzhou. Actually, this shall not be a surprise if we take into consideration the economic and financial crisis, which partially overlapped this period.
During the global downturn, China launched a huge economic stimulus package of RMB 4 trillions to contain the negative consequences. This amount was mainly invested in transport & power infrastructure, rural village infrastructure, environmental investments, affordable housing, technological innovation & structural adjustment, and health & education (Naughton, 2009). Now, if we acknowledge that the first-tier cities on Coastal China already benefited from advanced infrastructures, there are reasons to believe that the stimulus program was mainly attributed to lower-tier cities in other regions. This may be explaining why the average growth of fixed assets investments was still above 20% for the second-tier cities from 2008 to 2012.
Table 5: Average growth in fixed assets investments from 2002 to 2012
Average FIA 03-07 Average FIA 08-12 Average FIA 02-12 Beijing 17.0 10.7 13.8 Guangzhou 13.3 15.3 14.3 Changsha 34.7 23.0 24.1 Chengdu 28.1 20.1 25.4 Chongqing 26.2 25.6 28.9 Dalian 41.5 24.1 32.8 Zhengzhou 34.5 22.1 29.0
Source: Computed by the author on y-o-y change based on FIA data provided by China Briefing for 2002-03 and China’s bureau of statistics from 2004 to 2012.
Although the share of FDI as percentage of total investments in fixed assets has seriously declined from 9% in 1996 to approximately 3.5% on average in the 2000s, statistics demonstrate that FDI inflows contributed to 33% of manufacturing
employment and almost 60% share of total exports by the end of 2008 (Chen, 2011). Therefore, it is worth spending some time on this aspect. Figure 5 provides the utilization of FDI from 2002 to 2008. Unfortunately, data was not available from 2009 to 2012, but it was still possible to obtain the figures for 2013.
The utilization of FDI in first-tier cities is somewhat ambiguous from 2002 to 2008. The utilized FDI felt sharply for Beijing from US$ 5.1 billions to 2.15 billions between 2002 and 2003 but started again to rise progressively from 2004 before reaching US$ 8.5 billions at the end of 2013. In parallel, Guangzhou had fluctuated around US$ 3 billions and only used US$4.6 billions in 2013. In the second-tier cities, the utilization of FDI had been pretty constant from 2002 to 2008. The only outlier is Dalian, whose data was overall closer to our first-tier cities and had experienced much more fluctuations. But we have to keep in mind that Dalian became a Special Economic Zone (SEZ) in 1984, and therefore, benefited earlier from favourable treatments and policies related to FDI. While the curves had remained quiet homogenous until 2008, we suddenly observe a steep increase in realized FDI for Dalian, Chongqing and Chengdu. Unexpectedly, those cities respectively registered US$ 13.6 billions, US$ 10.6 billions and US$ 8.8 billions, exceeding Beijing (US$ 8.5 billions).
Strategically located along the coast in the Northeast, Dalian is trying to boost economic development by adjusting the industrial structure and pursue the open policy further. It was designated not only as a strong industrial base for light and heavy industries such as textiles and garments or metallurgy and construction metals as well as some high tech industries like medicine and petrochemicals, but also as an experimental city for service outsourcing (KPMG, 2015). Aside, the boom in FDI inflows in Western China could be predicted: The Chinese government approved a project for Chongqing and Chengdu to become a National Comprehensive Coordinated Urban-Rural Development Experimental Zone (CURDEZ) in 2007 and the State Council of China launched the Development Plan for Chengdu-Chongqing Economic Zones in 2011. Through those initiatives, it is clear that the central administration wants to elevate those cities as an important regional hub in Western China. Accordingly, the only way for them to achieve fast economic growth and catch up with the wealthy cities along Costal China is to “open to the world and attract FDI” (Yu, 2015). Nowadays, both are becoming key areas for business investments in the region. For example, they have already succeeded in attracting important multinationals in modern manufacturing and services, consumer goods and retailers such as Samsung, HSBC, Procter & Gamble and Carrefour and have successfully established high-tech development zones for both domestic and foreign firms.
Figure 5: Utilization of FDI from 2002 to 2008 and 2013
4(RMB Bio)
Source: China Briefing (2002-08); China Knowledge (2013)
Eventually, growing urbanization rate, better transportation network and public facilities have attracted influx of new talents and industries into second-tier cities, which in turn, has provided employment for the population. Subsequently, higher productivity of workers has raised the wages up, and has successively led the rapid increase in the overall standards of living. This can be reflected in the urban disposable income per capita, which more than doubled in a decade for our sample of cities.
As we can see on Figure 6, the disposable income in both first-tier and second-tier cities is following a linear pattern. However, we notice that there is still a gap between both categories of cities: While the urban disposable income for Beijing and Guangzhou is converging, roughly RMB 7’500 separates those cities from Dalian and Changsha, and twice more from Chongqing. In general, this means that that the purchasing power is still lower in second-tier cities, but in contrast, this could imply that labour costs are considerably cheaper compared to first-tier cities. This is an important remark to flag because such discrepancy can be interpreted differently depending on the type of company, and thus, have different implication with respect to commercial and strategic interests.
4
China distinguishes between contracted and utilized FDI. This difference lies in the fact
that some contracted FDI “may never materialized” or be a “one-off action” whereas utilized FDI takes into account projects realization at the end of the time period (Wei and Liu, 2001). In that case, I decided to opt for the latter.
0 2 4 6 8 10 12 14 16 2002 2003 2004 2005 2006 2007 2008 2013 Beijing Guangzhou Chengdu Chongqing Chengsha Dalian Zhengzhou
Figure 6: Urban disposable income per capita from 2002 to 2012 (RMB)
Source: China Briefing (2008); *Information for 2011-12 for FTC and 2009-12 for STC was not available. Use of the average growth from 2002 to 2008 to estimate the data.
However, the urban disposable income per capita is a flawed measure because it does not take into account wealth discrepancy. Therefore, it may be important to take into account the corresponding distribution of wealth across our cities in order to understand the true allocation of urban disposable income. But again, the lack of available information does not help us to answer precisely to this question. As a consequence, we can only take the aggregate Gini index for China, which actually reached 0.474 in 2012 (Forbes, 2013). Of course, this reflects especially the high divergence of wealth between urban and rural areas, but there are still reasons to believe that income discrepancy may be fairly high, due to the massive migration flow of rural workers into cities. As a result, those low-skilled and uneducated labour forces often constitute the lowest income bracket among cities (Wu, 2007; Gu and Feng, 2003). In such case, this is again an important point to emphasize, because it may have some implications related to customer segmentations. Sometimes, the use of innovative business model, so-called “reverse innovation”, may be required to reach group of consumers from lower strata. Having said that, the lack of data does not provide enough clarity on how households allocate the disposable income. From an aggregate perspective, it is often said that China has a very high saving rate. Hence, if we apply this hypothesis to our sample of cities, the remaining money for consumption should be pretty low. Nevertheless, the rise of second-tier cities seems to increasingly promote the emergence of large developing consumer and industrial markets (WSJ, 2011). Here, the total retail sales rather appear to confirm this latter assumption.
0 5000 10000 15000 20000 25000 30000 35000 40000 Beijing Guangzhou Chengdu Chongqing Changsha Dalian Zhengzhou
Figure 7: Retail sales for our selected cities from 2002 to 2012 (RMB bio)
Source: China Briefing (2002-05); China’s bureau of statistics (2006-12) As per Figure 7, total retail sales of consumer goods show a heterogeneous pattern among categories, and to less extent, within our second-tier cities. While the retail sales had risen steadily for Beijing and Guangzhou from 2002 to 2012, both Chengdu and Chongqing had demonstrated a more gradual trend, whereas Dalian, Changsha and Zhengzhou had somewhat increased at a constant pace.
From 2002 to 2007, the average growth of retail sales is pretty high for both first-tier and second-tier cities, being clearly above 10%. Beijing, Chongqing and Zhengzhou even registered more than 17% average growth while Changsha reached the highest peak with 21.3% during those years. On the other side, the performances of Guangzhou, Chengdu and Dalian are a bit lower, respectively achieving 13.7%, 13.9% and 11%. That being said, we can observe an accelerating trend for most of the cities after 2007, aside from Beijing and Changsha. Although the effects of the global economic and financial crisis slackened the development of retail sales in 2009, the aggregate growth sales of consumer goods had increased up to 19% on average for our second-tier cities from 2008 to 2012.
In the end, the total retail sales of consumer goods are obviously booming all around China, whether it is in first-tier or second-tier cities. Wall Street Journal reported from a report of Business Monitor International that “Chinese retailers are expanding their activities into the booming secondary and tertiary cities”. This implies that we should see a more prominent share of domestic consumption in the economy of China in the long run. 0 100 200 300 400 500 600 700 800 900 2002 2003 2004 2005 2006 2007 2008 2009 2010 2011 2012 Beijing Guangzhou Chengdu Chongqing Changsha Dalian Zhengzhou
Table 6: Average growth in retail sales from 2002 to 2012
Average RS 03-07 Average RS 08-12 Average RS 02-12 Beijing 17.1 15.2 16.2 Guangzhou 13.7 18.2 15.9 Changsha 21.3 19.5 20.4 Chengdu 13.9 19.6 16.7 Chongqing 17.0 19.5 18.2 Dalian 11.0 17.7 14.3 Zhengzhou 17.9 18.6 18.2Source: Computed by the author on y-o-y change based on RS data provided by China Briefing for 2002-03 and China’s bureau of statistics from 2004 to 2012.
Despite the fact that the economic model of China is still largely relying on an export-driven strategy, we are not going to spend time on export data series because our data set does not contain large trading cities. The only exception may be Beijing, but available data shows a trade deficit (China Briefing, 2011). Whilst the national capital city had registered strong exports performances, the imports of goods actually had exceeded the outflow, at least for the past decade. Surprisingly, Guangzhou and Dalian only plays a marginal role compared to major trading hubs such as Shenzhen, Shanghai, Suzhou and Dongguan.
Lastly, it is worth taking a look at the sectors contribution to GDP in order to understand the economic structure of both first-tier and second-tier cities (Table 7). Overall, we note a declining trend in the agricultural sector for both categories. In the case of Beijing and Guangzhou, we can see that both have been experiencing deindustrialization in the past decade; the economy of such cities is now predominantly service-oriented. Aside, we observe that most of our second-tier cities are currently in an advanced stage of industrialization. Although the tertiary sector marginally increases for Changsha and Chongqing in the middle of the period, we note a decreasing trend for all our second-tier cities between 2002 and 2012. Actually, rising costs of production and preferential policies may promote industrial relocation from first-tier cities into second-tier cities located in the hinterland. However, the only exception may be Chengdu: While the secondary sector tends to fluctuate, the tertiary sector shows a rising trend. Since Chengdu should become an important city for the economic development of Western China in the upcoming years, the current policies increasingly aims at promoting the tertiary sector and turning the city into a service-oriented economy.
Table 7: Sector contribution to GDP in 202, 2007 and 2012
2002 2007 2012 P% S% T% P% S% T% P% S% T% Beijing 3.1 35.6 61.3 1.1 26.8 72.1 0.8 22.7 76.5 Guangzhou 3.4 41.0 55.5 2.1 39.5 58.4 1.6 34.8 63.6 Changsha 9.9 41.5 48.6 6.3 45.0 48.7 4.3 56.1 39.6 Chengdu 8.4 45.6 46 7.1 45.2 47.7 4.3 46.3 49.5 Chongqing 16 41.9 42.1 11.7 45.9 42.4 8.2 52.4 39.4 Dalian 8.4 47.0 44.6 8.0 49.0 43.0 6.4 51.9 41.6 Zhengzhou 5.0 48.9 46.1 3.2 52.9 43.9 2.6 56.5 41.0 Source: Data provided directly by China Briefing for 2002. For 2007 and 2012, data provided by China’s bureau of statistics and computed by the author on percentage basis from the absolute added value per sector.3. Shanghai as an urban vector for FDI into secondary
cities in the Yangtze River Delta under the context of
globalization
3.1. Conceptual framework & Literature review
3.1.1. Foreign direct investments (FDI)
FDI is a form of cross-border investments from a domestic company into a foreign market, thereof holding a significant share of influence, control and ownership (Investopedia, 2015). Actually, we may distinguish between two types of FDI, namely “greenfield” and “brownfield” investments (de Rooij, 2007). While the former is related to investing and building new assets from the scratch, the latter consists of accessing a foreign market through mergers and acquisitions. For China, we can further classify foreign investments into export-oriented and market-oriented FDI (Strohldreier, 2009; OECD, 2000). On one hand, export-oriented FDI implies investing in activities downstream the value chain. The purpose of such investments is often to relocate labour-intensive or low-added value activities to achieve cost competitiveness. In that case, the main determinants may include labour costs and productivity; natural resources and land endowments; physical, financial and technological infrastructures; and openness to trade and access to international markets (OECD, 2000). On the other side, market-oriented FDI means investing in similar operational structures for business expansion and market penetration (Stohldreier, 2009). Here, GDP size and economic growth are some of the most important factors for such investments (OECD, 2000).
While the impact of FDI on developing countries is often debatable, FDI can generate pushing effects or negative spillover mainly through demonstration effects, competition, labour mobility and input-output relationship (e.g.: Mühlen, 2012; Harris, 2009; Gorodnichenko et al., 2007). Demonstration effects should bring a positive outcome when domestic firms imitate or adapt products, processes and technologies from FDI, but only if those have enough capacities to absorb such resources. Inflow of foreign firms should stimulate better allocation of resources and enhance dynamic and productive efficiency, but competition can be detrimental to domestic enterprises if they do not have the capacities and the means to compete. When foreign companies hire locally and provide training in management, technology and skills, labour mobility can
subsequently help the diffusion of knowledge and capabilities to domestic firms or through entrepreneurship. But inversely, foreign firms may offer higher salaries and benefits, thus “stealing” local talents from domestic firms. And backward-forward linkages refer to the relationship between FDI, and respectively, domestic suppliers or distributors. In one way or the other, foreign companies can boost the productivity of domestic firms by providing technical and managerial assistance (Tanaka & Hashiguchi, 2012), again only if absorptive capacities of domestic firms are strong enough.
The literature review rather provides mixed empirical evidences about FDI spillover in China. Overall, the results can significantly vary across provinces and industries (Argarwal & Milner, 2011). More specific to the YRD, Tanaka and Hashiguchi (2012) find that the average productivity of local enterprises rises by 1.5% with an increase of 10% in FDI. However, Zheng and Huang (2015) demonstrate that positive spillover of FDI has recently weakened with economic development and industrialization progress. Tang and Zhan (2011) find a pretty linear relationship between the flow of information and linkages of corporate headquarters and subsidiaries, thus stimulating regional innovation capacities.
3.1.2. Globalization & Global cities
While the spread of market capitalism has almost become a universal standard (Comaroff, 2001), the progress of information technology and the lowering costs of transportation have drastically reduced the barriers between countries, and have given the opportunity to capital, people, products, and technology to move more freely from one area to another (Rodrigue et al., 2006). Initially, the flux of FDI from transnational corporations has strongly contributed to the global economic integration and restructuring (Chan, 2006), along with a growing demand to handle and manage complex advanced producer services (Codrington, 2005). Hall reintroduced the concept of “world city” in 19665, and characterizes them as leading metropolitan hub
with a strong concentration of advanced financial and producer services and corporate headquarters, sophisticated transportation network with global and local connectivity, engagement for international politics and diplomacy as well as higher degree of consumption and cultural appeal. Although Hall’s legacy has been somewhat influential, it corresponds to a déjà-vu historical form of urbanization without taking into
5 During times of colonialism and European empires, some scholars argue that some
cities actually shared some characteristics of a world city such as Singapore or Shanghai in the 19th century (Mulich, 2014).