Is the Relationship Between Major Depressive Disorder and Self-Reported
Alcohol Use
Disorder an Artificial One?
Stéphanie Baggio1,*, Katia Iglesias2, Joseph Studer3, Marc Dupuis4, Jean-Bernard Daeppen3and Gerhard Gmel3,5,6,7 1
Life Course and Social Inequality Research Centre, University of Lausanne, Geopolis Building, CH-1015 Lausanne, Switzerland,2Centre for the Understanding of Social Processes, University of Neuchâtel, Faubourg de l’Hôpital 27, CH-2000 Neuchâtel, Switzerland,3Alcohol Treatment Centre, Lausanne University
Hospital CHUV, Av. Beaumont 21 bis, Pavillon 2, CH-1011 Lausanne, Switzerland,4Institute of Psychology, University of Lausanne, Geopolis Building, CH-1015 Lausanne, Switzerland,5Addiction Switzerland, Case postale 870, CH-1001 Lausanne, Switzerland,6Centre for Addiction and Mental Health, 250
College Street, Toronto, Ontario M5T 1R8, Canada and7University of the West of England, Frenchay Campus, Coldharbour Lane, Bristol BS16 1QY, UK *
Corresponding author: Life Course and Social Inequality Research Centre, University of Lausanne, Geopolis Building, CH-1015 Lausanne, Switzerland. Tel.: +41-21-692-37-11; E-mail: [email protected]
Abstract — Aims: Many studies have suggested a close relationship between alcohol use disorder (AUD) and major depressive dis-order (MDD). This study aimed to test whether the relationship between self-reported AUD and MDD was artificially strengthened by the diagnosis of MDD. This association was tested comparing relationships between alcohol use and AUD for depressive people and non-depressive people. Methods: As part of the Cohort Study on Substance Use Risk Factors, 4352 male Swiss alcohol users in their early twenties answered questions concerning their alcohol use, AUD and MDD at two time points. Generalized linear models for cross-sectional and longitudinal associations were calculated. Results: For cross-sectional associations, depressive participants reported a higher number of AUD symptoms (β = 0.743, P < 0.001) than non-depressive participants. Moreover, there was an interaction (β = −0.204, P = 0.001): the relationship between alcohol use and AUD was weaker for depressive participants rather than non-depres-sive participants. For longitudinal associations, there were almost no significant relationships between MDD at baseline and AUD at follow-up, but the interaction was still significant (β = −0.249, P < 0.001). Conclusion: MDD thus appeared to be a confounding vari-able in the relationship between alcohol use and AUD, and self-reported measures of AUD seemed to be overestimated by depressive people. This result brings into question the accuracy of self-reported measures of substance use disorders. Furthermore, it adds to the emerging debate about the usefulness of substance use disorder as a concept, when heavy substance use itself appears to be a sensitive and reliable indicator.
INTRODUCTION
The associations between alcohol use disorder (AUD) and major depressive disorder (MDD) are a well-studied topic: many studies have suggested a close relationship between these two major health problems (Blow et al., 2007; Davis et al., 2008; Conner et al., 2009; Boden and Fergusson, 2011). One systematic review (Boden and Fergusson, 2011) reported a moderate association between AUD and MDD, with adjusted odds ratios (OR) ranging from 1.03 to 4.21. Several studies have examined the causal relationship between AUD and MDD. The most plausible explanations have been that:(a) AUD increases the risk of MDD because it induces social difficulties and physical health problems (Foster et al., 1999);(b) the two disorders are linked by common genetic factors (Wang et al., 2004; Kuo et al., 2010); (c) alcohol use causes metabolic changes which increase the risk of MDD (McEachin et al., 2008); (d) individuals with MDD use alcohol as a coping strategy and for mood enhancement (Grant et al., 2009; Young-Wolff et al., 2009); and (e) the stigma associated with AUD worsens later psychiatric disor-ders, including the severity depression (Hatzenbuehler, 2009; Glass et al., 2014).
However, another issue may also explain the relationship between self-reported AUD and MDD: depressive individuals are known to exhibit negative thinking patterns (Ackermann and DeRubeis, 1991; Strunk et al., 2006; Strunk and Adler, 2009), i.e. to have inaccurate and negative views of themselves and their behaviors (Beck, 1967, 1976). Therefore, the judg-ments of depressive people are contaminated by a systematic negative bias: they give inaccurate descriptions of themselves, e.g. self-perception of their competencies, skills and char-acteristics (Greenberg et al., 1992; Whitton et al., 2008).
Depressive people may also be able to make better judgments than non-depressive people under some circumstances (e.g. more accurate perception of task performance, no illusion of control bias), a phenomenon called ‘depressive realism’ (Moore and Fresco, 2012). Therefore, one can wonder whether the asso-ciations between MDD and AUD, in self-reporting studies of the general population, are artificially enhanced because depres-sive individuals rate AUD items according to their negative views of themselves. Indeed, AUD is stigmatized (Schomerus et al., 2011; Rehm et al., 2 0 1 3 ; Glass et al., 2014; Nutt and Rehm, 2014), and thus depressive people may well apply their negative views to this topic, just as they do to other aspects of their lives and personalities.
This study thus aimed to test whether the relationship between s e l f - r e p o r t e d A U D a n d M D D w a s a r tificially strengthened by the diagnosis of MDD; it used a longitudinal design, as recent authors have suggested (Glass et al., 2014). To test the hypoth-esis, a robust and non-stigmatized indicator of AUD was needed and alcohol use itself seemed to be sufficiently accur-ate for this purpose; heavy alcohol use is associated with various measures of AUD (Bohn et al., 1995; Knight et al., 2002). Although alcohol use itself is not included as a criterion in the latest Diagnostic and Statistical Manual of Mental Disorders’ (DSM-5, American Psychiatric Association, 2013) definition of AUD, it is clear that anyone with an AUD diag-nosis consumes alcohol, and previous studies have reported that alcohol use itself should be a suitable criterion in future classifications (Saha et al., 2007; Rehm et al., 2013; Nutt and Rehm, 2014). Moreover, alcohol use alone is not stigmatized in the way that AUD is (Kandel, 1980; O’Grady, 2013; Nutt and Rehm, 2014). Indeed, depending on the population (e.g. youth), drinking alcohol can even be a socially desirable behavior.
If the diagnosis of self-reported AUD is contaminated by MDD diagnosis instead of being a‘real’ association between MDD and AUD—whatever the causal pathway—we would expect: (a) a positive relationship between alcohol use and AUD in non-depressive people, i.e. the more alcohol people drink, the more symptoms of AUD they exhibit; and (b) this relationship to be lower, or even non-existent, in depressive people because of MDD’s confounding effect on this associ-ation. We assumed that this contamination would occur at the same time, i.e. for concurrent MDD diagnosis and self-reported AUD. Thus, we expect that (c) in cross-sectional associations, MDD diagnosis will be associated with an increased number of symptoms of self-reported AUD, but (d) in longitudinal asso-ciations, MDD diagnosis will not predict the number of later symptoms of self-reported AUD.
METHOD Participants and procedures
The data are part of the Cohort Study on Substance Use Risk Factors (C-SURF). C-SURF is a longitudinal study designed to assess substance use patterns among young Swiss men. Participants were enrolled in three of Switzerland’s six army recruitment centers, located in Lausanne (French-speaking), Windisch, and Mels (German-speaking), and covering 21 of the country’s 26 cantons (including all French-speaking ones). Because there is no pre-selection for conscription and participa-tion in the recruitment procedure is obligatory in Switzerland, all Swiss men around 20 years old were eligible for inclusion in the present study. Assessment was carried out outside of the army environment. Indeed, army recruitment centers were used to inform and enroll participants but the study was independent of the army and of eligibility for military service.
Baseline data were collected between September 2010 and March 2012, and follow-up data were collected between January 2012 and April 2013, with an average of 15 ± 2.8 months between the two assessments. A total of 5990 partici-pants filled in the baseline questionnaire; 5223 (87.2%) filled in the follow-up questionnaire. The sample presented in this study focused on alcohol users only (N = 4598). Missing values were deleted listwise, and the final sample consisted of 4352 partici-pants (94.7% of the alcohol users). A previous study about sam-pling and non-response bias by Studer et al. (2013) reported a small non-response bias. Lausanne University Medical School’s Clinical Research Ethics Committee approved the study protocol (No. 15/07).
Measures
DSM-5 alcohol use disorder
AUD was assessed at baseline and follow-up using the 11 cri-teria of alcohol dependence in DSM-5 (American Psychiatric Association, 2013). We used a continuous numbered scale of criteria (from 0 to 11) instead of a cutoff, partly because recent literature assumes alcohol dependence to be a concept with a more continuous dimension to it, rather than a categorical model (Kerridge et al., 2013), and partly because alcohol dependence may not yet have been diagnosed in such young populations.
Alcohol use
Participants completed an extended quantity-frequency (QF) measurement questionnaire of alcohol use at both baseline and follow-up. The extended QF questionnaire captures the vari-ability in drinking habits better than with other instruments (Gmel et al., 2014), providing separate information on week-ends and weekdays over the previous 12 months. Choices for the usual number of weekend drinking days (Friday, Saturday and Sunday) were 3 days, 2 days, or 1 day per weekend, 2–3 weekend days per month, and 1 weekend day or fewer per month. The same style of choices was given for weekday drinking days (Monday to Thursday), with the highest fre-quency category being 4 days per week. Quantities consumed per drinking day (in standard drinks containing ~10–12 g of pure alcohol) were closed-ended (answer categories: 12 drinks or more (coded ‘13’), 9–11 drinks, 7–8 drinks, 5–6 drinks, 3–4 drinks and 1–2 drinks). Midpoints of the categories were used, and the measures were converted into a total number of drinks per week. As the distribution of the extended QF ques-tionnaire was skewed, a log transformation was applied.
We also measured risky single-occasion drinking (RSOD) at baseline and follow-up using the standard measure from the Alcohol Use Disorder Identification Test (AUDIT), i.e. a quantity of six drinks or more on any one occasion in the pre-vious 12 months. Weekly or more frequent RSOD was coded ‘1’, and ‘0’ otherwise.
The age of first alcohol use was also assessed. Depression
The WHO’s Major Depressive Inventory (ICD-10) was used to assess levels of depression at both baseline and follow-up (Bech et al., 2 0 0 1 ; Olsen et al., 2 0 0 3 ). This inventory is a 12-item questionnaire that screens answers on a six-point scale coded from ‘0’ (never) to ‘5’ (all the time). The scoring proced-ure and cutoff described by Bech et al. (2001) were used to define MDD according to DSM-IV, using nine criteria (three criteria use two items and take the higher score of the two). A diagnosis of MDD was coded ‘1’, a n d ‘0’ otherwise.
Demographic covariates
Demographic covariates included language (French- or German-speaking), age, perceived family income as a proxy for level of income (‘below average income’, ‘average income’, ‘above average income’) and level of education attained (‘lower sec-ondary’, ‘upper secondary’, ‘tertiary’).
STATISTICAL ANALYSES
Initial descriptive statistics were calculated, including prevalence rates of MDD and weekly RSOD, medians for the extended QF questionnaire, and means for the number of AUD symptoms.
Cross-sectional and longitudinal relationships were subse-quently tested using generalized linear models (GLM, Poisson regression). A first model regressed the number of AUD symptoms on the extended QF questionnaire (logged), MDD, and the interaction between the extended QF results and MDD. This regression was carried out once for cross-sectional associations (baseline data) and once for longitudinal associa-tions. For longitudinal associations, we adjusted for the number of AUD symptoms at baseline, and we added MDD at
follow-up as a predictor. Extended QF questionnaire was not included in the model because of its collinearity with numbers of AUD symptoms. A second model tested the relationship between MDD and alcohol use, to see if MDD was a predictor of alcohol use. Again, this was calculated once for cross-sectional associations and once for longitudinal associations, adjusting for alcohol use at baseline for the longitudinal model.
All analyses were calculated controlling for age, educational attainment, financial situation, age of onset of alcohol use, RSOD and language (baseline data).
We used two sensitivity analyses: the first one used the con-tinuous score of MDD (logged because the distribution was skewed) instead of the dichotomous diagnosis of MDD, and the second one used a dichotomous variable of alcohol use instead of the continuous number of drinks per week. Drawing on Rehm et al. (2013), a variable with a cutoff of an average of at least 10 g pure alcohol per day was created (i.e. seven drinks a week, coded ‘0’ if participants drank less alcohol than the cutoff, and ‘1’ otherwise). The results were the same as those presented below, with a little less statistical power for dichotomous alcohol use.
All analyses were conducted using SPSS 21 software. RESULTS
Participants’ characteristics
The average age of participants was 19.9 ± 1.2 years old at baseline and 21.2 years old at follow-up. The average age of first alcohol use was 14.4 ± 1.8 years old. A total of 53.2% of participants were French-speaking. At baseline, almost half of the participants had a lower secondary level of education (49.5%), and 27.0% had a tertiary level of education. Only 13.4% had a perceived family income below average income, whereas 46.5% had a perceived family income above it.
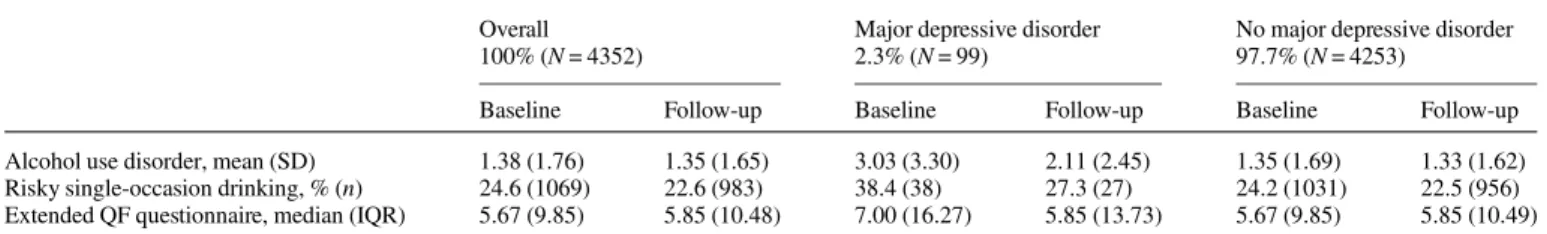
Table 1presents statistics for alcohol-related variables and MDD. Only a small proportion of participants met the criteria
for major depression according to DSM-IV: 2.3% at baseline and 2.5% at follow-up (not shown in Table1). The number of AUD symptoms was quite low: participants reported an average of 1.38 and 1.35 AUD symptoms at baseline and follow-up, respectively. Overall average alcohol use, as mea-sured by the extended QF questionnaire, was less than six drinks a week. However, nearly a quarter of the participants reported weekly or more frequent RSOD.
Associations between alcohol use and AUD controlling for MDD
In cross-sectional associations, all factors were significantly related to the number of AUD symptoms (see Table 2). As expected, the number of AUD symptoms increased as alcohol use increased (β = 0.583, P < 0.001). Depressive people reported a higher number of AUD symptoms (β = 0.743, P < 0.001), and the loading was higher for MDD than for alcohol use. More interestingly, the interaction between MDD and alcohol use was a negative one, meaning that the relationship between alcohol use and the number of AUD symptoms was weaker for depressive people than for non-depressive ones (β = −0.204, P = 0.001).
In longitudinal associations, alcohol use at baseline pre-dicted the number of AUD symptoms at follow-up (β = 0.323, P < 0.001), but MDD at baseline did not predict later AUD (β = 0.017, P = 0.839). However, the interaction was signifi-cant (β = −0.249, P < 0.001). There was also a cross-sectional association between MDD at follow-up and the number of AUD symptoms at follow-up (β = 0.269, P < 0.001).
Associations between alcohol use and MDD
The relationship between alcohol use and MDD was non-significant (not shown in Table 1): MDD did not predict alcohol use for either cross-sectional (β = −0.040, P = 0.631) or longitudinal associations (β = −0.136, P = 0.073).
Table 1. Descriptive statistics
Overall 100% (N = 4352)
Major depressive disorder 2.3% (N = 99)
No major depressive disorder 97.7% (N = 4253)
Baseline Follow-up Baseline Follow-up Baseline Follow-up
Alcohol use disorder, mean (SD) 1.38 (1.76) 1.35 (1.65) 3.03 (3.30) 2.11 (2.45) 1.35 (1.69) 1.33 (1.62)
Risky single-occasion drinking, % (n) 24.6 (1069) 22.6 (983) 38.4 (38) 27.3 (27) 24.2 (1031) 22.5 (956)
Extended QF questionnaire, median (IQR) 5.67 (9.85) 5.85 (10.48) 7.00 (16.27) 5.85 (13.73) 5.67 (9.85) 5.85 (10.49) SD, standard deviation; IQR, interquartile range; QF, quantity/frequency.
Table 2. Adjustedacross-sectional and longitudinal associations of AUD, major depressive disorder and alcohol use
Cross-sectional associations Longitudinal associations
β P-value β P-value
Extended QF questionnaire (logged) 0.583 <0.001 0.323 <0.001
Major depressive disorder 0.743 <0.001 0.017 0.839
Interaction extended QF × major depression −0.204 0.001 −0.249 <0.001
Major depressive disorder (follow-up) – – 0.269 <0.001
DV, dependent variable; AUD, alcohol use disorder; QF, quantity/frequency. a
Adjusted for age, educational attainment, financial situation, onset of alcohol use, RSOD, and language for all models, and also the number of AUD symptoms at baseline for longitudinal associations.
DISCUSSION
This study aimed to test whether MDD distorted self-reported measures of AUD.
First, in both cross-sectional and longitudinal associations, alcohol use measured using the number of drinks per week (i.e. extended QF questionnaire) was a predictor of AUD. This result was in line with previous studies showing both alcohol use and heavy alcohol use to be good indicators of AUD (Bohn et al., 1995; Knight et al., 2002; Saha et al., 2007; Rehm et al., 2013).
Beyond this result, in cross-sectional associations, there was an association between MDD and the number of AUD symp-toms. Depressive participants reported more AUD symptoms than non-depressive participants, which may suggest an over-estimation due to the negative thinking patterns of depressive people.
Moreover, the significant negative interaction between MDD and alcohol use on the number of AUD symptoms showed that the relationship between alcohol use and the number of AUD symptoms was weaker for depressive participants than for non-depressive participants. Being non-depressive weakened the link between alcohol use and AUD, and thus appeared to be a con-founding variable. The fact that MDD was not significantly associated with alcohol use provides further support to this hypothesis.
As mentioned in the introduction, symptoms of AUD are stigmatized (Schomerus et al., 2011; Rehm et al., 2013; Glass et al., 2014; Nutt and Rehm, 2014), whereas alcohol use mea-sured by the number of drinks consumed is not (Kandel, 1980; O’Grady, 2013; Nutt and Rehm, 2014). As depressive people are more likely to share negative and inaccurate views of themselves (Beck, 1967, 1976; Ackermann and DeRubeis, 1991; Strunk et al., 2006; Strunk and Adler, 2009), they may have quoted the criteria for diagnosing AUD in a pessimistic and negative way (i.e. significant positive principal effect of MDD), disconnected from ‘real’ alcohol use (i.e. significant negative interaction between alcohol use and MDD).
In longitudinal associations, there was no principal effect of MDD at baseline on the later number of AUD symptoms at follow-up, whereas MDD at follow-up was associated with concurrent number of AUD symptoms. Therefore, MDD’s association with AUD, as highlighted in cross-sectional com-parisons, was concurrent but not stable over time, even if the significant interaction suggested that previous MDD diagnosis still lowered the association between alcohol use and number of AUD symptoms. This result further supported the idea of a contamination by MDD diagnosis in self-reported surveys with long-term relationships being inconsistent.
This study had some limitations—the most important being that it only included men. To establish whether its findings were consistent for both sexes would require a study including women. Indeed, women are more likely to be depressive than men (Kessler et al., 1993; Piccinelli and Wilkinson, 2000). A second limitation was that no external diagnoses were included in the study. The actual clinical state of the partici-pants would be required to decide whether self-reported AUD is really contaminated by MDD. Further investigations includ-ing both external and self-reported diagnoses are needed. A last limitation was that no direct measure of negative thinking patterns among depressive participants was assessed. Therefore, it is possible that another component of MDD contribute to the
overestimation of self-reported AUD. Future studies may also include a measure of negative thinking pattern.
In conclusion, this study suggested that the relationships between self-reported measures of AUD and MDD were dis-torted by MDD diagnosis. MDD diagnosis appeared as a con-founding variable in the relationship between alcohol use and AUD. Self-reported measures of AUD may be overestimated because of the systematic negative bias and negative thinking patterns of depressive people. This result, therefore, not only questioned the accuracy of self-reported measures of substance use disorders, but it also added to the emerging debate about the usefulness of substance use disorder as a concept, especial-ly when heavy substance use itself appears to be a sensitive and reliable indicator (Rehm et al., 2013; Glass et al., 2014). Labeling drinkers as ‘dependent’ may thus not be the best way to detect alcohol-related problems, reduce the burden of disease associated with alcohol use, and cure patients.
Funding— This work was supported by Swiss National Science Foundation (grant number FN 33CS30_139467).
Conflict of interest statement. None declared.
REFERENCES
Ackermann R, DeRubeis RJ. (1991) Is depressive realism real? Clin Psychol Rev 11:565–84.
Association AP. (2013) Diagnostic and Statistical Manual of Mental Disorders. Arlington, VA: American Psychiatric Publishing. Bech P, Rasmussen NA, Olsen LR et al. (2001) The sensitivity and
specificity of the Major Depression Inventory, using the Present State Examination as the index of diagnostic validity. J Affect Disord 66:159–64.
Beck AT. (1967) Depression: Clinical, Experimental, and
Theoretical Aspects. Philadelphia: University of Pennsylvania Press.
Beck AT. (1976) Cognitive Therapy and Emotional Disorders. New York: International University Press.
Blow FC, Serras AM, Barry KL. (2007) Late-life depression and alcoholism. Curr Psychiatry Rep 9:14–9.
Boden JM, Fergusson DM. (2011) Alcohol and depression. Addiction 106:906–14.
Bohn MJ, Babor TF, Kranzler HR. (1995) The Alcohol Use Disorders Identification Test (AUDIT): validation of a screening instrument for use in medical settings. J Stud Alcohol Drugs 56:423–32.
Conner KR, Pinquart M, Gamble SA. (2009) Meta-analysis of de-pression and substance use among individuals with alcohol use disorders. J Subst Abuse Treat 37:127–37.
Davis L, Uezato A, Newell JM et al. (2008) Major depression and comorbid substance use disorders. Curr Opin Psychiatry 21:14–8. Foster T, Gillespie K, McClelland R et al. (1999) Risk factors for suicide independent of DSM-III-R Axis I disorder. Case-control psychological autopsy study in Northern Ireland. Br J Psychiatry 175:175–79.
Glass JE, Williams EC, Bucholz KK. (2014) Psychiatric comorbidity and perceived alcohol stigma in a nationally representative sample of individuals with DSM-5 alcohol use disorder. Alcohol Clin Exp Res 38:1697–705.
Gmel G, Studer J, Deline S et al. (2014) More is not always better-comparison of three instruments measuring volume of drinking in a sample of young men and their association with consequences. J Stud Alcohol Drugs 75:880–88.
Grant VV, Stewart SH, Mohr CD. (2009) Coping-anxiety and coping-depression motives predict different daily mood-drinking relationships. Psychol Addict Behav 23:226–37.
Greenberg J, Pyszczynski T, Burling J et al. (1992) Depression, self-focused attention, and the self-serving attributional bias. Pers Individ Dif 13:959–65.
Hatzenbuehler ML. (2009) How does sexual minority stigma ‘get under the skin’? A psychological mediation framework. Psychol Bull 135:707–30.
Kandel DB. (1980) Drug and drinking behavior among youth. Annu Rev Sociol 6:235–85.
Kerridge BT, Saha TD, Gmel G et al. (2013) Taxometric analysis of DSM-IV and DSM-5 alcohol use disorders. Drug Alcohol Depend 129:60–9.
Kessler RC, McGonagle KA, Swartz M et al. (1993) Sex and depres-sion in the National Comorbidity Survey. I: lifetime prevalence, chronicity and recurrence. J Affect Disord 29:85–96.
Knight JR, Wechsler H, Kuo M et al. (2002) Alcohol abuse and de-pendence among U.S. college students. J Stud Alcohol 63:263–70.
Kuo P-H, Neale MC, Walsh D et al. (2010) Genome-wide linkage scans for major depression in individuals with alcohol depend-ence. J Psychiatr Res 44:616–19.
McEachin RC, Keller BJ, Saunders EFH et al. (2008) Modeling gene-by-environment interaction in comorbid depression with alcohol use disorders via an integrated bioinformatics approach. BioData Min 1:2–13.
Moore MT, Fresco DM. (2012) Depressive realism: a meta-analytic review. Clin Psychol Rev 32:496–509.
Nutt DJ, Rehm J. (2014) Doing it by numbers: a simple approach to reducing the harms of alcohol. J Psychopharmacol 28:3–7. O’Grady MA. (2013) Alcohol self-presentation: the role of
impres-sion motivation and impresimpres-sion construction. J Appl Soc Psychol 43:854–69.
Olsen LR, Jensen DV, Noerholm V et al. (2003) The internal and ex-ternal validity of the Major Depression Inventory in measuring se-verity of depressive states. Psychol Med 33:351–56.
Piccinelli M, Wilkinson G. (2000) Gender differences in depression. Critical review. Br J Psychiatry 177:486–92.
Rehm J, Marmet S, Anderson P et al. (2013) Defining substance use disorders: do we really need more than heavy use? Alcohol Alcohol 48:633–40.
Saha TD, Stinson FS, Grant BF. (2007) The role of alcohol consump-tion in future classificaconsump-tions of alcohol use disorders. Drug Alcohol Depend 89:82–92.
Schomerus G, Lucht M, Holzinger A et al. (2011) The stigma of alcohol dependence compared with other mental disorders: a review of population studies. Alcohol Alcohol 46:105–12. Strunk DR, Adler AD. (2009) Cognitive biases in three prediction
tasks: a test of the cognitive model of depression. Behav Res Ther 47:34–40.
Strunk DR, Lopez H, DeRubeis RJ. (2006) Depressive symptoms are associated with unrealistic negative predictions of future life events. Behav Res Ther 44:861–82.
Studer J, Baggio S, Mohler-Kuo M et al. (2013) Examining non-response bias in substance use research—are late respondents proxies for non-respondents? Drug Alcohol Depend 132:316–23. Wang JC, Hinrichs AL, Stock H et al. (2004) Evidence of common
and specific genetic effects: association of the muscarinic acetyl-choline receptor M2 (CHRM2) gene with alcohol dependence and major depressive syndrome. Hum Mol Genet 13:1903–11. Whitton SW, Larson JJ, Hauser ST. (2008) Depressive symptoms
and bias in perceived social competence among young adults. J Clin Psychol 64:791–805.
Young-Wolff KC, Kendler KS, Sintov ND et al. (2009) Mood-related drinking motives mediate the familial association between major depression and alcohol dependence. Alcohol Clin Exp Res 33:1476–86.