VIII. APPLIED PLASMA RESEARCH
D. Laser-Plasma Interactions
Academic and Research Staff
Prof. E. V. George Prof. H. A. Haus J. J. McCarthy Prof. A. Bers Dr. P. A. Politzer W. J. Mulligan
Graduate Students
Y. Manichaikul W. A. Stiehl C. W. Werner
D. Prosnitz D. Wildman
1. FORCED MODE LOCKING AND CAVITY DUMPING OF A TEA CO2 LASER
Mode locking of a TEA CO2 laser has been achieved through the use of a germanium
intracavity acoustic loss modulator ' resulting in a train of roughly 12 pulses, each ~1 ns wide and spaced 25 ns apart. For many experimental applications a single nano-second pulse rather than a train of pulses is desired. Single pulses ~20 ns wide have been produced by cavity dumping of a spontaneously self-pulsed CO2 laser. 3- 5 We
report the production of single nanosecond pulses < 4 ns wide by means of simultaneously mode locking and cavity dumping a TEA CO2 laser.
Figure VIII-1 shows the experimental arrangement. The cavity is 3. 8 m long. It
APERTURE PIN -RESISTOR
DISCHARGE TUBE T 8%
Ge:Au HIGH-VOLTAGE
/C
DETECTOR TRIGGERINGHe:N 2:CO2
Ge POLARIZER GaAs Ge MODULATOR
- -- - - - -- - - - -" R
99.6%
/ APERTURE R99.6%
/
Fig. VIII-1. Experimental arrangement for mode locking and cavity dumping in the TEA CO2 laser.
This work was supported by the National Science Foundation (Grant GK-33843).
(VIII. APPLIED PLASMA RESEARCH)
has one pin-resistor discharge tube6filled with a flowing gas mixture of He: N2: CO2
operating at 200 Torr, an antireflection-coated germanium acoustic loss modulator, a GaAs crystal, and a Brewster-angle Ge plate polarizer. One end mirror is flat and 99. 6% reflecting. The other end mirror is 8%o transmitting, 92%o reflecting, and its radius of curvature is 4 m.
When 2 W of RF driving power at 18. 7 MHz was supplied to the germanium acoustic loss modulator, mode locking of the laser was observed. The germanium modulator has acoustic resonance frequencies that occur at intervals of 210 kHz. Acoustic waves were generated by a LiNbO3 transducer. The 18. 7 MHz RF driving frequency is an acoustic
resonance frequency of the germanium modulator and corresponds to an optical length of -4. 0 m for the cavity. (Optical length L =
f
n dI, where n is the index of0 0
reflection, L is the physical length of the cavity, and integration is performed from one end mirror to the other along the optical path inside the cavity.)
Eight percent of the power inside the cavity was transmitted through an end mirror to a gold-doped germanium detector at a temperature of 77°K. Signals from this
detector were used to trigger a high-voltage supply for the GaAs crystal, thereby con-verting it into a quarter-wave plate.3
' 4
The polarization of the radiation reflected from the flat end mirror was rotated 900, thereby causing 80% of the power to be reflected off the germanium Brewster-angle polarizer and out of the cavity. The dumped pulse passed through calibrated attenuators and was detected by a copper-doped germanium detector at 4°K. The triggering level and delay time can be adjusted so that the GaAs crystal is converted into a quarter-wave plate when the radiation inside the cavity is maximum.
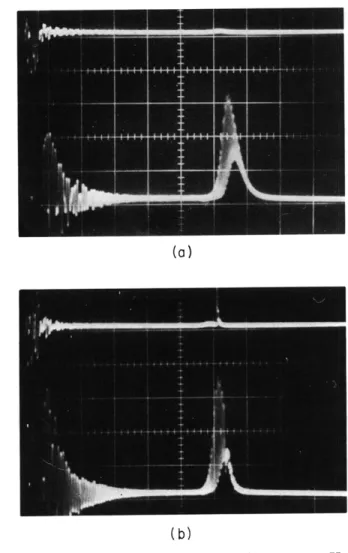
Figure VIII-2 shows the display on a dual-trace Tektronix 556 oscilloscope. The upper traces are signals from the copper-doped germanium detector, representing the power reflected off the germanium Brewster-angle polarizer. The lower traces are signals from the gold-doped germanium detector and illustrate the building up of power inside the cavity. Figure VIII-2a shows signals from the two detectors when the high-voltage power supply for the GaAs crystal was turned off. Forced mode locking of the laser can be seen from the lower trace in Fig. VIII-2a. The combined rise time of
gold-doped germanium detector and oscilloscope is >10 ns which is comparable to the round-trip time of the cavity (-25 ns) and is much greater than the width of the mode-locked pulses (<4 ns). A small reflection from the germanium Brewster-angle polarizer can be seen on the upper trace in Fig. VIII-2a. Figure VIII-2b shows signals from the two detectors when the high-voltage power supply for the GaAs crystal was turned on. The lower trace in Fig. VIII-2b shows initial forced mode locking, then cavity dumping and rebuilding of radiation inside the cavity. A very sharp mode-locked and cavity-dumped pulse can be seen as the upper trace in Fig. VIII-2b.
Figure VIII-3 is a Tektronix 454A oscilloscope display of a typical mode-locked and
Fig. VIII-2.
Fig. VIII-3.
(b)
Display on a dual-trace oscilloscope. Upper traces are
signals from the Ge: Cu(Sb) detector.
Lower traces
are signals from the Ge: Au detector. Scale:
1
ps/div.
(a) No cavity dumping.
(b) Cavity dumping.
Typical mode-locked and cavity-dumped pulse with
peak power ~1 kW.
Scale: 10 ns/div.
QPR No. 107
(VIII. APPLIED PLASMA RESEARCH)
cavity-dumped pulse. The pulse was detected by the copper-doped germanium detector with a rise time of -1 ns. The oscilloscope has a rise time of ~2.5 ns. The pulse width on the oscilloscope was 4 ns for the cavity-dumped pulse. It has been reported2 that a train of 1-ns pulses had been obtained by supplying only 0. 5 W of driving power to a germa-nium acoustic -loss modulator. Therefore we believe that the pulse width of our mode -locked and cavity-dumped pulse must be much smaller than 4 ns and the power higher than 1 kW.
Y. Manichaikul, E. E. Stark, Jr.
References
1. R. L. Abrams and D. A. Pinnow, J. Appl. Phys. 41, 2765 (1970).
2. 0. R. Wood, R. L. Abrams, and T. J. Bridges, Appl. Phys. Letters 17, 376 (1970).
3. T. J. Bridges and P. K. Cheo, Appl. Phys. Letters 14, 262 (1969).
4. E. E. Stark, Jr., and P. W. Hoff, Quarterly Progress Report No. 105, Research Laboratory of Electronics, M. I. T., April 15, 1972, pp. 77-79.
5. E. E. Stark, Jr., Ph. D. Thesis, Department of Electrical Engineering, M.I. T., September 1972, pp. 69-71.
6. D. L. Lyon, Quarterly Progress Report No. 104, Research Laboratory of Elec-tronics, M.I.T., January 15, 1972, pp. 135-138.