All-Optical Electrophysiology Reveals the Role of Lateral
Inhibition in Sensory Processing in Cortical Layer 1
The MIT Faculty has made this article openly available.
Please share
how this access benefits you. Your story matters.
Citation
Fan, Linlin Z. et al. “All-Optical Electrophysiology Reveals the Role
of Lateral Inhibition in Sensory Processing in Cortical Layer 1.” Cell,
180, 3 (February 2020): 521–535.e18 © 2020 The Author(s)
As Published
10.1016/J.CELL.2020.01.001
Publisher
Elsevier BV
Version
Author's final manuscript
Citable link
https://hdl.handle.net/1721.1/130423
Terms of Use
Creative Commons Attribution-NonCommercial-NoDerivs License
All-optical electrophysiology reveals the role of lateral inhibition
in sensory processing in cortical layer 1
Linlin Z. Fan1, Simon Kheifets1, Urs L. Böhm1, Hao Wu1, Kiryl D. Piatkevich2, Michael E. Xie1, Vicente Parot1, Yooree Ha1, Kathryn E. Evans3, Edward S. Boyden2, Anne E.
Takesian3,4, Adam E. Cohen1,5,6,7,*
1Department of Chemistry and Chemical Biology, Harvard University, Cambridge, MA, USA 2Media Lab and McGovern Institute for Brain Research, Massachusetts Institute of Technology
(MIT), Cambridge, MA, USA
3Harvard Medical School, Boston, USA
4Massachusetts Eye and Ear Infirmary, Boston, USA
5Department of Physics, Harvard University, Cambridge, MA USA 6Howard Hughes Medical Institute
7Lead Contact
Abstract
Cortical layer 1 (L1) interneurons have been proposed as a hub for attentional modulation of underlying cortex, but the transformations that this circuit implements are not known. We combined genetically targeted voltage imaging with optogenetic activation and silencing to study the mechanisms underlying sensory processing in mouse barrel cortex L1. Whisker stimuli evoked precisely timed single spikes in L1 interneurons, followed by strong lateral inhibition. A mild aversive stimulus activated cholinergic inputs and evoked a bimodal distribution of spiking responses in L1. A simple conductance-based model that only contained lateral inhibition within L1 recapitulated the sensory responses and the winner-takes-all cholinergic responses, and correctly predicted that the network would function as a spatial and temporal high-pass filter for
*Correspondence to: cohen@chemistry.harvard.edu.
Author contributions: L.Z.F., A.E.T. and A.E.C. conceived and designed the study. L.Z.F. designed and conducted all the
experiments except for patch clamp, built the optical system, programmed the software, analyzed the data, constructed conductance-based model, performed network simulations and co-wrote the manuscript. S.K. and H.W. built the optical system in early stage. U.B. performed simulations of passive membrane model and data fitting. K.D.P. performed patch clamp for SomArchon. K.D.P. and E.S.B. shared SomArchon. M.E.X. helped analyze the data and performed simulations of composite movies. V.P. helped with slice experiments. Y.H. performed patch clamp for GtACR2. K.E.E. helped clone GtACR2. A.E.C. performed network simulations, supervised the research and co-wrote the manuscript with input from A.E.T..
Publisher's Disclaimer: This is a PDF file of an unedited manuscript that has been accepted for publication. As a service to our
customers we are providing this early version of the manuscript. The manuscript will undergo copyediting, typesetting, and review of the resulting proof before it is published in its final form. Please note that during the production process errors may be discovered which could affect the content, and all legal disclaimers that apply to the journal pertain.
Declaration of interests: A.E.C. is a founder of Q-State Biosciences and is on the scientific advisory board. A.E.C., L.Z.F and S.K.
have filed a patent on the imaging system.
HHS Public Access
Author manuscript
Cell
. Author manuscript; available in PMC 2021 February 06.Published in final edited form as:
Cell. 2020 February 06; 180(3): 521–535.e18. doi:10.1016/j.cell.2020.01.001.
A
uthor Man
uscr
ipt
A
uthor Man
uscr
ipt
A
uthor Man
uscr
ipt
A
uthor Man
uscr
ipt
excitatory inputs. Our results demonstrate that all-optical electrophysiology can reveal basic principles of neural circuit function in vivo and suggest an intuitive picture for how L1 transforms sensory and modulatory inputs.
Graphical Abstract
In brief
By simultaneously combining genetically targeted voltage imaging with optogenetic modulation of neuronal activity, Fan et al. demonstrate that all-optical electrophysiology in awake animals can be a powerful tool for revealing hidden principles of neural circuit function.
Keywords
Layer 1; barrel cortex; lateral inhibition; acetylcholine; optical electrophysiology; E/I balance
Introduction
The brain receives myriad sensory inputs. It must distinguish the relevant from the irrelevant. An input can merit attention either through its intrinsic properties (novelty, salience) or through learned associations. The sparse interneurons of neocortical Layer 1 (L1) have been hypothesized as a hub for integrating these factors and modulating the underlying cortex to gate sensory processing (Jiang et al., 2013; Letzkus et al., 2011; Takesian et al., 2018). L1 interneurons receive thalamic (Cruikshank et al., 2012; Takesian et
A
uthor Man
uscr
ipt
A
uthor Man
uscr
ipt
A
uthor Man
uscr
ipt
A
uthor Man
uscr
ipt
al., 2018; Zhu, 2004), cortico-cortical (Lee et al., 2013; Palmer et al., 2012), and
neuromodulatory (cholinergic (Letzkus et al., 2011; Poorthuis et al., 2018; Takesian et al., 2018), serotonergic (Lee et al., 2010; Poorthuis et al., 2018) and adrenergic (Lam and Sherman, 2019)) inputs. The primary outputs of L1 appear to be via inhibition of deeper-lying interneurons and thereby dis-inhibition of pyramidal neurons (Jiang et al., 2013; Lee et al., 2013; Letzkus et al., 2011; Takesian et al., 2018), and via inhibition of apical dendrites of deeper layer pyramidal cells (Abs et al., 2018; Lee et al., 2015; Takesian et al., 2018). Electrophysiological, genetic, and anatomical studies have identified four sub-types of interneurons within L1 (Schuman et al., 2018). These cells fall into two broad classes (Jiang et al., 2015). Laterally projecting neurogliaform cells primarily synapse within L1 and show late-spiking non-adapting firing pattern in acute slices (Cadwell et al., 2016; Chu et al., 2003; Cruikshank et al., 2012; Schuman et al., 2018). Downward projecting single bouquet-like cells primarily dis-inhibit underlying pyramidal neurons and show a non-late spiking adapting firing pattern (Jiang et al., 2013; Lee et al., 2013; Letzkus et al., 2011; Takesian et al., 2018). It is not known how these properties combine in awake animals to transform L1 inputs to outputs. Indeed, the function of L1 has been called a “crowning mystery” (Schuman et al., 2018).
L1 is unique among cortical layers for having purely inhibitory short-range connectivity. In mutually inhibitory networks, competition between concurrently activated units can lead to winner-takes-all or point-attractor dynamics (Koyama et al., 2016). This motif has been proposed as a general means to implement multiple forced-choice calculations, i.e. in which small disparities in excitatory inputs are amplified to select one among multiple possible firing modes (Machens et al., 2005). Considering the proposed role of L1 in gating sensory processing—where multiple inputs compete for attention—it is interesting to ask what kinds of dynamics arise in this circuit in vivo.
Electrophysiological studies in L1 in vivo have been challenging due to the sparseness of neuronal cell bodies. While a few whole-cell patch clamp recordings have been performed in anesthetized rats (Egger et al., 2015; Jiang et al., 2013; Zhu, 2004), technical difficulties prevented similar acquisitions in awake animals. Recent advances in genetically encoded voltage indicators (GEVIs) enabled voltage imaging with single-neuron, single-spike resolution in vivo in near-surface neurons (Abdelfattah et al., 2019; Adam et al., 2019; Piatkevich et al., 2019; Villette et al., 2019). Paired expression of near infrared GEVIs based on Archaerhodopsin 3 (Arch) (Kralj et al., 2012) with blue-excited channelrhodopsin actuators enabled optical measurements of excitability in vivo (Optopatch) (Adam et al., 2019; Lou et al., 2016) and of synaptic transmission in primary culture and acute slices (Fan et al., 2018). These advances open the possibility for optical explorations of L1 circuit function in awake animals.
Using a holographic structured illumination imaging system and a recently developed soma-localized GEVI derived from Arch, SomArchon (Piatkevich et al., 2019), we probed the circuit function of L1 interneurons in barrel cortex of awake mice. We developed an all-optical technique to resolve the separate contributions of excitatory and inhibitory synaptic inputs to membrane potential. Experiments with patterned optogenetic activation and
A
uthor Man
uscr
ipt
A
uthor Man
uscr
ipt
A
uthor Man
uscr
ipt
A
uthor Man
uscr
ipt
silencing, paired with voltage imaging, revealed that strong lateral inhibition within the L1 microcircuit plays a dominant role in setting the network responses to sensory and
neuromodulatory inputs. Mutual inhibition led to high-pass temporal and spatial filtering of excitatory inputs, while under strong cholinergic drive the circuit showed winner-takes-all attractor dynamics.
A simple conductance-based model that incorporates the known electrophysiology and connectivity of L1 interneurons captured the main features of our sensory and
neuromodulatory data and predicted responses to several types of inputs which we tested experimentally. The model also predicted that the sensitivity of the L1 microcircuit to thalamic inputs should show an inverted-U dependence on cholinergic drive, a prediction which can be tested in future experiments.
Results
In vivo voltage imaging with holographic patterned illumination
We analyzed the sources of signal and noise in optical voltage recordings with the goal to achieve millivolt-sensitivity recordings of subthreshold dynamics in vivo. Voltage signals in tissue arise solely from the neuronal membrane. In epifluorescence images, the soma perimeter appeared brighter than the center, a geometrical projection effect from viewing membranes edgeon. We thus reasoned that incident photons would most efficiently produce signal if targeted to the soma perimeter. Confocal-like excitation combined with spatially filtered emission also minimized optical crosstalk from out-of-focus cells.
We built a holographic structured illumination system, similar to Ref. (Lutz et al., 2008), to achieve this precisely targeted illumination with red (λ = 639 nm) light for excitation of SomArchon (Fig. 1A, Table S1, Methods and Methods S1). SomArchon fluorescence from all holographically targeted spots was recorded simultaneously on a scientific CMOS camera. All recordings were performed at a 1 kHz frame rate. Spatial filters were applied digitally in postprocessing to separate signal from background (Methods). A digital micromirror device (DMD) patterned blue illumination for targeted optogenetic stimulation (Fig. 1A, Table S1, Methods S1).
We characterized the performance of the imaging system in cortical L1 and superficial L2/3 in vivo (Methods). Under wide-field red illumination, SomArchon-expressing neurons were not visible due to high background from scattered and out-of-focus light (Fig. 1B).
Illumination targeted to the somas revealed individual cells (Fig. 1B, Methods S1).
Holographic membrane focal illumination significantly improved the signal-to-noise ratio of optically detected spikes (spike amplitude:baseline noise in a 1 kHz bandwidth 11.4 ± 1.4 membrane focal vs. 7.5 ± 1.3 whole soma, mean ± s.e.m., paired measurements in n = 10 cells, matched laser power per cell between illumination patterns; Fig. 1C).
A challenge with 1-photon voltage imaging is to ensure that the fluorescence ascribed to each cell is not contaminated by crosstalk from other simultaneously imaged cells or from out-of-focus background. To characterize crosstalk between in-focus cells, we quantified the fluorescence signal (spike amplitude) in concentric rings centered on individual
A
uthor Man
uscr
ipt
A
uthor Man
uscr
ipt
A
uthor Man
uscr
ipt
A
uthor Man
uscr
ipt
holographically illuminated cells (Fig. S1). At 6 μm from the cell boundary, signal amplitude decayed to 7 ± 6% of the on-cell signal (mean ± s.d., n = 4 cells), and was undetectable (< 1% of on-cell signal) at 20 μm from the boundary.
To characterize out-of-focus crosstalk, we recorded from individual cells as a function of optical defocus. With membrane focal illumination, fluorescence amplitude decayed by 50% over 15 μm deeper defocus, but more slowly with shallower defocus, whereas with whole-soma illumination this fluorescence decay was ~two-fold slower (Fig. S1).
We used activity-based image segmentation to remove residual out-of-focus crosstalk. A penalized matrix decomposition algorithm separated true voltage signals from crosstalk based on the different spatial profiles of these two signal sources (Buchanan et al., 2018). Application of the algorithm to simulated data with realistic noise (Adam et al., 2019), and to composite movies where optical crosstalk was inserted ‘by hand’ confirmed that the extracted signals were highly robust to crosstalk (Fig. S1, Methods).
Finally, we used simultaneous patch clamp and fluorescence measurements in acute slices to assess the precision of the optical voltage measurements. Optical and electrical recordings showed close correspondence, both for spikes and subthreshold events (Fig. S1).
The holographic optical system enabled high-resolution recordings in several genetically defined cell types across L1 and superficial L2/3 in awake head-fixed mice (Fig. 1D). 5HT3AR-Cre transgenic mice expressed primarily in L1 interneurons (Lee et al., 2010; Takesian et al., 2018); somatostatin (SST)-Cre transgenic mice expressed in interneurons in deeper layers (Neske et al., 2015); and CKII(0.4)-Cre virus drove dense pan-neuronal expression in wild-type mice. In all three populations, two-photon fluorescence images of an appended eGFP tag showed membrane-localized and somatically restricted expression (Fig. S1).
Action potentials were recorded with SNR 12 ± 4 (mean ± s.d., n = 16 cells) throughout L1 at depths between 20 and 150 μm at a mean laser power of 3 mW/cell. In SST-Cre mice optical recordings were made in superficial L2/3 (100 – 230 μm depth) with SNR 9 ± 4 (mean ± s.d., n = 6 cells). Fig. 1D shows a recording at depth of ~230 μm with SNR 7. SNR was approximately two-fold greater for near-surface neurons (< 100 μm depth, 14 ± 4, mean ± s.d., n = 22 neurons) than at 150 – 200 μm (8 ± 3, mean ± s.d., n = 7 neurons, Fig. 1E). We imaged multiple neurons simultaneously to a depth of 150 μm (Fig. 1D).
For an SNR of 7 and a spike-detection threshold set at 4σ above the baseline noise, the expected positive rate is < 0.3 spikes per 10 s recording, and the expected false-negative rate (missed spikes) is < 0.14% of true spikes (Methods). We used the refractory period after true spikes to test the false-positive rate. A spike-triggered autocorrelogram showed a probability < 10−3 of two spikes occurring within 5 ms of each other (n = 27 cells, Fig. 1F), confirming the physiological origin of the detected spikes.
Simultaneous optogenetic perturbations and voltage imaging: Optopatch and i-Optopatch Next, we sought to combine optogenetic perturbations (activation and silencing) with simultaneous voltage imaging. For optogenetic activation, we paired SomArchon with a blue
A
uthor Man
uscr
ipt
A
uthor Man
uscr
ipt
A
uthor Man
uscr
ipt
A
uthor Man
uscr
ipt
light-activated soma-localized channelrhodopsin, SomCheRiff (Adam et al., 2019; Fan et al., 2018; Hochbaum et al., 2014). This channelrhodopsin has previously been shown to have negligible activation at the 639 nm wavelength used to excite Arch-derived GEVIs (Hochbaum et al., 2014). For co-expression in vivo, we made a Cre-dependent bicistronic AAV construct which we called Optopatch4.
In awake head-fixed 5-HT3AR-Cre mice expressing Optopatch4, single-cell targeted optogenetic stimulation through a cortical window (I = 1.8 - 21 mW/mm2) evoked sustained spiking which was clearly resolved via holographically targeted voltage imaging (Fig. 1G, H). Measurements using laterally offset spots showed little crosstalk of stimulation to surrounding cells, which had a mean spacing of ~60 μm (Meyer et al., 2013) (Fig. S2). Optogenetic silencing can be a powerful tool to determine the roles of specific neural populations in network dynamics, but optogenetic silencing has not previously been paired with voltage imaging. The action spectrum of a soma-localized blue-shifted chloride channel, stGtACR2 (Mahn et al., 2018) suggested it could be spectrally orthogonal to SomArchon. In human embryonic kidney (HEK293) cells expressing stGtACR2, blue light (I = 0.2 – 1 mW/mm2) evoked large inhibitory photocurrents (~0.5 nA), but red light at intensities used for voltage imaging (635 nm, 0.1 – 10 W/mm2) did not induce observable photocurrents, nor did it impair blue light-mediated channel gating (Fig. S3). Thus
SomArchon and stGtACR2 constitute a spectrally orthogonal pair appropriate for inhibitory Optopatch (i-Optopatch).
In head-fixed awake mice expressing i-Optopatch in L1 (Methods), targeted optogenetic stimuli (I = 1.8 - 21 mW/mm2) inhibited spontaneous spiking (spontaneous spike rate 3.2 ± 0.7 Hz vs. 0.4 ± 0.3 Hz with blue light at I = 1.8 mW/mm2, p = 3 × 10⁻³, two-sided paired-sample t-test, Fig. 1I, K). Optogenetic stimulation also hyperpolarized resting membrane potential by - 13.5 ± 4% of spike height (mean ± s.e.m., n = 14 neurons, I = 1.8 mW/mm2, 2 mice, Fig. 1J, K). These results establish i-Optopatch as a tool for assessing how targeted optogenetic silencing affects network dynamics.
Whisker stimulation evoked excitation followed by inhibition in L1
We used this suite of tools to dissect the circuit function of L1 during sensory processing (Fig. 2A, B). We first characterized the intrinsic excitability properties of L1 neurons. In acute slices from 5HT3AR-Cre mice expressing Optopatch4, single-cell L1-targeted optogenetic stimuli evoked characteristic firing patterns, including bursting adapting and late-spiking non-adapting phenotypes, as previously reported (Chu et al., 2003), though not all neurons had a clear classification (Fig. S4). Neurons recorded in vivo sequentially under isoflurane anesthesia and then wakefulness showed characteristic firing patterns preserved between the two brain states (Fig. S4). The in vivo recordings did not clearly resolve into distinct sub-classes based on firing patterns, consistent with prior results (Cadwell et al., 2016; Chu et al., 2003). We therefore treated all 5-HT3AR-positive neurons measured in vivo as a single population.
Next, we used voltage imaging to characterize the sensory-evoked responses in L1 interneurons. Barrel fields corresponding to individual whiskers (B2, C2, D2) were
A
uthor Man
uscr
ipt
A
uthor Man
uscr
ipt
A
uthor Man
uscr
ipt
A
uthor Man
uscr
ipt
identified by intrinsic imaging (Fig. S5, Methods). In mice anesthetized with isoflurane and in awake mice, brief stimuli to individual whiskers (~1 mm deflection, ~8 mm from the base, 20 ms duration, repeated at 0.5 Hz, Methods) elicited excitatory post-synaptic potentials (EPSPs) and often single spikes in L1 neurons in the corresponding barrel fields (Fig. 2C, D). Whisker stimuli were substantially more effective in eliciting spikes in anesthetized mice than in awake mice (anesthetized: 135 spikes from 153 trials, n = 24 cells vs. awake: 73 spikes from 126 trials, n = 24 cells), consistent with prior studies in other cortical layers (Haider et al., 2013).
The delay from stimulus onset to spike peak was 16 ± 2 ms in anesthetized mice (mean ± s.d., n = 135 events, 24 neurons, 3 mice, Fig. 2E) and 16 ± 3 ms in awake mice (mean ± s.d., n = 73 events, 21 neurons, 3 mice, Fig. S5). Similar delay and jitter were previously reported in L4 pyramidal and fast-spiking neurons, both of which receive direct thalamic inputs (Gabernet et al., 2005). To assess how much of the jitter reflected variation in input timing vs. variation in the intrinsic responses of individual L1 neurons, we then compared the relative delay in spike time between simultaneously recorded pairs of neurons in
anesthetized mice. The mean relative delay was 0.9 ms (n = 14 pairs, 66 trials in which both cells spiked, Fig. 2E). Remarkably, despite the small delay, the order of firing was preserved in all pairs in all trials, to within our 1 ms time resolution, i.e. if cell A fired before cell B in a single trial, then cell A fired before cell B in all trials. These observations indicate that abrupt sensory inputs drove millisecond-precision spike sequences in L1.
We observed striking differences in the subthreshold dynamics between spontaneous vs. whisker-evoked spikes, in both anesthetized and awake animals. Spike-triggered average (STA) waveforms of spontaneous spikes rode atop a baseline depolarization that both preceded and followed the spike, whereas whisker-evoked spikes arose abruptly and were followed by a period of hyperpolarization (Fig. 2F, G). Stimulus-triggered average waveforms of whisker deflection trials that did not induce spikes also showed a
depolarization followed by a hyperpolarization (Fig. S5). Together, these results implied that whisker stimulus evoked synaptic excitation followed by synaptic inhibition.
Consistent with this hypothesis, we found that in awake animals, whisker stimulation evoked single spikes and then transiently suppressed spontaneous L1 activity (before stimulus firing rate: 3.6 ± 0.85 Hz; 30 to 105 ms post-stimulus: 1.2 ± 0.65 Hz, mean ± s.e.m., n = 24 cells p = 0.004, Kruskal-Wallis test, Fig. 2H). Sensory-evoked network suppression was particularly apparent when the sensory stimulus fortuitously arrived during a burst of spontaneous activity (Fig. 2H).
Sensory-evoked network suppression also affected subsequent sensory-evoked responses. When a whisker was subjected to a series of 20 ms deflections at 10 Hz in an anesthetized mouse, the response to the second stimulus was undetectable, while the mean responses to the third and fourth stimuli were ~75% of the response to the first stimulus (Fig. S5). While this observation might be explained by effects upstream of L1, it is also consistent with rapid sensory-evoked inhibition onto L1.
A
uthor Man
uscr
ipt
A
uthor Man
uscr
ipt
A
uthor Man
uscr
ipt
A
uthor Man
uscr
ipt
Optical dissection of sensory-evoked excitation and inhibition
We developed an all-optical technique to resolve the distinct contributions of excitatory and inhibitory synaptic inputs to sensory-evoked responses. Rapid inhibition is mediated by GABAA receptors, ligand-gated chloride channels with a reversal potential of ~−70 mV. L1 interneurons in anesthetized rats have been reported to rest at −65 to −70 mV (Zhu, 2004), suggesting that inhibitory inputs should have only small effects on membrane potential at rest. Borrowing from well-established patch clamp protocols (Segal and Barker, 1984), we reasoned that optogenetic depolarization would increase the driving force for inward chloride current, and thereby amplify the impact of GABAA receptor activation on the inhibitory postsynaptic potential (IPSP) (Fig. 3A,B).
In both awake and anesthetized mice, whisker stimuli in the absence of optogenetic stimulation evoked clear spikes or EPSPs in L1 interneurons, as in prior experiments (Fig. 3C, S5). Optogenetic stimuli targeted to single cells (500 ms duration, 1.8 to 21 mW/mm2, repeated at 1 Hz) reliably evoked stimulus intensity-dependent spiking. Remarkably, whisker stimuli applied during single-cell optogenetic stimulation hyperpolarized membrane
potential and suppressed spiking (Fig. 3C, D, E, S5). We quantified the sensory-evoked subthreshold waveforms by digitally removing spikes (Methods) and calculating a stimulus-triggered average at different optogenetic stimulus strengths (Fig. 3E, S5). In both awake and anesthetized brain states, whisker stimuli had opposite effects in the absence vs. presence of baseline optogenetic depolarization, illustrating dramatic non-additivity of sensory and optogenetic inputs to the same neuron. This observation mimicked the prior observation that sensory stimuli evoked single spikes in quiescent neurons but suppressed ongoing bursts in active neurons (Fig. 2H).
We developed a simple biophysical model to test our interpretation that single cell-targeted optogenetic stimulation amplified the effect of network inhibition. We assumed a transient excitatory synaptic input followed shortly by a transient inhibitory input. With only passive conductances (leak, channelrhodopsin, AMPA receptor and GABAA receptor), the model captured the main features of the subthreshold dynamics (Fig. 3F, G, S5, Methods),
including several subtleties. In the anesthetized state, as the strength of the optogenetic drive increased, the sensory-evoked IPSP amplitude first increased—as explained above—but then decreased (IPSP amplitude 29 ± 5% of spike height at Iblue = 5.8 mW/mm2, vs. 16 ± 4% of spike height at Iblue = 21 mW/mm2, mean ± s.e.m., n = 15 neurons, 3 mice, p = 0.001, two-sided paired-sample t-test, Fig. S5). The model revealed that this decrease was due to shunting of the membrane potential toward the CheRiff reversal potential (~0 mV) at high CheRiff conductance (Methods). This simple model thus connected the complex context-dependent whisker-evoked responses in L1 interneurons to basic membrane biophysics. To constrain the possible sources of network inhibition, we next studied the relative timing of excitatory and inhibitory inputs. We delivered whisker stimuli alternately with and without baseline weak optogenetic stimulation targeted to single neurons (5.8 mW/mm2, Fig. 3H). In trials that evoked spikes, stimulus-triggered average waveforms +/− blue light overlapped for the first 2 ms after onset of whisker-evoked depolarization. Thereafter, the waveform in the presence of optogenetic stimulation fell below the waveform in the absence, signaling the onset of inhibition (Fig. 3I, inset). This finding implied a ~2 ms delay between
A
uthor Man
uscr
ipt
A
uthor Man
uscr
ipt
A
uthor Man
uscr
ipt
A
uthor Man
uscr
ipt
onset of excitation and inhibition, suggesting at most a difference of one synapse in the respective paths (Gabernet et al., 2005). Slower inhibitory signals (e.g. from GABAB receptors or polysynaptic mechanisms) may also have contributed to inhibition at later times. Center/surround optogenetic stimulation reveals lateral inhibition in L1
We sought to identify the source of the sensory-evoked inhibition. Patch clamp
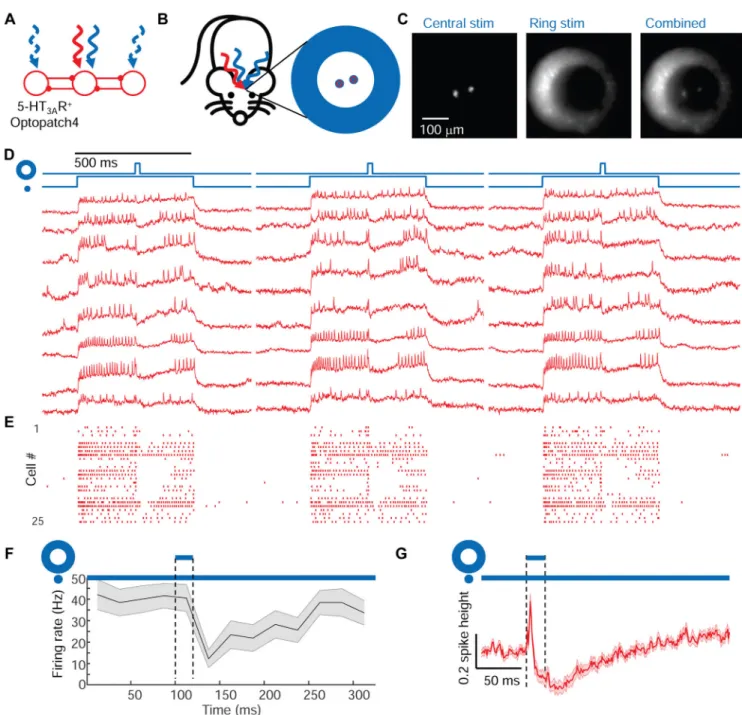
measurements in acute slices identified inhibitory connections between L1 interneurons (Chu et al., 2003; Cruikshank et al., 2012; Schuman et al., 2018). We hypothesized that whisker stimulation evoked near-synchronous spiking in L1, which then led to network inhibition via lateral connections within the L1 population. To test whether L1 activation was sufficient to evoke lateral network inhibition we performed an all-optical measurement of functional connectivity in vivo (Fig. 4A).
We expressed Optopatch4 in 5-HT3AR-Cre mice and targeted voltage imaging to 1-3 L1 interneurons in the center of the field of view. We then defined two optogenetic stimulus patterns. The first pattern comprised small disks targeted individually to the central neurons, with sustained optogenetic depolarization (500 ms, 25 mW/mm2) to increase the driving force for inhibitory currents. The second pattern comprised an annulus (inner diameter ~200 μm, outer diameter of ~400 μm, Fig. 4B, C, Methods), surrounding the central neurons. Midway through the stimulation of the central neurons, a brief flash (20 ms, 25 mW/mm2) was applied to the annulus to evoke synchronized spiking of the surrounding cells.
Optogenetic stimulation of the central neurons evoked robust spiking (41 ± 6 Hz, n = 25 neurons, 3 mice, mean ± s.e.m.). Stimulation of the surrounding neurons transiently suppressed this spiking (spike rate 12 ± 4 Hz in the 25 ms following the annular flash, p = 4 × 10⁻⁴, two-sided paired-sample t-test, Fig. 4D, E, F). The mean fluorescence waveform following the annular flash showed robust hyperpolarization of the central neurons (−27 ± 3% of spike height, Fig. 4G). (Control experiments without the central optogenetic stimulus revealed that the initial depolarization after the annular flash was an artifact from light scatter, Fig. S2). The spike patterns and subthreshold hyperpolarization dynamics in these experiments closely resembled the corresponding data for a sensory stimulus (Fig. 3E, F, I). We observed similar results in neuronderived neurotrophic factor (Ndnf)-Cre mice
(Poorthuis et al., 2018; Tasic et al., 2016) which drove Optopatch4 expression selectively in neurogliaform and canopy cells whose axons project laterally within L1 (Schuman et al., 2018) (Fig. S6). Together, these results established that synchronous activation of laterally projecting L1 neurons was sufficient to elicit rapid lateral inhibition within the L1 microcircuit.
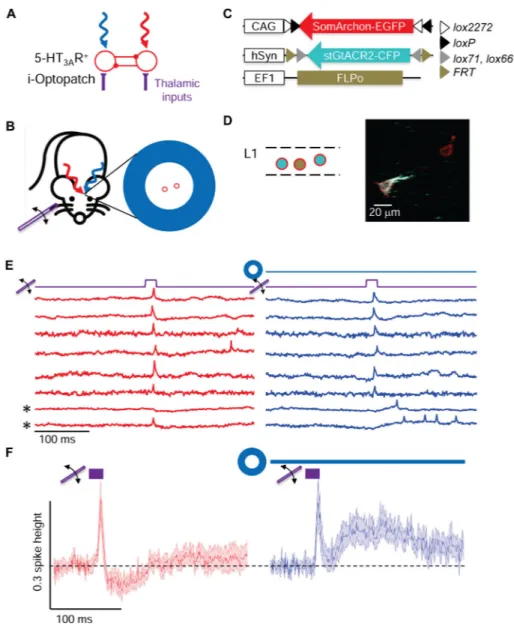
Patterned optogenetic inhibition reveals that sensory stimulation evokes lateral inhibition The existence of a lateral inhibitory connection within L1 did not prove that this connection was responsible for the observed sensory-evoked inhibition. To address this question, we tested how optogenetic inhibition of neurons in an annular region modulated sensory-evoked responses in a centrally located neuron (Fig. 5A, B).
We expressed Cre-on-SomArchon-EGFP and Cre-on-flp-off-stGtACR2-CFP in 5-HT3A R-Cre mice (Fig. 5C, Methods). To prevent scattered blue light from inducing spurious
A
uthor Man
uscr
ipt
A
uthor Man
uscr
ipt
A
uthor Man
uscr
ipt
A
uthor Man
uscr
ipt
hyperpolarization of the measured cells, we used low-titer Flpo virus to turn off expression of stGtACR2 in a sparse subset of L1 neurons. We used 2-photon imaging of the appended fluorescent tags (GFP and CFP) to identify neurons that expressed SomArchon and not stGtACR2 (Fig. 5D). These cells were targeted for voltage imaging in awake mice. We then illuminated a surrounding annulus with blue light (inner diameter ~200 μm, outer diameter ~400 μm) to inhibit the surrounding cells while delivering whisker stimuli.
Whisker stimuli in the absence of surround optogenetic inhibition evoked excitation followed by inhibition (−12 ± 4% of spike height, mean ± s.e.m., n = 13 neurons, 2 mice, Fig. 5E,F), recapitulating earlier experiments performed with a different reporter construct (Fig. 2G). The same cells were then recorded during whisker stimulation with surround optogenetic inhibition (500 ms, 5.8 mW/mm2, Fig. 5E,F right). The post-stimulus
hyperpolarization was replaced by a post-stimulus depolarization (+16 ± 5% of spike height, Fig. 5F). Some cells that showed prompt single spikes in response to whisker stimulation alone showed delayed and sustained spiking when lateral inhibition was suppressed. Together, these results established that sensory stimulation evoked lateral inhibition between L1 interneurons and that this lateral inhibition contributed to precise timing of whisker stimulus-evoked spikes.
Cholinergic activation induces diverse neuronal responses
Cholinergic modulation of L1 interneurons can enhance cortical L2/3 responses to sensory inputs (Letzkus et al., 2011). As a first step toward understanding the integration of
modulatory and sensory inputs in L1, we studied the response of barrel cortex L1 neurons to a stimulus designed to activate cholinergic inputs (Fig. 6A, B). An air puff to the face excites cholinergic neurons in basal forebrain (Hangya et al., 2015), and these neurons are known to innervate cortical L1 (Eggermann et al., 2014; Letzkus et al., 2011; Mechawar et al., 2000). We imaged L1 neurons in awake mice while delivering a mild air puff (100 ms duration, ~5 psi) to the ipsilateral eye (to avoid incidental whisker stimulation, Fig. 6B). The air puff induced a significant increase in mean spike rate (from 2 ± 1 Hz to 8 ± 4 Hz, 50 to 200 ms after stimulus onset, p = 0.048, n = 15 neurons, 3 mice, paired two-sample t-test) and evoked a mean depolarization that grew over ~100 ms and lasted for ~1600 ms (Fig. 6C).
The a4 nicotinic acetylcholine receptor is highly expressed in L1 interneurons (Arroyo et al., 2012; Takesian et al., 2018), so we hypothesized that this receptor mediated the
neuromodulatory response. We made paired recordings of the same L1 interneurons before and after systemic administration of the a4 nAChR blocker dihydro-β-erythroidine hydrobromide (DHβE, 1.5 mg/kg i.p., Fig. 6C). The AD50 for this drug in mice has been reported to range from 0.45 to 1.7 mg/kg (Damaj et al., 1995), implying partial block at the dose used (higher doses are toxic (Damaj et al., 1995)). DHβE did not significantly affect the spontaneous spike rate (before drug: 2 ± 1 Hz, after drug 3 ± 3 Hz, p = 0.53, two-sided paired-sample t-test, n = 15 neurons, 3 mice, Fig. 6D), but the drug abolished the air puff-induced increase in spike rate (3 ± 3 Hz before air puff to 3 ± 2 Hz after air-puff, p = 0.79; Fig. 6D), and significantly decreased the air puff-induced subthreshold depolarization from 22 ± 4% of spike height to 10 ± 3% (p = 0.02, two-sided paired-sample t-test, Fig. 6E,F).
A
uthor Man
uscr
ipt
A
uthor Man
uscr
ipt
A
uthor Man
uscr
ipt
A
uthor Man
uscr
ipt
Thus a4-mediated cholinergic excitation was largely responsible for the air puff-induced responses, though we cannot rule out other contributions to these responses.
The single-cell traces showed striking variability, so we explored in detail the responses of individual cells. In 15 of 21 L1 interneurons, the air puff evoked a clear depolarization. In 6 of these neurons the air puff evoked one or more spikes and in 3 of these neurons, the air puff evoked a barrage of firing that lasted ~1 s, strikingly different from the precisely timed single spikes evoked by whisker stimulation (Fig. 6G). In pairs of simultaneously recorded neurons, we often observed distinct air puff-induced responses in the two cells, indicating that the variability in response was intrinsic to the L1 circuit and was not due to trial-to-trial variation (Fig. S7).
To explore how cholinergic activation affected synaptic inputs, we paired the air puff with single cell-targeted optogenetic depolarization. When the air puff was applied in the middle of an optogenetic stimulus (500 ms, 5.8 mW/mm2), there was no significant change in mean spike rate (Fig. 6H), though some individual neurons showed dramatic increases or
decreases in spike rate (see e.g. Fig. 6G, second and fourth traces). During baseline optogenetic stimulation, the air puff on average depolarized the membrane potential (Fig. 6I), opposite to the hyperpolarizing transient evoked by a whisker stimulus under comparable conditions (e.g. Fig. 3C). However, individual neurons sometimes showed strong air puff-induced hyperpolarization (Fig. S7). There are many possible mechanisms underlying the heterogeneous air puff responses. Below we suggest a simple mechanism by which this heterogeneity could arise in a mutually inhibitory network.
Network model of L1 dynamics
Due to the strong mutual inhibition between L1 neurons, one cannot intuitively predict the network responses to excitatory inputs. We developed a simple numerical model of the L1 microcircuit that explained much of our data and predicted network responses to some new inputs (Fig. 7A, Methods S2). The model contained elongated neurogliaform cells (eNGCs) with mutually inhibitory connections, and downward-projecting single-bouquet cells (SBCs) that received inhibitory inputs from eNGC neurons but did not feed back into the simulated network. Both cell types received thalamic and neuromodulatory inputs (Cruikshank et al., 2012).
Conductance-based point-neuron simulations approximately recapitulated the firing properties of the two major cell classes in L1 (Fig. 7B, Methods, Table S2) (Wang and Buzsáki, 1996). We used published anatomical and patch clamp data to set the soma positions, synaptic weights, and thalamocortical input strength (Chu et al., 2003; Jiang et al., 2015; Schuman et al., 2018) (Methods S2, Table S2). Our simulations comprised 51 neurons (34 eNGCs, 17 SBCs), approximately matching the number of interneurons above a single whisker barrel (Meyer et al., 2013).
We simulated the L1 network with thalamic excitation and patterned optogenetic
stimulation. Simulated thalamic inputs alone evoked precisely timed single spikes followed by a period of hyperpolarization and suppressed spontaneous activity (Fig. S7),
recapitulating the results of Fig. 2. Simulations containing single-cell targeted optogenetic
A
uthor Man
uscr
ipt
A
uthor Man
uscr
ipt
A
uthor Man
uscr
ipt
A
uthor Man
uscr
ipt
stimulation amplified the effect of network inhibition in the targeted cell, closely matching the experimental results in Fig. 3 (Fig. 7C). We also reproduced the center/surround excitation experiments from Fig. 4 (Fig. S7).
Simulations predicted that localized excitation would evoke sustained spiking, while wide-area excitation would lead to strong firing rate adaptation due to lateral inhibition (Fig. 7D, E, F). Experiments in anesthetized mice confirmed that optogenetic stimulation of individual cells led to sustained spiking (Fig. 7G, H, I). Optogenetic stimulation of a 400 μm wide spot elicited a prompt spike in nearly all neurons (17 of 20 cells), followed by a complete suppression of spiking in nearly all neurons (18 of 20 cells) during the subsequent 20 ms (Fig. 7G, H). Most neurons remained silent during the subsequent ~100 ms, though a few (4 of 20 cells) resumed tonic spiking (Fig. 7G). The sub-threshold potentials also showed a clear difference between localized and distributed optogenetic excitation (Fig. 7I). Localized excitation led to a sustained depolarization, whereas distributed excitation led to a peak in potential followed by a ~100 ms inhibition (Fig. 7I).
These results demonstrate the input-output transformations of L1. The circuit acts as a temporal high-pass filter for spatially distributed inputs. This filtering manifests in the precisely timed single spikes from whisker stimulation. The circuit also acts as a spatial high-pass filter for temporally sustained inputs, i.e. spatially localized inputs can evoke sustained local firing, but spatially distributed inputs cannot.
We modeled cholinergic input as activation of an excitatory conductance in all L1
interneurons, with rise time of 300 ms and duration ~1 s. To our surprise, sustained spatially distributed excitation of all cells led to winner-takes-all spiking patterns above a critical excitation strength. Some cells spiked a little faster than their neighbors, suppressing spiking of the neighbors and amplifying the disparity in spike rates. For cholinergic inputs above the critical strength, the simulated single-cell firing traces (Fig. 7J) fell into two classes
(sustained spiking vs. transient depolarization or single spikes), closely resembling the bimodal single-cell cholinergic responses we observed in response to an air puff (Fig. 7K). A similar bimodal distribution of cholinergic responses had previously been noted in L1 interneurons in auditory cortex in response to a tail shock (Letzkus et al., 2011), but had not been explained. We emphasize that the bimodal responses in the model are an emergent property of a homogeneous mutually inhibitory network; not the result of hard-wired single-cell properties or network connections. These simulation results suggest that strong
cholinergic input to L1 can temporarily lock the circuit into a winner-takes-all firing pattern.
Discussion
By combining soma-localized voltage indicators with holographic structured illumination microscopy we achieved high-sensitivity genetically targeted recordings of membrane voltage in cortical L1 and superficial L2/3 in awake mice. We introduced optogenetic techniques for resolving excitatory from inhibitory contributions to subthreshold voltage and for mapping functional connectivity in vivo. We developed tools for simultaneous
optogenetic inhibition and voltage imaging (i-Optopatch) to reveal the roles of specific neural populations in network function.
A
uthor Man
uscr
ipt
A
uthor Man
uscr
ipt
A
uthor Man
uscr
ipt
A
uthor Man
uscr
ipt
We applied these tools to study the input-output properties of L1. Whisker deflections evoked precisely timed single spikes in L1 interneurons, followed by periods of
hyperpolarization, reduced spontaneous activity and reduced response to sensory inputs. Optogenetic depolarization of individual cells revealed that whisker stimuli evoked excitation, followed by strong network inhibition. Optogenetic stimulation of neighboring L1 neurons evoked similar patterns of network inhibition. Optogenetic silencing of neighboring L1 neurons abolished sensory-evoked network inhibition. Together these experiments showed that lateral inhibition within L1 plays a critical role in determining the network response to sensory inputs. Our results in L1 are reminiscent of similar results showing sensory-evoked concurrent excitation and inhibition in pyramidal cells in L4 (Gabernet et al., 2005; Wehr and Zador, 2003) and in L2/3 (Petersen et al., 2003; Sachdev et al., 2004).
Our results further showed that neuromodulatory excitation drove tonic spiking in a subset of cells, and drove single spikes or purely subthreshold depolarizations in other cells. While the origin of this heterogeneity is not known, simulations suggested that this heterogeneity could arise in a homogeneous mutually inhibitory network via winner-takes-all dynamics. However, alternate explanations are not ruled out. The heterogeneous cholinergic responses may reflect variations in acetylcholine receptor expression between L1 neuronal subtypes (Schuman et al., 2018), or specific features of the wiring. A definitive test will require population-level voltage imaging in defined subtypes of L1 interneurons, combined with precisely controlled cholinergic activation. This type of experiment is likely to be technically feasible in the near future.
The convergence of sensory and cholinergic inputs onto L1 interneurons raises the question of how these modalities interact. Our model predicts that weak neuromodulatory excitation sensitizes the network to thalamic inputs by bringing all cells are closer to threshold; but strong neuromodulatory excitation transiently locks the network into a symmetry-broken winner-takes-all state comprising strongly excited and strongly inhibited neurons. In this state, responses to thalamic inputs are suppressed. Thus the sensitivity of the L1 network to sensory inputs is predicted to show an inverted-U dependence on cholinergic drive.
Considering the importance of L1 in modulating sensory processing, we speculate that the L1 microcircuit may contribute to the inverted-U dependence of performance on arousal observed in many sensory processing tasks (McGinley et al., 2015), often called the Yerkes-Dodson law (Yerkes and Yerkes-Dodson, 1908). We further speculate that rapid firing in a subset of L1 interneurons under strong cholinergic drive may be important for L1-mediated plasticity (Abs et al., 2018; Doron et al., 2019). A clear goal for future work will be to test these predictions by studying the interaction of sensory and modulatory inputs in each subclass of L1 interneurons.
Future applications of the tools described here will benefit from voltage imaging deeper in the brain. Due to light scattering, the present 1-photon imaging approach faces a tradeoff between the density of signal sources and the imaging depth, with a maximum cortical depth for sparse cells of ~230 mm. Several approaches to circumventing this tradeoff are
conceivable, such as adaptive optics (Ji, 2017), graded-index (GRIN) lens endoscopes (Jung
A
uthor Man
uscr
ipt
A
uthor Man
uscr
ipt
A
uthor Man
uscr
ipt
A
uthor Man
uscr
ipt
et al., 2004) or prism-based imaging approaches (Andermann et al., 2013). Efforts are also underway to develop two-photon voltage imaging in vivo (Villette et al., 2019), though improvements in molecular indicators and optics are likely necessary. Two-photon targeted optogenetic stimulation has recently been paired with calcium imaging in vivo (Emiliani et al., 2015; Forli et al., 2018; Mardinly et al., 2018; Marshel et al., 2019; Packer et al., 2015; Rickgauer et al., 2014). Combination of two-photon stimulation with voltage imaging may enable fine-grained circuit dissection in vivo.
The all-optical tools introduced here could be used to dissect circuit mechanisms in many contexts. For instance, interactions between excitation and inhibition are critical in network models of reinforcement learning (Schultz et al., 1997) and predictive coding (Rao and Ballard, 1999) but many aspects of these models have not been tested. The ability to silence or activate defined sub-populations while imaging voltage can reveal otherwise hidden inhibition, and elucidate the necessity and sufficiency of specific connections for network function.
STAR Methods
LEAD CONTACT AND MATERIALS AVAILABILITY
Further information and requests for resources and reagents should be directed to and will be fulfilled by the Lead Contact, Adam Cohen (cohen@chemistry.harvard.edu). Plasmids generated in this study and their sequences are available from Addgene.
EXPERIMENTAL MODEL AND SUBJECT DETAILS
Cell lines—HEK293T cell line were bought from ATCC and incubated in DMEM supplemented with 10% FBS and penicillin/streptomycin in a 37 °C incubator under 5% CO2.
Mice—All procedures involving animals were in accordance with the National Institutes of Health Guide for the care and use of laboratory animals and were approved by the
Institutional Animal Care and Use Committee at Harvard University. For slice experiments, P16-P28 5HT3AR-Cre+/− mice were used.
For in vivo experiments, 35-60-day-old wild-type C57BL/6, 5HT3AR-Cre+/−, SST-Cre+/−, and NDNF-Cre+/− mice were used. All mice were housed in standard conditions (reverse 12-hour light/dark cycles, with water and food ad libitum). Mice of both sexes were used. METHOD DETAILS
Design of Optopatch4—Optopatch4 construct (SomArchon-eGFP-P2A-somCheRiff) was cloned into an AAV vector with Cre-dependent expression driven by the hSyn promoter. LZF1735 pAAV_hSyn-DiO-SomArchon-eGFP-P2A-somCheRiff (Optopatch4, Addgene #126512)
A
uthor Man
uscr
ipt
A
uthor Man
uscr
ipt
A
uthor Man
uscr
ipt
A
uthor Man
uscr
ipt
For expression of SomArchon alone we used: pAAV_CAG-FLEX-SomArchon-eGFP (Addgene #126943)
High-titer AAV2/9 virus with Optopatch4 (1.74×10¹³ GC/mL, LZF1735) was obtained from the Janelia Farm Vector Core. High-titer AAV2 virus with SomArchon (6.30×10¹² GC/mL) was obtained from the UNC Vector Core. High-titer AAV9 virus with CKII(0.4)-Cre (2.8× 10¹³ GC/mL) was obtained from UPenn Vector Core.
Design of i-Optopatch—i-Optopatch constructs include:
LZF1826 pAAV_hSyn-DiO-SomArchon-eGFP-P2A-stGTACR2 (Addgene #135412) LZF1827 pAAV_hSyn-Flp-off-Cre-on-stGtACR2-CFP (Addgene #135413)
pAAV_hSyn1-SIO-stGtACR2-FusionRed was a gift from Ofer Yizhar (Addgene plasmid # 105677). stGtACR2 cDNA segments were generated from the template of pAAV_hSyn1-SIO-stGtACR2-FusionRed (Addgene #105677).
High-titer AAV2/9 virus with LZF1826 (2.30×10¹³ GC/mL) and LZF1827 (2.50×10¹³ GC/mL) were obtained from the Janelia Farm Vector Core. pAAV-EF1a-Flpo was a gift from Karl Deisseroth (Addgene plasmid #55637). High-titer AAV5 virus with EF1a-Flpo (2.6×10¹² GC/mL) was obtained from the UNC Vector Core.
Optical system for holographically targeted voltage imaging and patterned optogenetic stimulation—The optical system combined a red laser (λ = 639 nm) path for holographic targeted illumination voltage imaging, a blue laser (λ = 488 nm) path for micromirror-patterned optogenetic stimulation, a two-photon (2P) path for structural imaging, and a wide-field epifluorescence imaging path.
Red laser path.: A red laser (CNI Inc., MRL-FN-639, λ = 639 nm, 700 mW single transverse mode) was coupled into the setup via a photonic crystal polarization maintaining fiber (NKT Photonics, LMA-PM-15). The fiber output was collimated with an f = 100 mm focal length lens (Thorlabs, AC254-100-A-ML) to form a beam with approximately ~10 mm diameter. The polarization of the beam was set with a zero-order half-wave plate. The beam was directed onto a holographic reflection-mode liquid crystal spatial light modulator (SLM, Meadowlark 1920SLM VIS) with a resolution of 1920 x 1152 pixels. Zero-order diffraction was blocked by a home-made anti-pinhole comprised of a dot of solder on a glass slide, placed in a plane conjugate to the sample image plane. The SLM was re-imaged onto the back-focal plane of the objective via a series of relay optics. The objective lens was a 25× water immersion objective, numerical aperture 1.05 (Olympus XLPLN25XWMP2). A mechanical shutter blocked the red laser between data acquisitions. A series of OD filters were placed after the red laser for modulating intensity.
In the first generation of the setup, we used a variable focal length camera lens (Sigma macro 18-200 mm) to control the magnification of the SLM at the back focal plane of the objective. Demagnifying the SLM decreased the effective numerical aperture of the illumination at the sample, leading to bigger spots in the sample, but also to a larger region
A
uthor Man
uscr
ipt
A
uthor Man
uscr
ipt
A
uthor Man
uscr
ipt
A
uthor Man
uscr
ipt
that could be targeted with red light. In the second-generation system, we used a fixed lens after the SLM to minimize aberrations. All relay lenses are specified in Table S1.
The SLM device was controlled by custom software. A user specified a set of lines for the SLM to target by drawing on a wide-field epifluorescence image or a 2P fluorescence image. These lines were discretized into a set of spots. The SLM phased pattern was calculated using the Gerchberg-Saxton algorithm.
Red laser intensity was ~ 3 mW per cell for in vivo imaging, ~ 1 mW per cell for acute slice imaging.
Blue laser path.: A blue laser (Cobolt, 06-01 series, λ = 488 nm, 60 mW) was modulated in intensity via an acoustooptic tunable filter (AOTF; Gooch and Housego TF525-250-6-3-GH18A). The beam was focused into a singlemode optical fiber. The output was collimated with an f = 60 mm focal length lens (Thorlabs, AC254-060-A-ML) to form a beam with approximately a ~17 mm diameter. The beam was then sent to a digital micromirror device with a resolution of 1024 x 768 pixels (DMD, Vialux, V-7001 VIS). The patterned blue beam was combined with the patterned red beam via a dichroic mirror. The DMD was re-imaged onto the sample at a magnification such that one DMD pixel corresponded to 0.62 μm in the sample plane. The DMD optical system enabled patterned blue light stimulation across a field of view of ~450 x ~520 μm.
The DMD was controlled by custom software. For excitability measurement, a pixel bitmap was preloaded onto and projected from the DMD. For lateral inhibition experiments, pixel bitmaps were loaded into the on-board RAM and digital clock pulses triggered the DMD to sequence through the pre-defined set of exposure patterns.
Wide-field fluorescence imaging path.: The image was relayed from the objective to the camera via a series of three lenses. The final image formation step was performed by a 4x objective (Olympus XLFLUOR 4X/340) serving the role of the tube lens. Fluorescence was collected on a scientific CMOS camera (Hamamatsu ORCA-Flash 4.0). The final
magnification of the optical system was 16.7, corresponding to 0.39 μm in the sample plane per camera pixel.
Fluorescence from the sample was separated from the blue and red excitation beams via a dichroic mirror (Di03-R405/488/561/635-t3-40x55). An emission filter (Semrock 635 nm long-pass, BLP01-635R-25) further separated SomArchon fluorescence from scattered excitation light. An IR-blocking emission filter (Semrock, FF01-842/SP-25) was placed for blocking scattered infrared excitation light.
All movies are acquired at 1 kHz. To image at 1 kHz, the camera region of interest (ROI) was restricted to typically 200 rows, centered on the image-sensor midline.
The imaging system was designed for a magnification lower than the nominal 25x of the objective for two reasons. First, lower magnification increased the number of neurons that could be imaged simultaneously onto the limited detector area accessible at 1 kHz. Second, by concentrating sample photons onto as few camera pixels as possible, we sought to
A
uthor Man
uscr
ipt
A
uthor Man
uscr
ipt
A
uthor Man
uscr
ipt
A
uthor Man
uscr
ipt
minimize the contribution from camera electronic noise, so that all signals would be in the shot noise-limited regime.
Two-photon imaging path.: Light from a femtosecond tunable pulsed infrared laser (Spectra Physics DeepSee) was sent to a pair of galvo mirrors (Cambridge Technologies 6215H). The galvos were re-imaged onto the back focal plane of the objective via an optimized scan lens (Thorlabs, SL50-CLS2) and tube lens (Thorlabs, TL200-CLS2). The visible (blue and red) and near-infrared beams were combined using a 785 nm long-pass dichroic mirror (Semrock, Di03-R785-t3-40x55). GFP fluorescence was directed to the 2P detection path via a removable 550 nm long-pass dichroic. Scattered excitation light was blocked by a 550 nm long-pass emission filter, an IR-blocking emission filter
(BSP01-785R-25) and a band-pass emission filter (FF03-525/50-25). A pair of lenses (focal lengths 75 mm and 16 mm) re-imaged the back-aperture of the objective onto a
photomultiplier tube (Hamamatsu, H11706P-40). The output of the photomultiplier was amplified and low pass filtered through an amplifier unit (Hamamatsu C7319) and then digitized.
For i-Optopatch experiments, GFP fluorescence was excited by 950 nm and selected by a band-pass emission filter (Chroma, ET525/36m). CFP fluorescence was excited by 900 nm and selected by a band-pass emission filter (FF01-475/28-25).
Control software.: The entire setup was controlled by custom software written in LabView. Interfacing was via a National Instruments DAQ (NI PCIe-6363).
The software contained routines for registration of the DMD, SLM, 2P microscope coordinates to the camera via affine transformations. The camera served as the global reference coordinate system.
Experimental protocols were specified by a set of images (to the SLM and the DMD), output waveforms (to the galvos, the AOTF, the shutters, the update clock on the DMD, the piezo whisker stimulator, and the air puff controller), and analog input streams (from the PMT, the camera exposure clock, and a patch clamp electrophysiology setup not used in the present work).
The Hamamatsu camera uses an internal 100 kHz clock to synchronize image row readout. We found that when the camera exposure times were triggered by the DAQ in synchronous mode, the camera rounded the exposure time to the nearest 10 μs, leading to 1% jitter in exposure time for 1 kHz imaging. To address this noise source, we used a custom firmware upgrade to access the 100 kHz camera clock. This clock became the master clock for the DAQ system, and all analog and digital input/output functions were synchronized to the camera clock.
Imaging in acute slices—All procedures involving animals were in accordance with the National Institutes of Health Guide for the care and use of laboratory animals and were approved by the Institutional Animal Care and Use Committee at Harvard University.
A
uthor Man
uscr
ipt
A
uthor Man
uscr
ipt
A
uthor Man
uscr
ipt
A
uthor Man
uscr
ipt
Virus injection for acute slice measurements.: Virus comprising AAV2/9 hSyn-Dio-SomArchon-eGFP-P2A-somCheRiff (1.74×10¹³ GC/mL) was diluted in PBS and injected at a final titer of ~2×10¹² GC/mL.
5HT3AR-Cre+/− mice were crossed with wild-type C57BL/6 mice. Pups were cryo-anesthetized at P0-P2 and immobilized dorsal side up under a stereotaxic microscope. Injections were made using home-pulled micropipettes (Sutter P1000 pipette puller), mounted in a microinjection pump (World Precision Instruments Nanoliter 2010) controlled by a microsyringe pump controller (World Precision Instruments Micro4). The micropipette was positioned using a stereotaxic instrument (Stoelting Digital Mouse Stereotaxic
Instrument). Pups were injected in the left hemisphere, 1 mm lateral and 1.2 mm anterior to lambda. Starting at a depth of 0.3 mm beneath the surface of the skull, virus injections (40 nL, 1 nL/s) were performed at 0.1 mm increments as the pipette was withdrawn. Pups were placed back in their home cage once they were awake.
Genotyping.: Genotyping for 5HT3AR-Cre, SST-Cre and NDNF-Cre was performed with the PCR primer pairs: Cre 5': 5' TAT CTC ACG TAC TGA CGG TG 3' and Cre 3': 5' AGA CTA ATC GCC ATC TTC CAG C 3' to yield a 500 bp band from Cre.
Acute slice preparation.: Acute brain slices were prepared from P16–P28 5HT3AR-Cre+/− mice. The mice were anesthetized by isoflurane and then perfused with carbogen (95% O2, 5% CO2)-saturated ice-cold slicing solution with the following composition (in mM): 110 choline chloride, 2.5 KCl, 1.25 NaH2PO4, 25 NaHCO3, 25 glucose, 0.5 CaCl2, 7 MgCl2, 11.6 Na-ascorbate, and 3.1 Na-pyruvate. Mice were then decapitated and the brains were rapidly coronally sliced with 300 μm thickness on a vibratome (Leica VT 1200S).
Slices were incubated for 45 min at 34 °C in a carbogenated artificial CSF (ACSF) with the following composition (in mM): 127 NaCl, 2.5 KCl, 1.25 NaH2PO4, 25 NaHCO3, 25 glucose, 2 CaCl2, and 1 MgCl2. The osmolarity of all solutions was adjusted to 300–310 mOsm and the pH was maintained at 7.3 under constant bubbling with carbogen. Imaging acute slices.: Measurements were conducted in ACSF at 23 °C under ambient atmosphere. The slice was immobilized in a slice recording chamber using a slice anchor (Warner Instruments, SHD-40/2). ACSF, perfused with carbogen, was flowed through the chamber at a rate of 2 mL/minute.
Cranial windows and virus injections
Cranial window surgery and virus injection for imaging barrel cortex L1.: For Optopatch experiments, virus comprising AAV2/9 hSyn-Dio-SomArchon-eGFP-P2A-somCheRiff (1.74×10¹³ GC/mL) was diluted in PBS and injected at a final titer of ~3×10¹² GC/mL.
For i-Optopatch experiments (Fig. 1I-K and Fig. 5), virus comprised AAV2/9 hSyn-Flp-off-Cre-on-stGtACR2-CFP (final concentration ~1×10¹² GC/mL) mixed with AAV2 CAG-FLEX-SomArchon-eGFP (final concentration ~6.3×10¹¹ GC/mL) and AAV5 EF1a-Flpo (final concentration ~2×10¹¹ GC/mL).
A
uthor Man
uscr
ipt
A
uthor Man
uscr
ipt
A
uthor Man
uscr
ipt
A
uthor Man
uscr
ipt
The procedure for surgery and imaging in barrel cortex L1 followed the protocol from Andermann (Goldey et al., 2014). 35-60-day-old heterozygous 5HT3AR-Cre mice (male and female) were deeply anesthetized with 2% isoflurane and maintained with ~1% isoflurane throughout the surgery. Eyes were kept moist using ophthalmic eye ointment. Body
temperature was continuously monitored and maintained at 37 °C using a heating pad (WPI, ATC2000). The skull was exposed and thoroughly dried and a 3 mm round craniotomy (3.3 – 3.4 mm lateral, 1.6 mm caudal of bregma) was opened using a biopsy punch (Miltex). Virus was then injected in 4 - 8 locations in the center of the craniotomy. Starting at a depth of 0.2 mm beneath the surface of the dura, virus injections (60 nL, 30 - 60 nL/min) were performed at 0.1 mm increments as the pipette was withdrawn. Brain surface was kept moist with saline throughout the injection.
A window was prepared prior to the surgery and comprised two 3 mm round #1 cover glasses and one 5 mm round #1 cover glass (Harvard apparatus) cured together with UV curable adhesive (Norland Products, NOA 81). Following the virus injection, the window was then placed covering the barrel cortex and cemented to the skull with dental cement (C&B metabond, Parkell, No. 242-3200). After the window cured, a titanium headplate (similar to the design in Ref. (Goldey et al., 2014)) was glued around the window and any exposed skull was covered with dental cement. Animals were returned to their home cage for recovery and treated for 3 days with Carprofen (5 mg/kg) and Buprenorphine (0.1 mg/kg) twice a day. To avoid damage to the implant, mice were housed in separate cages. Cranial window surgery and virus injection for L1-3 imaging (Fig. 1D).: The procedure for surgery and imaging in visual cortical L1-3 followed the same protocol as above, except that 35-60-day-old wild-type C57BL/6 mice or heterozygous SST-Cre mice (male and female) were used. The coordinates for the 3 mm round craniotomy were 2.4 mm lateral and 2.7 mm caudal of bregma. Virus was then injected in 4 - 8 locations in the center of the craniotomy. Starting at a depth of 0.3 mm beneath the surface of the dura, virus injections (60 nL, 30 - 60 nL/min) were performed at 0.2 mm increments as the pipette was withdrawn. For wild-type mice, injected virus comprised AAV2 CAG-FLEX-SomArchon-eGFP (final titer ~0.5×10¹² GC/mL) mixed with CKII(0.4)-Cre virus (UPenn vector core, final titer ~1×10n GC/mL).
For SST-Cre mice, injected virus comprised AAV2 CAG-FLEX-SomArchon-eGFP (final titer ~0.5×10¹² GC/mL).
Tracking, whisker stimulation, intrinsic imaging and in vivo voltage imaging— For general behavior monitoring during acquisitions we recorded video of the mouse’s face. An IR LED light (850 nm) was placed in front of the animal. A PointGrey camera (GS3-U3-51S5M-C, Mono Grasshopper3 USB 3.0 Camera) with a Fuji lens (Fuji Photo Optical 1:1.4/25 Fujinon-TV Camera Lens) and an IR-passing optical filter (Thorlabs, FB850-40) was placed on the side to track the animal’s face (whisker motion and eye blinks) during data acquisitions.
A
uthor Man
uscr
ipt
A
uthor Man
uscr
ipt
A
uthor Man
uscr
ipt
A
uthor Man
uscr
ipt
Whisker stimulation.: An individual whisker was selected for stimulation (typically B2, C2 or D2). Other whiskers were trimmed to prevent direct contact with the glass pipette. The whisker was inserted into a glass pipette glued to a piezoelectric actuator. The actuator was connected to an amplifier (Krohn-Hite 7602M) and controlled by the DAQ. A spike was classified as ‘evoked’ if it occurred within 30 ms of onset of whisker stimulus.
Intrinsic imaging.: Intrinsic imaging was performed on the same setup as described above. A 4x objective (Olympus XLFLUOR 4X/340) was used to image the entire 3 mm cranial window. The whisker stimulation was 10 Hz for 4 s with a 16 s interstimulus interval. A red LED (625 nm) illuminated the window surface from the side. Reflected light was imaged onto the camera at 10 Hz frame rate. A decrease in reflectance from the brain indicated the barrel, which could be localized relative to the blood vessel pattern as visualized with 488 nm illumination.
Imaging anesthetized animals.: Imaging started 3 weeks post-surgery. Mice were lightly anesthetized (0.7–1% isoflurane), head-fixed under the upright microscope using the titanium head plate and held in a body tube. Eyes were kept moist using ophthalmic eye ointment. Body temperature was continuously monitored and maintained at 37 °C using a heating pad (WPI, ATC2000). A typical imaging session lasted 1–2 hours, and then animals quickly recovered and returned to their home cage. Recordings targeting L1 neurons in vivo were performed at a depth < 150 μm in both anesthetized and awake animals. Recordings typically targeted 1 – 4 neurons simultaneously.
Habituation and imaging awake animals.: Habituation started 2 weeks post-surgery. Each animal was acclimated to the head restraint in a body tube for at least 3 days before starting the imaging sessions. For imaging in awake animals, a 3D-printed paw blocker was placed in front of the forepaws to prevent them from pushing away the glass pipette for whisker stimulation.
Air puff.: The timing of the air puff was controlled by a solenoid valve (WPI). The strength of the air puff was set ~ 5 psi and controlled by a pressure regulator (Festo, pressure regulator LRP-1/4-4). The air puff was delivered through a blunt needle at ~ 5 mm from the eye ipsilateral to the brain hemisphere used for voltage imaging (to avoid spurious whisker stimulation arriving in the imaged barrels). Air pressure and needle position were adjusted to achieve an air puff strength just strong enough to evoke an eye blink response and increase the pupil diameter.
DHβE administration.: To modulate cholinergic signaling, dihydro-β-erythroidine hydrobromide (DHβE, Tocris; 2349) was diluted in saline. The drug was administered systemically (1.5 mg/kg i.p.). Optopatch and air puff measurements were performed before, and then 30 min. after drug administration, on the same sets of cells. The experiment was performed on each animal twice, on successive days.
Center/surround optogenetic stimulation—For lateral inhibition experiments, we defined two optogenetic stimulus patterns. “Central masks” covered individually the cell bodies of 1 – 3 neurons at the center of the field of view. We calculated the geometrical
A
uthor Man
uscr
ipt
A
uthor Man
uscr
ipt
A
uthor Man
uscr
ipt
A
uthor Man
uscr
ipt
centers of these masks individually. The mean of these centers was set as the coordinates for the center for the surrounding “annulus mask”.
The annulus inner radius was set to be ~100 –m from the most non-centered central mask. This distance was selected to minimize the impact of scattered light from the annulus mask. The outer radius of the annulus mask was set as the largest value at which the annulus would be contained within the FOV. Typical outer radii were ~200 μm.
The image sequence was composed of three composite masks: (1) central masks only; (2) central mask and annulus mask together; (3) annulus mask only. These masks were preloaded into the on-board RAM and digital clock pulses triggered the DMD to sequence through the pre-defined set of exposure patterns.
QUANTIFICATION AND STATISTICAL ANALYSIS
Data were analyzed with homemade code written in MATLAB.
Corrections for photobleaching and motion artifacts.—Movies were first corrected for motion using the NoRMCorre algorithm (Pnevmatikakis and Giovannucci, 2017). Movies were then corrected for photobleaching by dividing the movie by an exponential fit of the mean fluorescence.
Image segmentation and waveform extraction.—We divided the movie into sub-movies comprising single cells and performed activity-based image segmentation separately in each sub-movie. Whereas correlations often arose between subthreshold voltages and out-of-focus background, we assumed that spiking was not correlated with background, and furthermore that the spatial footprint associated with spiking would be the same as for true subthreshold dynamics. For segmentation purposes, we first removed subthreshold signals via a 100 Hz high-pass filter. Movies were then segmented semi-automatically using one of two activity-based segmentation algorithms. In one approach, principal components analysis was followed by time-domain independent components analysis (PCA/ICA) (Mukamel et al., 2009). The spatial masks from PCA/ICA were then applied to the original movies without high-pass filtering to extract fluorescence traces.
In a second approach, high-pass filtered movies were segmented via penalized matrix decomposition nonnegative matrix factorization algorithm (PMD-NMF) (Buchanan et al., 2018). The spatial masks were applied to the original movies without high-pass filtering to extract initial fluorescence traces. An estimate of the background signal was calculated from pixels not on the targeted cells. Signals from the cellular footprints were calculated with the constraint that the background spatial profile should be maximally smooth. Both approaches to image segmentation gave similar results, a consequence of the sparsity of L1 interneurons and the optical sectioning from tightly focused holographic excitation.
Validation of the PMD-NMF signal extraction algorithm.—The algorithm has been extensively tested on simulated data comprising realistic shot-noise limited signals from individual cells, correlations in sub-threshold voltages between cells, and correlated out-of-focus background (See Extended Data Fig. 6 of Ref (Adam et al., 2019)). To test the