Application of Dynamic Strategic Planning to Urban Transit Projects:
Case Studies of Boston and Osaka
by
Yasuyuki Nishimura B.E. Civil Engineering
Osaka University, Osaka, Japan (1992) M.E. Civil Engineering
Osaka University, Osaka, Japan (1994)
Submitted to the Technology and Policy Program and Department of Civil and Environmental Engineering in Partial Fulfillment of the Requirements for the Degrees of
Master of Science in Technology and Policy and Master of Science in Civil and Environmental Engineering
at the
Massachusetts Institute of Technology June1999
@ 1999 Yasuyuki Nishimura. All rights reserved.
The author hereby grants to MIT permission to reproduce and to distribute publicly paper and electronic copies of this thesis document in whole or in part.
Signature of the author __ __ ___
Technology and Policy Program # Defldirtment of Civil and Environmental Engineering May 14, 1999
Certified and Accepted by Rihard de Neufville
Professor of Civil and Environmental Engineering Chairman, MIT Technology and Policy Program
I ) Thesis Supervisor
Accepted by 1"- V "i VW V1.A I
AbvAndrew J. Whittle Chairmdn,! 8 IeTm itee on Graduate Studies
Application of Dynamic Strategic Planning to Urban Transit Projects:
Case Studies of Boston and Osaka
by
Yasuyuki Nishimura
Submitted to the Technology and Policy Program and Department of Civil and Environmental Engineering
on May 14,1999 in Partial Fulfillment of the Requirements for the Degrees of Master of Science in Technology and Policy and Master of Science in Civil and Environmental Engineering
ABSTRACT
This thesis examines the application of Dynamic Strategic Planning (DSP) on urban transit projects by using case studies of new transit projects in Boston and Osaka, Japan. The objective of the thesis is to explore more flexible planning methods for an urban rail project in Osaka through the quantitative analysis of an underground transitway project in Boston. It also makes recommendations for changes in the planning methods used by one Japanese private railway company.
The result of the analysis for Boston's underground transitway project shows that the Minimum Operable Segment alternative with the advance acquisition of rights-of-way (MOS-IR) could have the greatest cost effectiveness with the minimum risk. With uncertainties associated with ridership, and construction, operating and maintenance costs, this decision could achieve the most flexibility. In the future decision, this alternative could create the following options: (1) deferring the investment; (2) expanding the investment if the demand growth is favorable; (3) altering the technology in the case of a change in demand. The analysis also demonstrates that this result is not affected by the political risk of fluctuation in the amount of funds from the federal government. This thesis then applies this result to Osaka's heavy rail project, where the West Japan Railway Company (JR-West) was in dilemma: it was under strong political pressures for simultaneous electrification and double-tracking of a line with low profitability. The qualitative analysis shows that staged implementation should be considered as an alternative. The analysis also suggested that DSP not only makes the planning of JR-West more realistic, but also increases the possibility of obtaining governmental financial supports for its future urban rail projects.
Thesis Supervisor: Richard de Neufville
Title: Professor of Civil and Environmental Engineering, Chairman, MIT Technology and Policy Program
Acknowledgements
I would like to express my gratitude to many people both in the United States and in Japan. Without their help, I would not have completed my thesis and study at MIT.
Professor Richard de Neufville, my thesis supervisor, has given me patient advice and clear suggestions throughout the planning and writing of my thesis. I will never forget his warm encouragement both in English and Japanese. Arigatougozaimashita!
I am grateful to Professor Nigel Wilson, who also provided invaluable information.
West Japan Railway Company supported my academic life in MIT with funds. Specifically, many people in the Construction Department responded generously to my requests for information.
Mr. William Kuttner, the Central Transportation Planning Staff, offered me practical insights. The information he provided has also been invaluable.
Mrs. Nita Regnier, MIT's Writing Center, constantly helped my thesis writing. I also thank my friends at MIT, especially, Taku Nishimura, my colleague in TPP, who encouraged me and engaged me in helpful discussions.
Professor Yasuo Mori, Osaka University in Japan, gave me the opportunity to study at MIT. Without his help, I would never have successfully completed this academic undertaking.
My greatest gratitude goes to my wife, Nobuko. Her encouragement and patience helped me realize the dream I had had for a long time.
Finally, I would like to express my appreciation to the Yamanaka family and Ms. Hisako Nishimura, who supported our life in the United States for two years.
Table of Contents
L ist of F igu res ... 11
L ist of T ab les... 13
Chapter 1: Introduction ... 15
1-1 Issues in Urban Transit Projects in the United States and Japan ... 15
1-2 Objective of Thesis ... 16
1-3 Introduction of Case Studies ... 17
1-3-1 South Boston Piers Transitway Project ... 17
1-3-2 Osaka Sotokanjo Line Project ... 18
1-4 Audience of Thesis... 19
1-5 Technology and Policy Issues... 19
1-6 Structure of Thesis ... 20
Chapter 2: Methodology: Dynamic Strategic Planning ... 23
2-1 Introduction of DSP ... 23
2-1-1 Shortcomings of Master Planning (MP)... 23
2-1-2 Merits of DSP ... 25
2-1-3 Structure of Problems ... 25
2-1-4 Accommodation of Uncertainties ... 26
2-1-5 Consideration of Value of Options ... 30
2-2 Literature Review of DSP... 31
2-2-1 Expansion of Established Industry ... 31
2-2-2 Response to Government Regulations... 32
2-2-4 Technology Choice... 35
2-2-5 Tim e to M arket ... 36
2-2-6 Siting New Capacity ... 37
2-3 Sum m ary ... 39
Chapter 3: Background of South Boston Piers Transitway Project ... 41
3-1 Current and Future Traffic Situation of Piers Area... 41
3-2 Transit Alternatives MBTA Considered... 46
3-3 Three Alternatives for Final Decision-Making ... 49
3-4 MBTA's Decision: Full Build Alternative... 52
3-5 Uncertainties Remain: Is Full Build Alternative Best?... .. ... . . 53
3-5-1 Uncertainties in Forecasting Transit Demand ... 53
3-5-2 Uncertainties in Capital Costs ... 56
3-5-3 Uncertainties in Operating and Maintenance (O&M) Costs ... 58
3-5-4 Uncertainties in Federal Support on Capital Costs...60
3-6 Sum m ary ... 62
Chapter 4: Application of DSP to South Boston Piers Transitway Project...63
4-1 Decision Made Using MP... 63
4-2 Decision Made Using DSP... 68
4-2-1 A ssum ptions ... 68
4-2-2 Time Horizon: Two 10-Year Periods ... 69
4-2-3 Procedure of Analysis...70
4-2-3-1 Step 1: Quantification of Uncertainties (C)...74
4-2-3-3 Step 3: Assignment of Probabilities (P)...87
4-2-3-4 Step 4: Calculation of Expected Values (EV)... 92
4-2-4 Cases of Analysis: Without and With Political Uncertainty ... 95
4-2-5 Results of A nalysis ... 95
4-2-5-1 Case 1: Without Political Uncertainty... 95
4-2-5-2 Case 2: With Political Uncertainty... 100 4-2-6 Sensitivity Analysis ...
4-2-7 Comparison with DFC Analysis ... 4-2-8 Recommended Strategy under Uncertainty ... 4 -3 S u m m ary ... Chapter 5: Proposition for Planning Policies of Japanese Urban Rail Project:
Osaka Sotokanjo Line Project ... 5-1 O bjective of C hapter ... 5-2 Overview of Osaka Sotokanjo Line Project... 5-3 History of Osaka Sotokanjo Line Project ...
5-4 Limited Alternatives and No Uncertainty in Forecasting ...
5-5 Methods of Application of DSP...
5-5-1 Types of Uncertainties in Osaka Sotokanjo Line Project... 5-5-2 Quantification of Uncertainties... 5-5-3 Creation of Alternatives... 5-5-4 Calculation of Expected Profitability ... 5-6 Policy-Making Process of JR-West for Urban Rail Projects ...
5-6-1 Problem Definition ... 5-6-2 Policy Instruments ... 106 106 108 109 111 111 113 113 117 117 118 121 123 123 124 124 124
5-6-3 Cast of Characters... 127 5-6-4 Strategy: U se of D SP... 128 5-6-5 Im pedim ent ... 128 5-6-6 Tactical Plan ... 128 5-6-7 N egotiations... 129 5-7 Sum m ary ... 130 Chapter ... 133 6-1 Review of Thesis... 133 6-2 Further Studies ... 135
6-2-1 Consideration of More than One Decision Criterion... 136
6-2-2 Consideration of M ore than One Project ... 136
References ... 139
Appendix A : Base Costs ... 143
Appendix B : Estim ation of U ncertainties ... 147
Appendix C: Estim ation of A djusted D aily Ridership ... 153
Appendix D : Results of Analyses U sing D SP ... 155
List of Figures
Figure Figure Figure Figure Figure Figure Figure Figure 1.1 2.1 2.2 3.1 3.2 3.3 3.4 3.5 Figure 3.6 Figure 4.1 Figure 4.2 Figure 4.3 Figure 4.4 Figure 4.5 Figure 4.6 Figure 4.7 Figure 4.8 Figure 4.9 Figure 4.10 Figure 4.11 Figure 4.12 Structure of Thesis Sketch of Decision Tree Sketch of Chance NodeLocations of Piers Area and Downtown of Boston Present and Projected Appearance of Piers Area Major Alternatives Considered in MBTA Analyses Alignments of Underground Transiway Alternatives
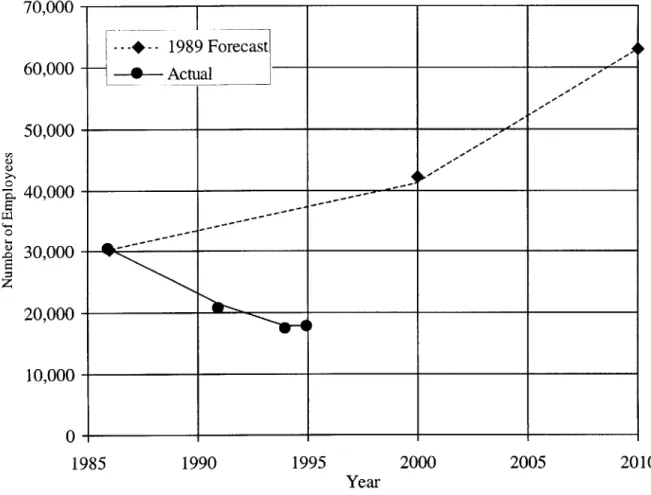
Difference in Number of Employees in Industrial South Boston Area between 1989 Forecast and Actuality
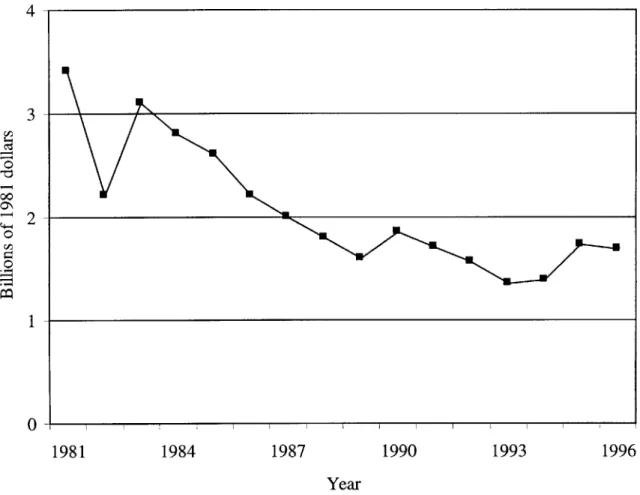
Decline of Federal Capital Grants for Transit Decision Tree of Analysis
Procedure of Analysis
Annual MBTA Ridership between 1969 and 1992 Daily Passenger Entering South Station
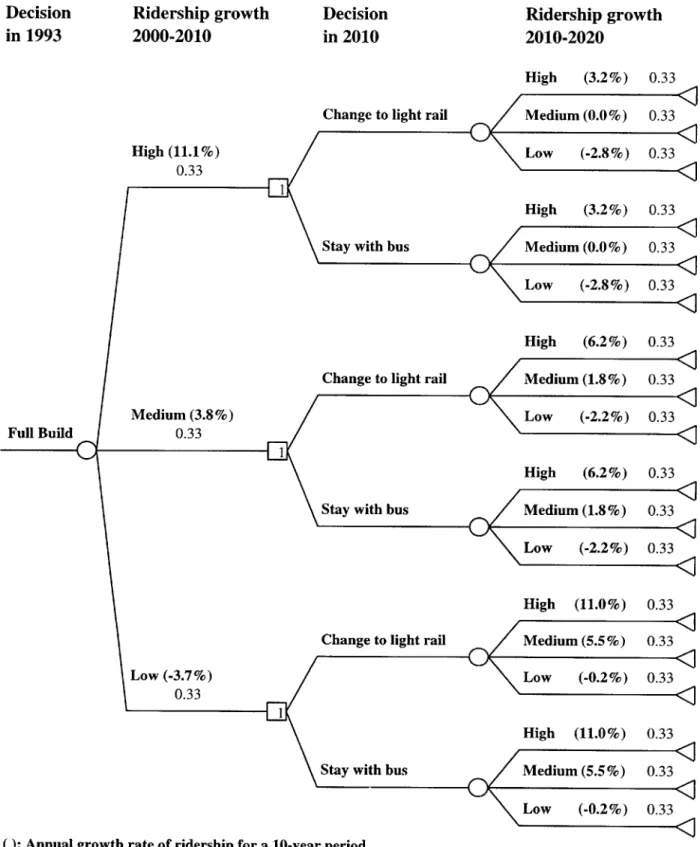
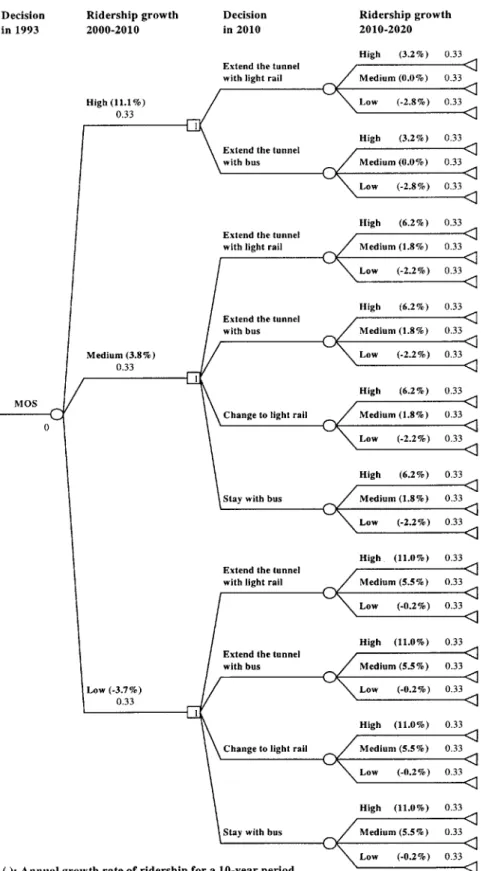
Decision Tree for Full Build Alternative Decision Tree for MOS Alternatives Levels of Ridership in Two Periods
Result of Decision Analysis (Case 1: Without political uncertainty) Comparison of Cost/PAX in 2010 with Cost/PAX in 2020
(Case 1: Without political uncertainty)
Distribution of Cost/PAX (Case 1: Without political uncertainty) Result of Decision Analysis (Case 2: With political uncertainty) Comparison of Cost/PAX in 2010 with Cost/PAX in 2020 (Case 2: With political uncertainty)
Figure 4.13 Figure 4.14 Figure 4.15 Figure 5.1 Figure 5.2 Figure 5.3
Distribution of Cost/PAX (Case2: With political uncertainty)
Sensitivity to Standard Deviation of Annual Growth Rate of Ridership (Case 1: Without political uncertainty)
Sensitivity to Standard Deviation of Annual Growth Rate of Ridership (Case 2: With political uncertainty)
Osaka Sotokanjo Line
Recommended Policy-Making Process of JR-West Decision-Maker Positions
List of Tables
Table 3.1 Piers Area Current and Projected Land UseTable 3.2 Capital and O&M Costs of Major Alternatives Considered in DEIR Table 3.3 Underground Transitway Alternatives: Stations and Costs
Table 3.4 Estimated AM Peak Hour and Daily Transit Ridership and Mode Share to Piers Area in 2010
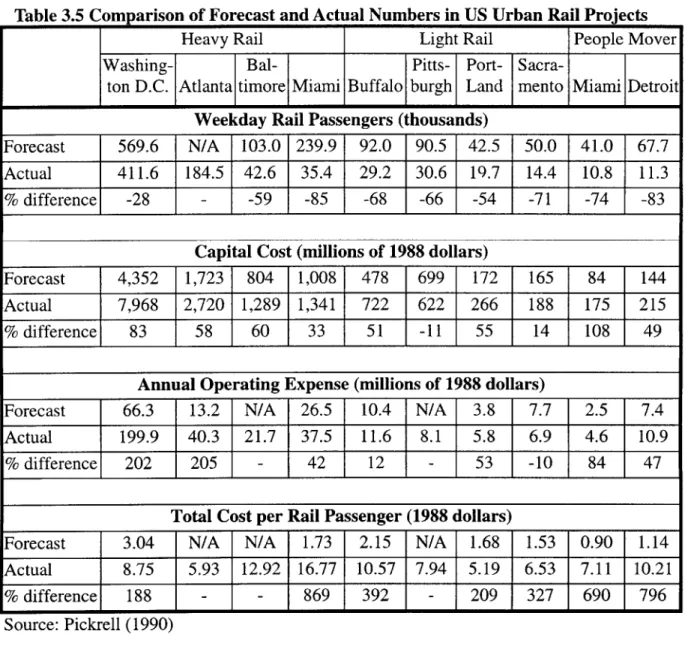
Table 3.5 Comparison of Forecast and Actual Numbers in US Rail Projects
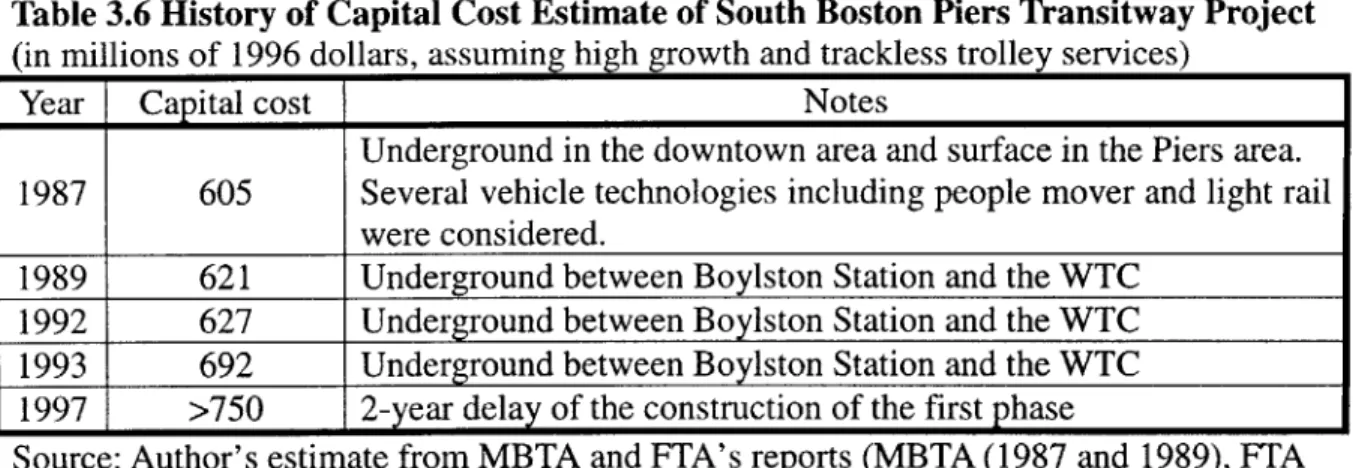
Table 3.6 History of Capital Cost Estimate of South Boston Piers Transitway Project Table 4.1 Results of DCF Analysis (Assuming High Growth, 7% discount rate) Table 4.2 Result of DCF Analysis (Assuming Lower Growth, 7% discount rate)
Table 4.3 Sequence of Decisions and Uncertain Factors of Analysis Table 4.4 Summary of Uncertainties for Analysis
Table 4.5 Calculation of Ridership from Employees
Table 4.6 Calculation of Short-term Annual Growth Rate of Ridership
Table 4.7 Growth Rate of Capital Costs from Estimates to Actuality in Four US Urban Heavy Rail Projects
Table 4.8 Growth Rate of Capital Costs from Estimates to Actuality in Four US Urban Light Rail Projects
Table 4.9 Percentage of Shares for Capital Funding for Public Transit Table 4.10 Peak-Hour Capacity of Transitway in the First Period Table 4.11 Initial Ridership for Calculations of the Second Period Table 4.12 Mean and Standard Deviation of Cost/PAX
(Case 1: Without political uncertainty) Table 4.13 Mean and Standard Deviation of Cost/PAX
(Case 2: With political uncertainty)
Risk Allocation between Entities in Osaka Sotokanjo Line Project Table 5.2
Chapter 1
Introduction
1-1 Issues in Urban Transit Projects in the United States and Japan
In the past several decades, major cities in the United States have investedextensively in public transit in order to mitigate traffic congestion, reduce automobile air pollution and provide people who cannot access cities by automobiles with new mobility (Gomez-Ibanez, 1994). The success of new transit depends on its new ridership; the more ridership, the more effectively traffic congestion is reduced, air quality is improved and equity of transportation is available to people in the city. However, the new ridership is subject to the level of development of the area in which the transit is offered and to the degree of the competition it faces with automobiles. The level of development is highly unpredictable. In addition, the construction of urban transit includes substantial
uncertainties in terms of its cost and schedule due to possible relocations of existing utilities and to environmental mitigation during construction. Thus, the cost effectiveness of new transit is extremely difficult to forecast.
In Japan, a similar situation has recently occurred. Historically, in Japan, rail has been the most dominant mode of urban transit. It has been more extensively invested in than in the United States by both public and private sectors. Many Japanese use rail rather than automobiles for their urban commutes. Under this circumstance, the problem is the lack of capacity during peak periods; more rail is needed (Japan, Ministry of Transport [MOT], 1997). However, creation of new rail requires substantial investment because of the high price of rights-of-way and of the necessity to replace existing
infrastructures, since in Japanese cities public spaces are limited and urban infrastructures are densely packed. The efficient use of the new rail is also uncertain. While new rail offers adequate capacity during peak periods, its ridership during off-peak hours relies on the level of development in the area along its route and on the competition it encounters with other forms of public transit. Thus, the cost effectiveness of Japanese rail is also unpredictable. Because of their limited funding resources, private railway companies have patticularly suffered from these uncertainties.
The current planning method for urban transit projects does not accommodate these uncertainties. It forecasts only one set of circumstances, opts for one alternative based on that forecast, and invests in it extensively. Once the decision has been made, it is difficult for decision-makers to revise their plans if the circumstances change. In order to maintain sound investments in urban transit in such highly uncertain situations, there needs to be a more flexible planning method which can recognize future risks.
1-2 Objective of Thesis
This thesis proposes Dynamic Strategic Planning (DSP) as a new planning
method in urban transit projects. While the conventional Master Planning (MP) does not account for uncertainty and focuses only on a single decision, DSP not only recognizes risks, but gives the following options for future investment decisions (Trigeorgis, 1996): * Defer the investment in the later periods,
e Expand the investment if the demand growth is favorable,
* Alter the technology in the case of change in demand, " Abandon the project if the project is not profitable.
Benefits of these options will be realized by arrival of new information as time goes by. This flexibility can increase long-term benefits, minimizing the possibility of catastrophic losses.
This thesis uses DSP to conduct a quantitative analysis for the South Boston Piers Transitway Project, the success of which depends on the predicted growth of transit demand in the Piers area that is simultaneously under redevelopment. The thesis then proposes how DSP should be used by the West Japan Railway Company (JR-West), a private company, in those urban rail projects in which future demand is unpredictable. DSP provides clear criteria for project evaluations under such highly uncertain
conditions. This thesis addresses two questions:
e How can DSP accommodate those uncertainties and make the plan more flexible? e By using DSP, how can JR-West improve its planning method for future urban rail
projects?
1-3 Introduction of
Case
Studies
This thesis deals with two case studies: one for an underground transitway project in Boston and the other for a heavy rail project in Osaka. This section briefly introduces these projects.
1-3-1 South Boston Piers Transitway Project
The South Boston Piers Transitway Project is designed to improve transit access to the South Boston Piers area (Piers area) in concert with a redevelopment project conducted by the City of Boston. In 1993, the Massachusetts Bay Transportation
Authority (MBTA) decided to construct a 1.5-mile underground transitway between downtown and the Piers area. This decision was made using MP method: the MBTA chose a single alternative and did not take risks into account, despite the existence of many uncertainties of future ridership, capital costs and funding resources. This thesis uses this project as a case study for a quantitative analysis of DSP. By using decision tree models, it seeks optimal strategies in terms of cost effectiveness when taking risks into account.
1-3-2 Osaka Sotokanjo Line Project
Osaka Sotokanjo Line Project is a 20.3-km heavy rail project in eastern Osaka. The goals of this project are to reduce overcrowding in other urban lines and to provide people in eastern Osaka with a new rail service. This project is being carried out by public/private partnership, including JR-West. While local governments have demanded the implementation of the project for a long time, JR-West has been reluctant to
undertake this project due to its low profitability. In 1997, the creation of a national governmental subsidy for this project made the local governments and JR-West agree to implement it. Despite significant uncertainties including the degree of future
development along the line, only two alternatives have been discussed: going ahead with the full implementation alternative or delaying it until later. By analyzing the process involved in the Boston case study, this thesis examines how DSP could be used for this project. The thesis also makes recommendations for future planning process of JR-West.
1-4 Audience of Thesis
This thesis is directed to the general managers of JR-West, a company which undertakes urban rail projects with the public sector and operates the lines after completion. Assuming they are not familiar with DSP, this thesis, rather than seeking correct answers, emphasizes methodologies of DSP and shows how uncertainties can be accommodated in project planning. Since the managers are involved in real-world decisions, this thesis focuses on practical rather than on theoretical methods of using DSP by applying as much actual data as possible.
1-5 Technology and Policy Issues
In general, public agencies make optimistic assumptions to justify the projects they favor on the basis of political rather than technological criteria. These optimistic assumptions tend to lead to excessive investments despite low cost effectiveness. Also, current urban transit planning methods both in the public and private sectors tend to select a single alternative. As a result, once planners in both sectors create a plan, they tend to remain with it even if the situation around them deteriorates. These are the primary shortcomings of MP, which is still used by many policymakers in both sectors.
DSP can systematically define problems, so that policymakers cannot simply make optimistic assumptions; their decisions must be more realistic. Unlike MP, DSP recognizes all possible alternatives rather than the best one. In other words, DSP can give policymakers opportunities to change their decisions over the life period of a project. This thesis will explain how policymakers can incorporate uncertainties and identify optimal investments considering current possible technologies.
1-6 Structure of Thesis
Figure 1.1 shows the structure of this thesis. Following this introduction, the thesis consists of five remaining chapters.
Chapter Two introduces the methodology of this thesis: Dynamic Strategic Planning (DSP). The chapter first points out shortcomings in the conventional MP. The chapter then describes the advantages of DSP over this conventional planning. It
explains how DSP accommodates uncertainties and defines optimal strategies based on its theory. In order to demonstrate the practical use of DSP, the chapter also reviews the literature concerning DSP.
Chapter Three presents the background of the South Boston Piers Transitway Project. This project faces high degrees of uncertainties: ridership, costs and funding resources. This chapter describes how the conventional MP method was used to make the decision for this project. The chapter then highlights uncertainties that were not taken into account in this decision, referring to the difference between the forecasts and the actual outcomes in past US urban rail projects.
Chapter Four conducts a quantitative analysis for the South Boston Piers
Transitway Project by applying DSP. It evaluates several alternatives including the one adopted in actuality. It then demonstrates how the DSP method accommodates
uncertainties and calculates expected values by using past data. The result shows that a smaller investment in the first stage not only maximizes its expected cost effectiveness but also minimizes the risk exposure due to its flexibility. This decision is not affected by the fluctuation of federal financial share for the project. Sensitivity analysis also confirms this result.
Chapter Five explores the application of DSP to Japanese urban rail projects through qualitative analysis. Specifically, the chapter focuses on the Osaka Sotokanjo Line Project, which confronts unforeseeable ridership growth along the line. The chapter proposes how uncertainties should be considered and shows that what types of
alternatives should be taken into account. It then makes the recommendations that JR-West use DSP for future planning of urban rail projects.
0
e
Chapter 3: Background of Boston's Case Process of current decision-making Uncertainties taken into account
Chapter 4: Application of DSP to Boston Case
e Alternatives considered e Definitions of uncertainties
e Consideration of political risk: federal
financial share
Chapter 5: Application of DSP to Osaka Case
e Overview of the case project e Methods of application of DSP
e Recommendations for JR-West's planning
method for urban rail projects
Chapter 6: Conclusions
Figure 1.1 Structure of Thesis Chapter 2: Methodology
e Shortcomings of Master Planning (MP)
e Advantages of Dynamic Strategic Planning (DSP)
Chapter 2
Methodology: Dynamic Strategic Planning
This chapter introduces Dynamic Strategic Planning (DSP), the research method used in this thesis. It then reviews the literature concerning DSP.
2-1 Introduction of DSP
This section introduces the theory of DSP. It first discusses the shortcomings of conventional MP. It then explains merits of DSP and the calculation methods.
2-1-1 Shortcomings of Master Planning (MP)
In general, master planning (MP) is undertaken according to the following procedure (de Neufville (1990a)):
1. Forecast future demands or loads,
2. Compare alternatives in terms of their expected performances, 3. Select the best alternative.
This procedure seems reasonable because a planner chooses the alternatives that provide the most benefits under the forecast. It is simple and understandable. However, it can have fatal shortcomings.
The first shortcoming is that a forecast is often wrong. In order to calculate the future benefits of a project, future conditions have to be quantified. Due to the existence of uncertainties, a planner usually creates fixed assumptions by using limited past data
that the planner considers the most reliable. However, such limited past phenomena never explain all future outcomes; uncertainties have infinite numbers of combinations that rarely re-occur; the situation will vary with states of nature. As a result, the forecasts originating from these fixed assumptions seldom match actual events. Examples that show this discrepancy include forecasts of numbers of flights in the United States (de Neufville (1990b)) and the world oil prices (Smets (1999)).
The second shortcoming of MP is that selecting a single alternative sacrifices future flexibility. The chosen alternative also may not be the best because the choice is based on the problematic forecasting discussed above; and even if the "best" is
appropriate at the time the decision is made, the "best" can change because future conditions differ from present ones. In short, the best alternative reached using MP method focuses on short-term benefits rather than long-term ones. Selecting a single alternative eliminates further considerations of other alternatives that may give long-term benefits, and does not allow for the opportunity to reconsider them.
The third shortcoming of MP is that a planner tends to be reluctant to shift to another alternative even if the situation under which the choice was made deteriorates. Once an alternative is selected, the commitment is considered final. The planner is disinclined to change his mind because changing the alternative would mean wasting time and money he has invested. As a result, under MP the planner usually remains with the single alternative selected.
The size of a project also affects the degree of the flaws; as the scale of the project grows, the degree of correctness decreases. For example, consider a small project that includes only one uncertainty. If a forecast predicts the future events correctly with a
probability of 90%, the level of the correctness of this forecast is 90%. However, in the case of a larger project that includes five equal independent uncertainties, the probability of correctness is dramatically reduced to 59% (= 0.95).
In summary, MP has procedural flaws in terms of its wrong assumptions,
inflexibility, and resistance to change once the alternative has been selected. These flaws increase as the size of the project becomes larger. In order to address these shortcomings, a new planning method should be adopted.
2-1-2 Merits of DSP
In response to the shortcomings of MP, Professor Richard de Neufville of MIT (1990a) has introduced the Dynamic Strategic Planning (DSP) method. While MP is rigid and deterministic, DSP is flexible. Compared to MP, DSP has the following merits: * It systematically structures the problem that MP only takes into account collectively,
e It accommodates uncertainties rather than relies on forecasts,
e It values new information during the life of the project and gives decision-makers
options; decision-makers can choose whether or not to exercise these options depending on the value of the new information.
2-1-3 Structure of Problems
DSP structures the problems that affect all relevant choices and considers all possible outcomes. This process is done by means of a decision tree.
The decision tree is a conceptual device that includes possible decisions that can be made and outcomes that may occur as a result of the choices made and states of nature. The decision tree consists of two nodes:
e Decision nodes (D), which are the moments when possible decisions are considered
and a decision is made,
e Chance nodes (C), which are the periods after a decision is made in which outcomes
are determined by prevailing events or states of nature.
Graphically, the sequence is:
D-C-D-C-.
The decision branches out from an initial node to subsequent nodes where there is further branching, hence the metaphor of "tree" as shown in Figure 2.1. Thus, the
decision tree systematically decomposes the problems by considering all possible decisions and the subsequent outcomes that may occur. The decision tree can give decision-makers insights that will assist them in identifying all factors involved in their decisions.
2-1-4 Accommodation of Uncertainties
While MP decides upon a future outcome by simply depending on a forecast, DSP accepts that the future cannot be known. It gives possible outcomes with ranges of possibilities in chance nodes in the decision tree. Assuming an outcome and its
possibility of occurrence are respectively represented by Pj and Oij, which are subject to a possible decision Di and an uncertain event, Ej, the sequence in a chance node is: C - Probability, Pj - Outcome Oij
Figure 2.2 gives a more complete representation of chance nodes.
There are several assumptions in chance nodes. The first is that branches in chance nodes define all possible events, Ej, which may occur. If uncertain events are states of weather, Ej may represent fine, or cloudy, or rainy, for example. The second assumption is that these events should be distinct; if they are not, double counting will result. In other words, these events should be mutually exclusive and collectively exhaustive, so that their probabilities, Pj, sum to 1.0. In the weather example, the states of weather could be defined as fine, or cloudy, or rainy.
One way to estimate probability is to use distributions of outcomes obtained from past data. These distributions give the range of possibility of each outcome. If such historical data is not available, a reasonable probability for each outcome can be used. The rationale of the chosen possibilities is examined by sensitivity analysis.
When outcomes are determined by two or more independent events, it is necessary to calculate their joint probability of occurrence. For example, consider the creation of a new transportation system whose success depends on its cost (low, medium or high) and the states of ridership (low, medium or high). The actual outcomes will depend on events that occur as a result of combinations of these two events such as "low cost and low ridership," "high cost and medium ridership," and so on. Again, these
resulting outcomes should be independent of each other. Therefore, the probability of "low cost and "low ridership" is calculated by the probability of "low cost" times the probability of "low ridership." If many events are involved in a chance tree - that is, if a number of possible outcomes could occur - these resulting outcomes can be converted to another outcome such as a cost per ridership (low, medium or high). The probability of each cost per ridership can be obtained from the distribution of joint outcomes (cost per ridership) resulting from the sequence of chance events (cost and ridership). The expected value of each decision is its average value:
EV(Di)= Piii
The best decision for a period decision tree is the one with the highest expected value:
Max (EV(Di))
To find an optimal decision for more than one period, we can simply calculate the best decision stage by stage, starting with the last period. The merit of this process is that we can define the best decision for each period and drop all other possible decisions from consideration; we can focus only on the best decision for each period. This process is known as "pruning" the decision tree. Since actual cases include a substantial number of possible decisions, the pruning inevitably makes the problem less complex by eliminating all decisions that are not optimal.
C
D
C
D<-DD
C<<
D
C
Figure 2.1 Sketch of Decision Tree Source: de Neufville (1990a)
Pj
D
-C
-Outcomes
Oij
Figure 2.2 Sketch of Chance Node Source: de Neufville(1990a)
2-1-5 Consideration of Value of Options
MP is a "now or never" type of decision (Smets, 1999). It does not accommodate uncertainty, and may even eliminate decisions that may be the best in the long-term. Again, consider the construction of a new transportation system in a developing area. In this situation, a planner usually evaluates only two extreme alternatives, "construct now" or "do nothing," using a single forecast. If "do nothing" is selected and if the level of the future development is higher than forecast, the area may suffer from heavy traffic
congestion due to the lack of public transit capacity. What is worse, the construction of the new transportation system may no longer be possible later on, because the acquisition of the right of way will be difficult and the construction activities such as noise and vibration will have substantial environment impacts after the area is developed. Thus, decisions made by MP can lead to catastrophic losses.
Unlike MP, DSP insures decision-makers against such catastrophic losses. The final decision, "construct" or "do nothing," can be delayed as new information arrives. In the first stage, DSP considers another alternative - "purchasing only right-of-way," for example. This alternative gives decision-makers options: if the level of the development is "high" among possible events, construction should be started; if the level of the development is "low," the new transportation can be delayed or abandoned. In the latter case, the purchased right-of way can be temporally used for another purpose such as bus lanes and bike paths until the demand grows. Thus, DSP incorporates the value of information concerning the level of the development into its analysis. This value of the new information can increase the overall expected value of the project.
Decision-makers may pay more to buy insurance in the first stage than they would if using MP method. However, this additional cost is compensated for by the fact that catastrophic losses can be avoided and that people are usually risk-averse. Thus, DSP can identify the optimal long-term decision.
This optimal long-term decision is a strategy. It can be considered a sequence of decisions contingent on all the possible outcomes. It does not simply determine a single sequence of decisions best for all occasions but dynamically affects all possible decisions over the lifetime of the project.
2-2
Literature Review of DSP
DSP has been adopted in various fields, from technology choice to business decisions. This section introduces the recent literature concerning the application of DSP. Since this thesis proposes the practical use of DSP, the methodology of each case is emphasized.
2-2-1 Expansion of Established Industry
Aberdein (1994) applied DSP for evaluating a past plan for the capacity of a power station in South Africa with an uncertain electricity demand. In the analysis, he assumed two sizes of generation units, 620MW or 310 MW, and the number of units in the power station as decision variables of the plant's capacity because they involved a risk/cost trade-off and interacted with the range of possible outcomes. As possible outcomes, variability in the growth of demand for electricity is considered. This
variability is represented as three standard deviations, 1%, 3.2% and 5%, in the historical 7%-per-year demand growth.
As a criterion for the decision-making, he used lost opportunity costs resulting from over or under-capacity for each possible demand mentioned above. He estimated distributions of differences between the capacities and the demands by using the Monte Carlo simulation. Next, he calculated the unit lost opportunity costs of 6x620MW and 3x3 10MW stations for the three standard deviations. Then, the unit lost opportunity costs of two stations were compared based on the criterion; the lower the cost, the better it was.
The result showed that the 3x3 10MW station is preferable to the 6x62OMW in most cases. A sensitivity analysis with respect to demand growth ranging from 0% to
10% also proved this result for most ranges of demand growth. As a result, he concluded that the smaller 3x3 10MW power station would have more flexibility than the larger
6x620MW power station, taking into consideration the unforeseeable growth of demand.
2-2-2 Response to Government Regulations
Ungredda (1993) used DSP to seek an optimal decision for Petroleos de Venezuela, S.A. (PDVSA), Venezuela's state-owned oil monopoly company, which operated the internal corporate flight departments (CFD). PDVSA was faced with the mandatory sell-out of all state-owned aircraft announced by the government in 1992 in order to reduce the deficit. PDVSA had three choices: resistance strategies (justification of CFD), a sell-out strategy (abolition of CFD), and spin-off strategies (creation of an autonomous firm). The issues involved among these three choices were the trade-offs
between the costs of CFD and the real value gained from the internal air services; the more internal air services PDVSA kept, the higher their real values such as reliability and flexibility, but the less their cost-effectiveness due to their isolation from the external economic environment.
Each strategy faced an uncertainty. The resistance strategies encountered the following uncertainty: how many airplanes should be sold in order to justify CDF (no sale, partial sale or total sale)? The sell-out strategy faced the uncertainty of what level of air services of the existing commercial air carriers could be maintained (high, medium or low). The spin-off strategies included the risk of the degree of market response an autonomous firm would receive (high or low).
Decision criteria consisted of the level of air service, the overall cost, the
rearrangement of employees of PDVSA's Air Transportation Department (ATD), and the loss incurred in the worst case scenario.
The results showed that the best strategy would change according to which criteria were weighed; the optimal choice relied on PDVSA's preferences. Ungredda recommended the spin-off strategies as the most realistic ones because of their organizational flexibility; while reducing long-term costs without losing many ADT employees, PDVSA could keep a degree of control over the quality and the availability of its air services. The spin-off strategies also gave ADT time to seek its new opportunities and adapt to them using their available resources.
2-2-3 New Product Development
Kimura (1995) analyzed the process by which newcomers to the silicon wafer industry develop and compete with leading companies. The silicon industry is characterized by its low profitability due to the devaluation of wafers and rapid
technological changes. As a result, a newcomer tends to make an inefficient investment if he depends on the conventional MP that is often based on inadequate forecasts. Kimura used DSP in order to find optimum strategies for newcomers in the silicon industry.
The period for the development process was divided into two 5-year phases. For the first phase, the newcomer would make four decisions: the size of the wafers (5 or 6 inch, or 8 inch), the incremental volume of the investment each year (0.5 million wafers or 1 million wafers), the initial plant capacity (0-5 million wafers), and relative wafer price to leafing companies (93% or 95%). In the second phase, the additional plant capacity (0-5 million wafers) would be reconsidered depending on the rate of the market penetration revealed in the first phase. The market penetrations are considered as uncertainties in both phases and affect the profitability of the newcomer.
Kimura conducted sensitivity analyses for each decision factor. The results showed that the newcomer should develop 8 inch wafers rather than 5 or 6 inch wafers because of their higher contribution margin and greater market growth. In the first phase, the newcomer should make a smaller investment (0.5 million wafers for incremental investment and 0.5 million wafers for initial capacity). In the second phase, a larger investment (1 million wafers for incremental investment) is preferable. The wafer price should be set at 93% of that of leading companies. The choice of additional plant
capacity in the second phase depends on the rate of market penetration in the first phase; the higher the rate in the first stage, the larger additional plant capacity should be made in the second phase. These results imply that DSP reduces the risk of catastrophic loss the newcomer would suffer upon entering the competitive and changeable silicon market by making a small investment in the first phase when the market penetration level is
uncertain. Depending on the profitability in the first stage, the newcomer can make flexible decisions in the second stage: to expand the plant capacity or to stay at the level of the its present capacity.
2-2-4 Technology Choice
Nababan (1993) adopted DSP for the design choice of the sewage disposal system for the Boston area. He evaluated three single systems of sewage disposal technologies (pelletization, composting and backup-landfilling) and two hybrid systems which
included pelletization and composting to be used with or without backup-landfilling. As uncertainty, he considered contingent costs for each technology based on mitigation costs, technical efficiency and so on. Sensitivity analyses were conducted for three discount rates, 4%, 6% and 8.6%, and two reliability levels of the systems, 95% and 90%. Decisions were made twice; the first was made in 1994 to select one system from among the five possible systems; and the second was in 1999 the choice was to be made either to expand the capacity or shut down the system and use private-landfilling, which is more expensive than any other technology. Only the hybrid systems have three choices in the second stage: expanding both technologies, expanding one or the other, or shutting down.
This analysis revealed that hybrid systems are superior to other single technology systems with respect to lower expected costs, smaller risks and a lesser probability for catastrophic performance (using private-landfilling). Also, the results showed that hybrid systems have more flexibility in dealing with uncertainties. In other words, in the second stage the hybrid systems can employ the better of the two technologies and discard the unsuccessful technology used in the first stage.
Nababan's analysis demonstrated that DSP is better than conventional MP because DSP recognizes the risks involved in the technology planning, considers hybrid alternatives and values the long-term benefits over the short-term ones. Conversely, MP is inferior to DSP because it simply relies on the forecast, tends to select a single
technology and weighs on myopic gains. Nababan concluded that opting for DSP is like buying insurance; the extra cost of the insurance should be weighed against the gains of
potential cost savings when the uncertainty is high.
2-2-5 Time to Market
As in the above cases, costs and benefits are treated as monetary values. In most cases, however, costs and benefits include other factors such as inconvenience due to shortage of electricity and environmental damage caused by landfilling. In other words, costs and benefits should be measured by utility. Since people are generally risk-averse, their utilities are not often linear; as the value of units of a product of a system increases, the rate of increase in the utility diminishes. Utilities can be obtained by means of collective interviews and surveys of decision-makers and then transferred to risk-averse utility functions.
Benz (1993) applied a risk-averse utility function to DSP for the design and development of an embedded space computer developed by NASA. He conducted two kinds of surveys in order to obtain utility losses of development schedule delays that were mainly caused by shortages in the budget, technical problems and changing requirements of users. Based on this data, he created a utility function with respect to the timeliness of the schedule of computer development.
In this analysis, Benz compared six alternatives including two hybrid technology alternatives; "hybrid a" was superior to "hybrid b" in utility value but more expensive. By adopting the utility function into DSP, he showed that "hybrid a" was preferable in terms of its higher utility value and lower risks. Based on this result, he proposed that despite its initial high cost, a hybrid technology system offers greater flexibility since it allows for choosing appropriate technologies at a later period.
2-2-6 Siting New Capacity
DSP has replaced MP in practical cases in many ways. de Neufville (1990b) recommended the following procedure for the use of DSP in airport planning:
1. Education of client to recognize the real range of uncertainty as a fundamental reality of the situation,
2. Analysis of alternatives of the sequence of design choices considering the risks involved and the impacts of a range of scenarios,
3. Selection of a site as insurance against future risks and as part of a strategy for dealing with these contingencies.
de Neufville (1990b) adopted this procedure in an airport plan for Sydney,
Australia. First, he made the client, the Australian Department of Aviation, recognize the uncertainty involved by pointing out that no past forecast of the growth rate of air
passengers matched the reality and that the forecasts substantially differed from each other. Based on the range of forecasts, de Neufville created three scenarios of the growth rate of air passengers (low, median and high).
Second, instead of deciding whether or not to build a new airport at that time, as had been discussed twice in the past, de Neufville proposed an alternative: the acquisition of the site for the future airport. The final decision could be made depending on the future growth of air passengers. This choice provided insurance against the extremely unpleasant ecological, economic, and political possibilities associated with rapid growth in demand and the possibility of having nowhere to create the new airport. The
Australian government adopted this alternative.
Finally, the Australian government narrowed down the site selection. This selection was well received by both the public and the press because the recommendation recognized the uncertainties which the opponents of a new airport pointed to in their arguments. As a result, the proposed procedure was completely successful.
This case showed that the insurance (acquisition of the site) not only takes into account the future possibilities (construction of the airport) but also avoids catastrophic losses (nowhere to create the airport). The cost of this insurance is traded off with the value of whatever decisions the government might eventually wish to make after obtaining new information concerning the growth of air passengers.
2-3 Summary
This chapter introduces the methodology of DSP compared with that of MP. While MP unreasonably eliminates risks by using a wrong forecast, DSP incorporates risks into the analysis and structures problems systematically. DSP also considers the value of new information and gives decision-makers the option of postponing the final decision, thus avoiding catastrophic losses. As shown in the literature review, DSP can improve the decision-making that is currently conducted using MP method.
Chapter 3
Background of South Boston Piers Transitway Project
This chapter introduces the South Boston Piers Transitway Project. The chapter consists of six sections. The first explains the current and future traffic conditions in the South Boston Piers area. The second presents how the transitway alternatives were developed by the MBTA. In the third and fourth sections, the chapter highlights the MBTA's process for its final decision-making. The fifth describes uncertainties included in the MBTA's final decision, referring to differences in ridership and costs between forecast and actuality in US urban rail projects. The final section summarizes the chapter.
3-1 Current and Future Traffic Situation of Piers Area
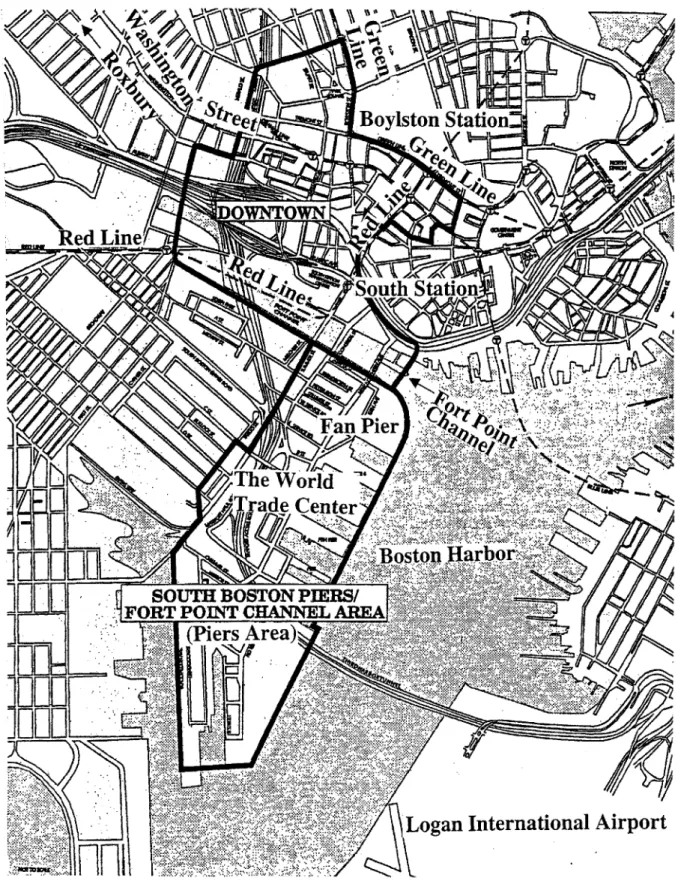
The South Boston Piers/Fort Point Channel Area (Piers area) is a 300 acre peninsula that is located directly east of downtown Boston and one mile from Logan International Airport across Boston Harbor (Figure 3.1). Most of the eastern part of the area is used for maritime industrial and industrial purposes (City of Boston, 1997). The western part of the area contains residential, commercial and public facilities. Currently, roughly 40,000 daily one-way trips are made to access the Piers area. During a peak hour, about 7,000 one-way trips are generated (US DOT Federal Transit Administration
[FTA] and MBTA, 1993).
Despite the proximity of the Piers area to downtown, these two areas have limited access to each other. Although only three bridges cross the Fort Point Channel between
downtown and the Piers area, about 80% of trips to the Piers area are made by
automobiles. As a result, there is heavy traffic congestion at the interfaces between the two areas. Two of the bridges suffer from traffic jams with Level of Service (LOS) E (unstable flow) and F (significant congestion and delays) in the morning peak period (FTA and MBTA, 1993).
Public transportation to the Piers area is also poor; there are only three MBTA buses with infrequent service. The MBTA estimated that with these three services about
1,750 people per day are destined for the Piers area. In addition to these local buses, a number of private shuttles run between downtown and the Piers area (FTA and MBTA, 1993).
In this situation, more than 1,000 acres, including the Piers area, are currently being redeveloped on the initiative of the City of Boston. Table 3.1 shows land projections of the Piers area in 1986, 2000 and 2010. Based on these projections, the MBTA estimated that one-way trips to the Pier area would equal 90,000 each day with 18,000 during peak hour in 2010 (FTA and MBTA, 1993). Figure 3.2 shows the appearance of the Piers area at present and in 2010.
By 1986, the City of Boston realized that improvements in access between downtown and the Piers area were essential for accommodating future traffic demand (Globe, 1987). Thus, in 1987, the MBTA started its Feasibility Study for a new public transit system in the area (MBTA, 1987).
International Airport
Figure 3.1 Locations of Piers Area and Downtown of Boston Source: Author's modification of FTA and MBTA (1993)
Table 3.1 Piers Area Current and Projected Land Use
1986 2000 2010
Land Use Category (Base case) (Lower growth) (High growth)
1000 ft2 % 1000 ft 2 % 1000 ft2 % Office 2,343 25 6,015 42 10,323 47 Retail 290 3 436 3 834 4 Cultural/Recreational 555 6 593 4 663 3 Industrial 5,863 63 6,039 42 6,173 28 Hotel 0 0 229 2 1,445 7 Residential 103 1 771 5 2,064 9 Transportation 183 2 228 2 233 1 Total 9,336 100 14,310 100 21,734 100
Source: Massachusetts Department of Transportation Planning Staff (CTPS) (1989)
South Boston Piers as it Appears Today
COUn~fmoi
I "M
P" 4
South Boston Piers Projected Development 2010
Figure3.2 Present and Projected Appearance of Piers Area Source: FTA and MBTA (1993)
3-2 Transit Alternatives MBTA Considered
This section explains how the MBTA developed transitway alternatives before its final decision in 1993. It helps to understand that the decision-making of this project has characteristics similar to those of US urban rail projects described later in this chapter; the section focuses on how the MBTA polarized its alternatives and then was inclined to the most cost intensive alternative under unforeseeable transit demand.
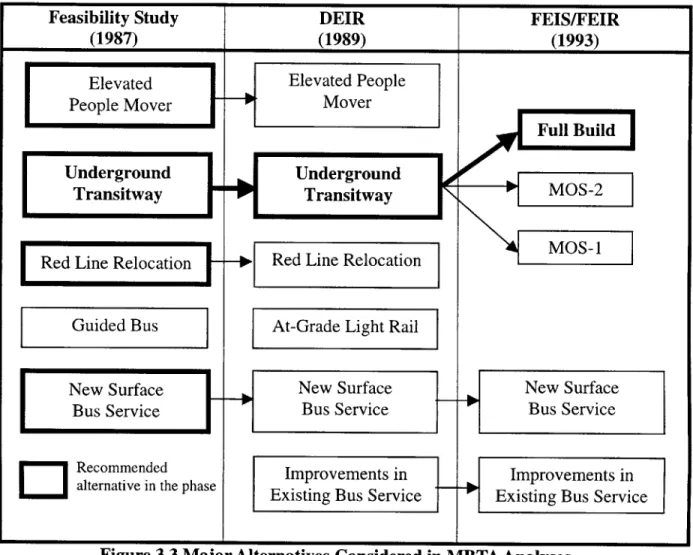
When the MBTA began its Feasibility Study for a transit system in the Piers area in 1987, it considered six major alternatives, including an underground transitway between downtown and the Piers area. The other five alternatives include two different alignments of elevated people movers, the relocation of Red Line (existing underground heavy rail running near the Piers area), guided buses, and new surface bus services
(Figure 3.3) (FTA and MBTA, 1993). The MBTA assumed that among these alternatives the underground transitway would have the greatest transit mode share but would be one of the most expensive alternatives (MBTA, 1987). In this Feasibility Study, the MBTA considered an automated guideway transit (AGT) as a vehicle technology.
The MBTA then took into consideration other vehicle technologies, including a light rail, trackless trolley (electric bus) and a dual mode bus (which uses electric power in the tunnel, but switch diesel power on surface streets). A light rail technology could make a connection to an existing light rail line at Boylston Station. Bus technologies permit a connection to Washington Street Replacement Transit Service that the MBTA would improve transit services along Washington Street between Boylston Station and Roxbury in order to compensate for the loss of an old Orange Line (heavy rail), relocated in 1987. By contrast, AGT could not make any connection to these lines because of its
different operational method from these lines. Thus, the MBTA had favored a light rail or bus technologies.
In 1989, in its Draft Environmental Impact Report (DEIR), the MBTA recommended the underground transitway among all alternatives, although it would require the largest costs (Table 3.2). The MBTA valued this alternative because of its greatest transit mode share and connectivity to other lines, as mentioned above. The MBTA also made two recommendations that could affect later decision-making. The first concerned vehicle technology; the MBTA favored either a trackless trolley or a dual mode bus rather than a light rail because either would provide maximum routing
flexibility on surface streets. In contrast, a light rail needs fixed-guideways. The second recommendation concerned the location of the tunnel terminuses:
An initial operable segment should be constructed from South Station across the Fort Point Channel to the vicinity of Fan Pier. As development increases in this area and financing becomes available, a subsurface connection should be constructed between South Station and Boylston Station. The extent of subsurface construction in the Piers area will be dependent on available financing, development levels, and construction phasing and final alignments of this levels, and related roadway and real estate development projects. (MBTA, 1989a)
Thus, the MBTA concluded that it would develop the final alignment of the underground transitway alternative in further studies despite its largest capital costs
Figure 3.3 Major Alternatives Considered in MIBTA Analyses
Source: Author's modifications of the names of alternatives with MBTA (1987), MBTA (1989a), and FTA and MBTA (1993)
Table 3.2 Capital and O&M Costs of Major Alternatives Considered in DEIR
Alternative Capital Cost (1988$) Transit Share(%)
Underground Transitway (AGT) 468.0 60
Underground Transitway (light rail) 447.4 61
Underground Transitway (trackless trolley) 420.5 63
Underground Transitway (dual mode bus) 438.3 63
Red Line Relocation 313.2 59
At-Grade Light Rail 171.3 58
New Surface Bus Service 152.7 52
Improvements in Existing Bus Service 21.5 37
3-3 Three Alternatives for Final Decision-Making
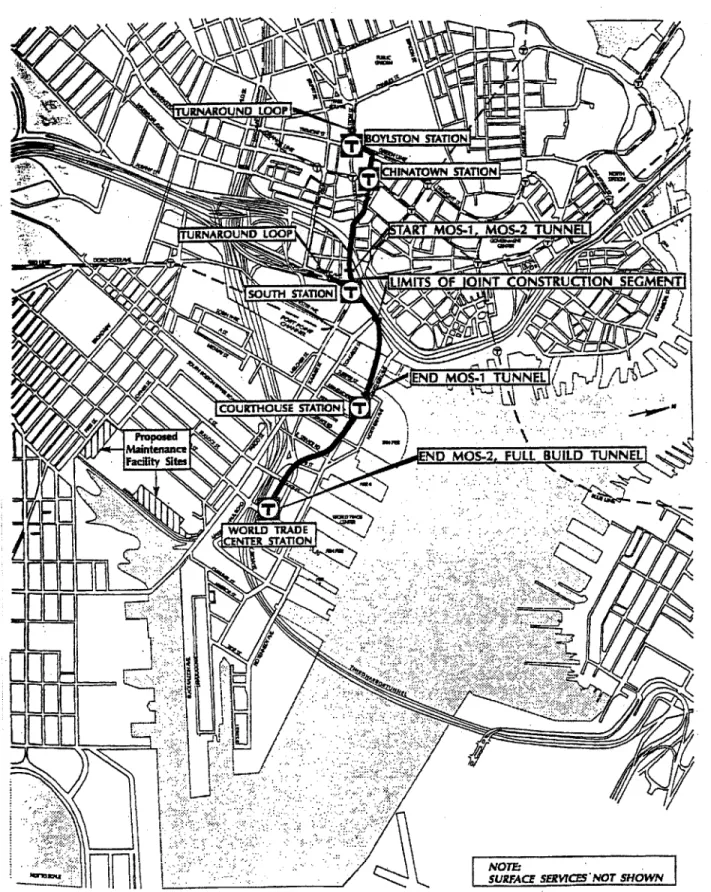
In response to recommendations made in DEIR, the MBTA further analyzed the underground transitway. Both in 1992 and in 1993, it proposed three possible
alternatives, depending upon the length of the tunnel:
e Full Build: Boylston Station - the World Trade Center (WTC)
" Minimum Operable Segment-1 (MOS-1): South Station - WTC
" Minimum Operable Segment-2 (MOS-2): South Station - the Courthouse
Although the MBTA proposed two other non-cost-intensive alternatives simultaneously, this thesis excludes them from the analysis in order to focus on the difference among the three underground transitway alternatives.
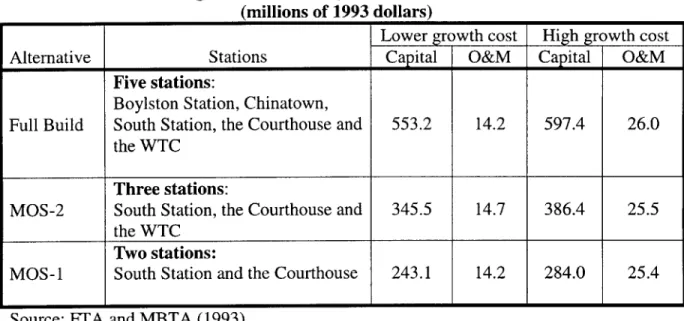
Figure 3.4 illustrates their alignments. Table 3.3 shows their stations and capital and operational and maintenance (O&M) costs. Table 3.4 presents estimated ridership and transit mode share for each alternative. Note that these numbers include those for supplemented improvements in surface buses. Compared to the Full Build alternative, either MOS alternative could reduce the capital costs by more than 35%, although at a penalty of about 10% less transit trips. The MBTA mentioned that "the tunnel
construction in either MOS option would be designed to accommodate later extension of the Transitway tunnel to the Full Build limits" (FTA and MBTA, 1992).
N, IA\ 'END MOS-1 TUNNELI ,J
Ub0--
COURTHOUSESTTO-Proposed
ftdrity sitesEND MOS-2. FULL BUILD TUNNELIN
<:1 NOTE:
SURCE SERVICES'NOT SHOWN
Figure 3.4 Alignments of Underground Transitway Alternatives Source: FTA and MBTA (1993)
Table 3.3 Underground Transitway Alternatives: Stations and Costs (millions of 1993 dollars)
Lower growth cost High growth cost
Alternative Stations Capital O&M Capital O&M
Five stations:
Boylston Station, Chinatown,
Full Build South Station, the Courthouse and 553.2 14.2 597.4 26.0 the WTC
Three stations:
MOS-2 South Station, the Courthouse and 345.5 14.7 386.4 25.5
the WTC Two stations:
MOS-1 South Station and the Courthouse 243.1 14.2 284.0 25.4 Source: FTA and MBTA (1993)
Table 3.4 Estimated AM Peak Hour and Daily Transit Ridership and Mode Share to Piers Area in 2010
AM peak hour Daily
Alternative Ridership Mode share Ridership Mode share
(trips/both ways) (%) (trips/both ways) (%)
Lower growth scenario
MOS 6,200 51 22,000 33
Full Build 6,600 54 24,400 37
High growth scenario
MOS 10,600 59 34,100 37
Full Build 11,200 62 37,100 42
3-4 MBTA's Decision: Full Build Alternative
In 1993, MBTA's Final Environmental Impact Statement/Final Environmental Impact Report (FEIS/FEIR) (MBTA report thereafter) concluded that the Full Build alternative would be the most appropriate. This decision was made despite the fact that the MBTA implied in its DEIR that a shorter tunnel alternative would be appropriate as an initial investment, considering the unforeseeable degree of development in the Piers area and finical constraints.
As a vehicle technology, a trackless trolley bus service was adopted. In the case of a higher demand for transit services in the future, the transit tunnel could be transformed into a light rail system.
The MBTA concluded that the construction of the underground transitway would be divided into two phases. The first would be the same as the MOS-2 alternative, the tunnel section between South Station and the WTC. The construction of this section would start in 1994 and be completed in 2000. The second phase, between South Station and Boylston Station, would begin after the completion of the first phase.
As for funding resources, the MBTA assumed the federal government would support 80% of the capital costs and that the remaining 20% would be paid by the state. In November 1994, the Federal Transit Administration (FTA) signed an agreement that the federal government would support 80% of the construction cost for the first phase.
However, Congress has not yet authorized the federal assistance for the second phase construction. As of 1999, no decision concerning the finance for the second phase has been made.
3-5
Uncertainties Remain: Is Full Build Alternative Best?
This section discusses uncertainties included in the choice of the MBTA by
introducing uncertainties experienced in other US urban rail projects. Although the South Boston Piers Transitway Project is not a rail project, its capital investment is comparable with rail projects. The transitway can in fact accommodate light rail in the case of a higher demand. Thus, this section often refers to comparable US urban rail projects.
3-5-1 Uncertainties in Forecasting Transit Demand
In the United States, several studies have shown that ridership forecast for urban rail projects are often too optimistic (Martin (1986), Pickrell (1990), Cox (1997) and
Richmond (1998)). Table 3.5 illustrates this fact.
This tendency can be also seen in the South Boston Piers Transitway Project. In evaluating its three alternatives, the MBTA used "high" and "lower" scenarios for the year 2010. These were based on land-use projections (Table 3.1), originally created in
1989 for the Central Artery/Tunnel Project, the $10.8-billion underground highway project in downtown Boston. The "high" and "lower" growth scenarios refer to these
land-use projections for the years 2010 and 2000, respectively. The MBTA used these land-use projections because they were the only ones that represented the details of the Piers area demographic information; no other forecast had such a level of detail. This high level of detail served well in forecasting traffic demand within the Piers area and determining the locations of transitway stations (Kuttner, 1999).
Despite their convenience, the MBTA should not rely solely on these land-use projections for two reasons. The first is that they might be inaccurate: future ridership