Analysis of Activity-Based Accessibility
byXiaojing Dong
Bachelor of Science in Civil Engineering, Tsinghua University (1998)
Submitted to the Department of Civil and Environmental Engineering in Partial Fulfillment of the Requirements for the Degree of
Master of Science in
Transportation Systems
at the
Massachusetts Institute of Technology
September 2000
C 2000 Massachusetts Institute of Technology All rights reserved
Signature of Author , , ,~//
Department of Civil and Envonmental Engineering August 11, 2000
Certified by
Edmund K. Turner Professor of Civil and
Chair, De
Moshe E. Ben-Akiva Environmental Engineering Thesis Supervisor
Daniele Veneziano
>artmental Committee on Graduate Studies
MASSACHUSETTS INSTITUTE
OF TECHNOLOGY
SEP 1 5 2000
Accepted byAnalysis of Activity-Based Accessibility
ByXiaojing Dong
Submitted to the Department of Civil and Environmental Engineering on August 14, 2000 in partial fulfillment of the requirements for the Degree of
Master of Science in Transportation Systems
Abstract
This analysis studies the properties and performance of the Activity-Based Accessibility (ABA) measure, which is generated from the Day Activity Schedule (DAS) model system. The DAS model is an integrated system representing all the activities and trips taken throughout a whole day. It uses the concept of activity pattern, which refers to the sequences, structures and relationships among all the activities and trips taken by an individual during a whole day. The ABA is defined as the expected maximum utility over the choices of all the alternative activity patterns. In this way, the ABA measure reflects an individual's whole day travel schedule; traditional measures of accessibility focus on a single trip (e.g. the work trip).
Data from Portland, Oregon, was used to explore the empirical properties of the ABA. It shows that the ABA is a comprehensive measure with the capability to reflect each individual's perception of the interrelationship between the land use pattern and transportation system. The ABA displays reasonable sensitivities over the three important components: land use patterns, level-of-service of transportation systems and taste variations across the population. By comparing the ABA with traditional trip-based measures, including isochrone measures, gravity-based measures and the
simple utility-based measures, the study highlights the advancement of the ABA measure. Among traditional measures, the simple utility-based measure based on a destination-mode choice model is the most advanced. The comparison between a work trip simple utility measure and the ABA measure demonstrates that the results differ; the simple utility-based measure is impacted more by both the CBD and transit, whereas the ABA shows a heavier influence of auto and non-CBD activity centers.
Thesis Supervisor: Moshe E. Ben-Akiva
Acknowledgments
It's my pleasure to take this opportunity to express my gratitude to many people who have contributed to this thesis.
First, I would like to thank Professor Moshe Ben-Akiva, my advisor and thesis supervisor, for his guidance, support and advice on this research. Professor Ben-Akiva suggested the idea on the analysis of Activity-Based Accessibility, and guided the process of this work.
Also, I would like to thank Dr. John Bowman, who established and improved the Day Activity Schedule model system on which my work is based. Dr. John Bowman also provides many insightful suggestions and advice. I would also like to give sincere thanks to Joan Walker for her guidance and encouragement.
I would also like to thank many CTS fellows at MIT: Jon Bottom, Scott Ramming, Shan Lan, Su Shen, Tomer Toledo, Atul Dalmia, Bruno M Fernandez Ruiz, Vinay
Yadappanavar, Jennifer Farver, Masroor Hasan, Seong-Cheol Kang. With them I have shared stimulating conversations and the graduate student life and it will be a wonderful memory in my future life.
I would also like to thank Alicia Jones, Yuxun He and Margaret Holmes for their generous help on wording and editing.
Special thanks to my husband Jiang Zhang for his understanding and love.
Finally, I would like to present this paper as a gift to my dad Zhengshen Dong, my mom Yanhua Li, and my sister Xiaoyu Dong. Without their unfailing encouragement, I could not have got over so many frustrations and kept myself on the track of the academic pursuit. Thank you, my parents, friends and all others who have helped me.
TABLE OF CONTENTS
CHAPTER 1. INTRODUCTION AND BACKGROUND ... 7
1.1 A C C E SSIB IL IT Y ... 7
1.2 M O T IV A T IO N ... 8
1.3 RESEARCH OBJECTIVES... 10
1.4 DAY ACTIVITY SCHEDULE MODEL SYSTEM AND ACTIVITY-BASED ACCESSIBILITY ... 11
1.4.1 The Portland implementation of the DAS... 12
1.4.2 The activity-based measure of accessibility ... 13
1.5 OUTLINE OF THE THESIS ... 14
CHAPTER 2. LITERATURE REVIEW ... 15
2.1 APPLICATIONS OF ACCESSIBILITY...15
2.1.1 Accessibility of a geographical area...15
2.1.2 Accessibility of transportation infrastructure...17
2.1.3 Accessibility of a business ... 17 2.1.4 Accessibility of individuals... 18 2.2 M EASURES OF ACCESSIBILITY ... 19 2.2.1 Isochrone measures...20 2.2.2 Gravity-based measures...21 2.2.3 Utility-based measures...22 CHAPTER 3. M ETHODOLOGY...24
3.1 DEFINING A GOOD MEASURE OF ACCESSIBILITY ... 24
3 .2 O V E R V IE W ... 2 6 CHAPTER 4. ANALYSIS OF ACTIVITY-BASED ACCESSIBILITY (ABA)...28
4.1 STUDY AREA AND DATA SETS ... 28
4.2 DISTRIBUTION OF ACTIVITY-BASED ACCESSIBILITY ... 28
4.2.1 The issue of scale and the ABA ... 29
4.2.2 The method for ABA unit translation ... 29
4.2.3 D istrib ution p lots ... 30
4.3 SENSITIVITY TO SOCIOECONOMIC STATUS ... 34
4.3.1 Market segments defined by income... 34
4.3.2 Market segments defined by car ownership ... 35
4.3.3 Market segments defined by employment status... 36
4.4 SENSITIVITY TO LEVEL-OF-SERVICE OF THE TRANSPORTATION SYSTEMS ... 37
4.5 SENSITIVITY TO RESIDENTIAL LOCATIONS ... 40
4.5.1 Sensitivity to residential locations at individual level... 40
4.5.2 Sensitivity to residential locations at market segments level... 46
4 .6 C O N C L U S IO N S ... 5 1 CHAPTER 5. COMPARISON OF ABA WITH TRADITIONAL MEASURES ... 52
5.1 COMPARISON WITH ISOCHRONE MEASURES...52
5.2 COMPARISON WITH GRAVITY-BASED MEASURES ... 53
5.3 COMPARISON WITH SIMPLE UTILITY-BASED MEASURES...56
5.4 CONCLUSION ... ... 59
CHAPTER 6. SUM M ARY AND FUTURE RESEARCH...60
6.1 SUMMARY ...-... ---...----... 60
6.2 FUTURE RESEARCH ...- --... 61
LIST OF FIGURES
Figure 1 Portland Day Activity Schedule model system... 13
Figure 2 Distribution of accessibility in temporal unit... 31
Figure 3 Accessibility values before transforming the units ... 31
Figure 4 Distribution of accessibility in monetary units ... 33
Figure 5 Distributions of accessibility for market segments defined by income levels... 34
Figure 6 Distributions of accessibility for market segments defined by auto ownership ... 35
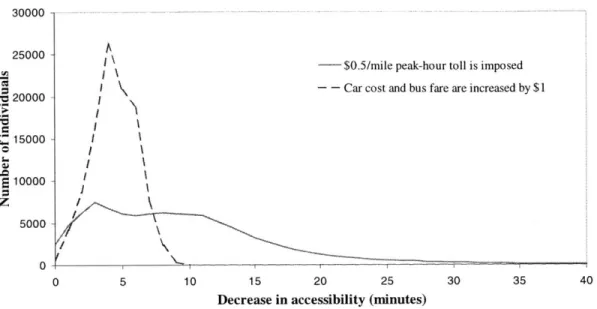
Figure 7 Distributions of accessibility for market segments defined by employment status ... 3 6 Figure 8 Changes in accessibility values as a result of transportation pricing policies ... 38
Figure 9 Accessibility and land use plots ... 42
Figure 10 Accessibility plots as a function of car ownership... 43
Figure 11 Accessibility plots as a function of employment status ... 45
Figure 12 Base cases for short-term and long-term analysis... 46
Figure 13 Average accessibility of the whole population and walk time from home to tran sit ... 4 7 Figure 14 Accessibility plots for market segments defined by income levels ... 48
Figure 15 Accessibility plots for market segments defined by car ownership... 49
Figure 16 Isochrone measures defined by different land use variables... 53
Figure 17 Gravity-based measures for different trip purposes... 55
Figure 18 Utility-based measures of accessibility... 56
LIST OF TABLES
Table 1 Measures of accessibility... 20 Table 2 Characteristics of people with accessibility higher than 3800 minutes... 32 Table 3 Characteristics of people with higher sensitivity as a result of a peak hour toll
Chapter 1.
Introduction and background
1.1 Accessibility
"Accessibility", although a widely used term, in the transportation-planning arena, is an abstract concept. Researchers have defined this term in various ways, and have also constructed numerous mathematical formulations to measure its value. In general,
accessibility is considered essential in evaluating the interrelationships between patterns of land use and the nature of transportation systems. On one hand, the planning of a
transportation system depends on the forecast of land use; on the other hand, the
distribution of the land use is impacted by the transportation system. Thus, the indexes of accessibility that describe the correlation between these two sectors have been used extensively by researchers and policy makers, especially in assessing the existing
transportation system and forecasting the performance of the system. One of the definitions of accessibility is "the ease and convenience of access to spatially distributed opportunities with a choice of travel" (Department of Environment, 1996).
The difficulty is how to quantify accessibility to represent both the pattern of land use and the nature of the transportation system and their interrelationship. Researchers have come up with various ways by using different variables and functions, which results in a variety of accessibility measures.
1.2 Motivation
Since accessibility is a critical indicator of the interrelationship between land use and transportation systems, it has become an essential factor in many transportation planning issues, including:
e Urban development and transportation planning. In earlier urban and transportation
planning practices, improving mobility was considered the primary objective. In order to provide enough mobility for travelers, problems of congestion were addressed by building up more infrastructures. At a time when automobiles were prohibitively expensive to most people, and when the transportation demand was increasing very slowly, these types of methods would work well in reducing traffic congestion. But now, with rapid increases in traffic demand, this method merely results in a higher level of congestion by attracting more traffic to newly improved roads. The decisions derived from these methods turned out to be not efficient, by neglecting the
interrelationship between transportation systems and urban land use. The problematic area in the example must be a place providing more activities than other area. The improvement in the infrastructure would only result in a higher demand from the travelers.
With lessons learned from previous experience and more research on accessibility and travelers' behavior, the goal of urban development and transportation planning has been shifted from focusing on the "vehicular mobility" to the "personal mobility"
(Dalvi, 1978). This improvement results in the change from aiming to reduce traffic congestion to providing higher accessibility (Wilson, 1972). Therefore, more attention has been paid to providing an easily accessible city to decrease traffic congestion. A highly accessible city does not mean a city with higher road occupation rate, but is an area that would provide residents with satisfied convenience to access desired
the distribution of land use. Therefore, solutions aiming at providing higher accessibility may not need any modifications on a transportation system. In some cases, redistribution of the activity opportunities may be more effective in increasing the accessibility (Morris, Dumble and Wigan, 1979).
" Regional economic performance evaluation. In regional economics, accessibility
basically concerns land, labor and capital (Bendavid, 1974). All these are impacted by the transportation system around that area. It was presumed that the investment and construction of a new road would boost the regional economy. However, over time, it has been realized that neither the investment of transportation infrastructure, nor the number of companies, nor the total provision of employment opportunities affects regional economic performance, but their correlation, which is represented by the accessibility values.
" Residential choice modeling. In reality, when people make decisions on where to live, they usually base their considerations on numerous aspects, including (a)
socioeconomic background, such as the work location of the primary members within the household; (b) land use pattern around the area; (c) the crime and education level of the area; and (d) the nature of transportation system that allows them access to their
desired activities. The important role of accessibility in residential choice has been realized in the practice of behavioral modeling (Gunn, 1994).
" Alternate transportation plans evaluation. A good transportation plan is not one that
would provide more mobility to the travelers, but one that could take the residents to their desired activities with an adequate level of convenience and satisfaction. So a very important innovation is to put the transportation system into the context of an existing land use system. Accessibility measure is thus the best choice in evaluating alternate transportation plans. For example, Koenig (1980) utilized the accessibility indicator to assess the net utility of alternative road networks.
accessibility have been brought forward and adopted in the current practice of
transportation planning. Most of these existing measures are based on separate trips, and are called "Trip-Based" measures. In the trip-based measures, the conceptual units of analysis are separate trips. But in reality, people usually make their travel decisions based on their needs to get involved in activities rather than to enjoy a single trip. For this reason, the role of trips is actually to connect the series of activities that the traveler would like to pursue. Consequently, trips are highly correlated with each other. For example, the mode from work to shopping on the way home is highly associated with the mode one chooses when he goes to work. Trip-based models could not describe this type of interactions between sequential trips.
Trip-based models are usually easy to implement in practice, especially at the aggregate level. But they have displayed their weakness in modeling traveler's behavior. At the same time, the studies of existing measures have illustrated that a good measure of accessibility is very important in transportation and land use planning. This research is an attempt to overcome the deficiencies of the existing measures by investigating the properties and performance of a new measure, the Activity-based Accessibility (ABA).
The ABA discussed in this analysis is generated from the Day Activity Schedule (DAS) model system, which is an activity-based model and thus the measure of accessibility
generated from this model is so called "Activity-Based Accessibility". The DAS model explores an innovative way in modeling individual's travel demand. Rather than model independent trips, the DAS models the whole day schedule consisting of multiple activities and trips taken by an individual. This model thus captures people's behaviors and decision-making processes in a more realistic way.
1.3 Research objectives
This research endeavor is primarily aimed at investigating the Activity-Based Accessibility in terms of its properties and performance and demonstrating that the ABA is an
advancement of the state of the art in the research of accessibility measures. This is performed by not only examining the ABA itself, but also by comparing it with the
traditional measures of accessibility.
1.4 Day Activity Schedule model system and Activity-Based
Accessibility
Activity-Based Accessibility is derived from the Day Activity Schedule (DAS) model system. The Day Activity Schedule model is first proposed by Ben-Akiva, Bowman and Gopinath (1996), and it is implemented first with the data from Boston by Bowman (1995) and Ben-Akiva and Bowman (1999). And then the DAS model is implemented in Portland, Oregon by Cambridge Systematics, Inc. et. al. (1997), after which Bowman (1998) refined this model system in his dissertation. This section is based on the description of the DAS presented in Bowman (1998). The DAS model system models people's travel demand in
an innovative way. It regards the activities taken in a whole day context as the basis for modeling people's behavior. This is based on the idea that the physical act of travelling is derived from people's desire to pursue various activities.
The DAS model is based on the concept of an activity pattern, which covers the
interrelationship between the different activities and the trips that link an individual with all these activities. The activity pattern refers to the sequences, the structures and the interactions among all the activities and the tours' taken by an individual during a whole day. It represents the basic decisions of activity participation and priorities, the types of the tours, and the locations each activity occurs, at home or on tour. Each activity pattern is defined by (a) the primary activity of the day, (b) whether the primary activity occurs at home or away from home, (c) the type of tour for the primary activity, including the number, purpose and sequence of activity stops, (d) the number and purpose of secondary tours, and (e) purpose-specific participation in at-home activities.
With the inclusion of the concepts of activity pattern and tour, the activity-based model distinguishes itself significantly from the traditional trip-based models. It actually
formulates an "activity-trip" network within a whole day schedule. Two important features in this network are: first, the "links" are the trips that connect all the activities taken during the whole day, and because of this, the activity-based model covers multiple trips, with multiple modes, destinations and purposes; and second the "nodes" are the activities to associate the sequences of the trips, so this model covers the interrelationships between trips. By formulating this "activity-trip" network, the ABA measure possesses remarkable advancement over the trip-based models, in which only one trip could be covered. To provide an example of the advantages of the activity-based model, take the example of a peak hour toll. In this case, the possible responses may include the changes in destination, timing and mode. In addition, the imposition of the toll may result in activity participation adjustment, changes in the sequences of activities, and tradeoffs between at-home and on-tour activity locations.
1.4.1 The Portland implementation of the DAS
For the analysis presented here, a published implementation of DAS is used. It is the second implementation used by Portland, Oregon to model and forecast people's travel demand over Portland metropolitan area. In this implementation, the DAS model consists of five levels of choices, which are:
>
Day activity pattern models>
Home-based tours time of day models>
Home-based tours mode and destination choice models>
Work-based sub-tours models>
Intermediate stop locations models for car driver toursThe upper level choice conditions the lower level choice, and the lower level choices inform the upper level with the expected maximum utility over the lower level. The top-level model in this structure is the choice of activity patterns. Because the choices over activity patterns are believed to be affected by the expected tours included in the pattern, the utilities of the activity patterns are set to have a component for the expected utility of
its tours. The lower level models describe the choices over the travel patterns, including the travel time, mode and destination, and work based sub-tours, see Figure 1.
Accessibility Activity Pattern Choice Time of Day Destination & ode Choice Work-based btours ntermediate stop locations
Figure 1 Portland Day Activity Schedule model system
1.4.2 The activity-based measure of accessibility
The ABA derived from this activity-based model system is defined as the expected value of the individual's maximum utility among the available activity patterns, given a
residential location. It departs substantially from the existing trip-based measures because their fundamental concepts and the definitions are essentially different. A detailed
comparison between the traditional trip-based measures and the activity-based measures will be represented in later chapters. The key aspects to the ABA measure are:
e It reflects the decision-making process of travel and activity scheduling.
" It captures the chaining of the trips and interactions between different modes, and it also captures multiple purposes and time schedules of activities.
* It is a comprehensive measure, capturing not only the nature of land use and properties of the transportation systems but also the socioeconomic characteristics of the
Whether this complex and comprehensive measure behaves better or not can be only tested from its performance in the practice of transportation planning.
1.5 Outline of the thesis
This thesis starts in chapter 2 by reviewing the literature on the definitions of accessibility and ways of measuring accessibility. In chapter 3, the methodology used in this analysis is introduced. In chapter 4, the analysis of this ABA measure is conducted, which consists of the distribution and sensitivity analysis. At first, the accessibility values for every person in the population are calculated and its distribution over the whole population is examined. And then the sensitivity analysis studies the sensitivity of ABA to three classes of variables, including socioeconomic characteristics, land use patterns and level-of-service of transportation systems. In chapter 5, the ABA is compared with traditional measures of
accessibility. Finally, in chapter 6, the conclusions from this study are presented, and the future research directions are proposed.
Chapter 2.
Literature review
The concept of accessibility has been widely used ever since the 1950s when the gravity theory is rigorously legitimized by Isard at the First Regional Science Meeting in 1954 (Reggiani, 1998). Accessibility is regarded as a fundamental concept in the area of transportation and urban planning. People with different understanding or different
purposes of the term have defined and measured accessibility in various ways. This chapter presents a review of the literature on this topic. It is organized in two parts, in section 2.1, the various areas that people apply the concept of accessibility are presented; and in section 2.2, the three classes of measures to evaluate the accessibility are discussed.
2.1 Applications of accessibility
As mentioned before, there exist numerous ways to define the term of accessibility. This chapter presents the definitions found in the literature according to the objects that
accessibility refers to. Accessibility could be defined as a property of a geographical area, transportation infrastructure, a business or an individual.
2.1.1 Accessibility of a geographical area
The notion of accessibility to a geographical area is essential in urban planning and
regional economic analysis. This type of accessibility could be represented by the land use pattern, the regional economic development, the job opportunities and the access to these opportunities, which are all important considerations in urban planning and economic development strategy.
For example, the early practice of urban planning used to follow the pattern of a distributed urban structure, in which different zones were assigned to provide different services and utilities. The long distance from home to work, and from home to shopping resulted in high demand of traveling, and thus traffic problems, including traffic jams, air pollution, etc. In recent years, it has been realized that a highly accessible city should be in the
pattern that can provide easy access to social and economic opportunities. So the idea of a "compact city" is proposed (Cervero, 1996). The "compact city" is one with various functionalities of the urban area mixed together, so that people can get involved in
different of activities without much demand on auto-transportation. The "compact city" is aimed at providing friendlier environment to pedestrians and discouraging the use of automobiles. The objective is to increase accessibility provided by non-motorized travel. According to the study conducted by Duchateau (1998), people's demand to get to opportunities result in their demand of mobility, but the constraints on the supply of enough mobility combined with the fast increase in the demand result in the traffic problems. So the key point to resolve this problem would be to look at both the mobility and the accessibility.
Another part of the literature on accessibility of locations is focused on the employment access and economic opportunities within an area. According to O'Regan and Quigley (1999), the motivation for the research on this topic was started by the 1965 riots in Los Angeles. Former CIA director McCone concluded that lack of jobs and inadequate transportation to jobs played a large role in creating the unrest in urban areas. The continuing decentralization of jobs to more attention on the accessibility to them by the transportation system. Increasing the accessibility to employment opportunities is given particular consideration in urban and regional planning, which is especially important to those people with low income and low availability of cars.
People with high income and more cars per household generally would prefer to living in a suburban area with better environmental conditions and also tend to prefer commuting by car. But those households with low income and with no car must depend on the public transportation network in the downtown area to get to the activities they would like to enjoy. So the employment accessibility and the transit accessibility are other important
topics in the literature on accessibility and regional economics. As early as in 1972, Wachs and Kumagai (1972) illustrated that accessibility to jobs and urban services is an important factor in evaluating the qualities of urban life. The relationship between job accessibility and transit accessibility is also realized to be an important factor in urban and
transportation planning. This could be shown by two projects. The first study is conducted by Rice Center and VIA Metropolitan Transit in 1983. They performed an analysis to
assess eight alternative downtown transit plans given the projected employment growth. The second one is presented by Zhang, Shen, and Sussman (1999), in which they studied the policy to enhance the job opportunities in order to complement a rail transit investment
in San Juan, Puerto Rico.
2.1.2 Accessibility of transportation infrastructure
The analysis of accessibility of transportation infrastructure is very important in investment assessment, where accessibility is defined as the measure of people's access to economic and social opportunities (Parolin, Nichols, and Mcdougall, 1994). It has been realized that only if the projected infrastructure provides better chances for people to get to the social and economic activity opportunities, would the investment be profitable. Among the early studies, Leonardi (1978) developed a mathematical programming approach to optimize the location of the facility by to maximizing the expected value of accessibility. An example for the recent work is the analysis by Diaz (1999), in which he concludes that the primary positive impact of rail on property values is the impact due to accessibility.
2.1.3 Accessibility of a business
Accessibility is also a critical consideration for a business when deciding where to locate. So the application in this context requires that accessibility reflect the business's attraction to surrounding households and potential customers. A number of ways to account for a business's accessibility have been proposed.
The simplest form is to count the number of households within a certain distance from the shop. It assumes that people will go only to those shops that can be reached within a certain amount of travelling. The longest possible distance from home to shop that people would travel defines a "market area". A precise definition of the market area is very important but difficult. Because, the longest distance that people will travel to go shopping varies according to many different considerations, including the decision-maker, the time
of shopping, the reason for shopping, etc. So, Hodgart (1978) proposes the idea to
distinguish the deterministic market area from the probabilistic market area. Ritsema van Eck and de Jong (1999) realize the accessibility of one shop is also impacted by the accessibility of other shops. So, in their analysis, they calculate the accessibility of shops with consideration of spatial competition between individual shops or between chains of
shops. Another way to measure the accessibility of shops is to calculate the access to the goods and services the shop provides. Guy (1983) developed a measure, called the "shortest distance" measure. It considers only "those types of shop which surveys have shown consistently to be required close to the home by consumers. The measure itself is primarily of accessibility to retail goods and services, rather than to shops."
All these measures consider only separated trips from home to shop, they could not cover the schedule or context of the shopping trips or the shopping trips originated from other locations. The majority of the current literatures on accessibility to shops or business units are lack of explicit behavioral theory.
2.1.4 Accessibility of individuals
Among the existing literature on accessibility, there is also some research analyzing the accessibility at individual and household level. These types of accessibility are based on individual travel behaviors, and define accessibility on a more solid behavioral
consideration. This research was started on the basis established the work of Domencich and McFadden (1975), in which they developed a theory of demand, for populations of individual economic consumers, and Ben-Akiva and Lerman (1977), in which they developed a measure of accessibility based on the application of random utility theory to individuals' decision process; and.
In recent literature, many scholars examine the interrelationship between travel and accessibility, in which they defined accessibility as a measure of "potential for travel". This comes from the notion that people with a higher level of accessibility travel easier and
showing that the demand for traveling is a function of accessibility to opportunities. And Ghosh and McLafferty (1984) concluded from their research "the rate of multipurpose shopping depends on the consumer's location to shopping opportunities". Hanson and Schwab (1987) questioned the conclusion that higher level of accessibility implies higher demand of traveling, and conducted a study at the individual level. From their analysis, they found that:
"High accessibility levels are associated with higher proportions of travel, ... lower levels of automobile use, reduced travel distances for certain discretionary trip purposes, and smaller individual activity spaces. ... Overall, accessibility level has a greater impact on mode use and travel distance than it does on discretionary trip frequency."
This conclusion is very interesting, especially at a time when many researchers have assumed a very strong relationship between trip frequency and accessibility. This
unexpected result from Hanson and Schwab's (1987) work sheds light on the importance of the analysis of accessibility at the individual level, instead of at the zonal or aggregate level.
2.2
Measures of accessibility
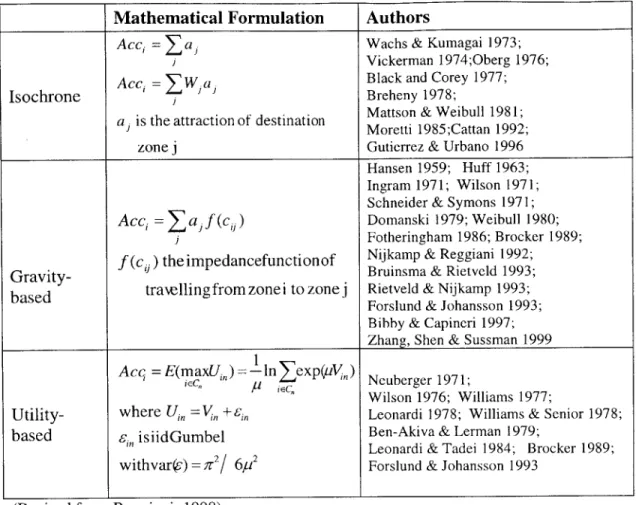
In the current literature, there are numerous ways to measure the values of accessibility, and also many ways to classify these measures. Following Handy and Niemeier (1997), accessibility measures are classified into three categories: the Isochrone measures, the Gravity-based measures and the Utility-Based measures. The classification is summarized in Table 1, and each category is discussed in details in the following sections.
Mathematical Formulation Authors
Acc = a Wachs & Kumagai 1973;
Vickerman 1974;Oberg 1976;
Acc. =W~Ya Black and Corey 1977;
Isochrone Breheny 1978;
a1 is the attraction of destination Mattson & Weibull 1981;
Moretti 1985;Cattan 1992;
zone j Gutierrez & Urbano 1996
Hansen 1959; Huff 1963;
Ingram 1971; Wilson 1971; Schneider & Symons 1971;
Acc = aj f(c 1 ) Domanski 1979; Weibull 1980;
Fotheringham 1986; Brocker 1989;
f(c4 ) the impedancefunctionof Nijkamp & Reggiani 1992;
Gravity- Bruinsma & Rietveld 1993;
based trawlling from zonei to zone j Rietveld & Nijkamp 1993;Forslund & Johansson 1993;
Bibby & Capineri 1997;
Zhang, Shen & Sussman 1999
Acq = E(maxU,,) In exp(y,) Neuberger 1971;
Wilson 1976; Williams 1977;
Utility- where U, = V, +,, Leonardi 1978; Williams & Senior 1978;
based si, isiidGumbel Ben-Akiva & Lerman 1979;
Leonardi & Tadei 1984; Brocker 1989;
withvars)=rc2/ 6p2 Forslund & Johansson 1993
(Revised from Reggiani, 1998)
Table 1 Measures of accessibility
2.2.1 Isochrone measures
Isochrone measures are also referred to as "cumulative opportunity" measures. This type of measure simply counts the number of opportunities that could be reached within a given travel time/cost or distance. This type is the simplest. By defining a range of travel time/cost or distance, they actually define a weight to all possible opportunities. For the opportunities out of this range, the weight is set to zero and those within this range as 1.
Acc, = ZW.a, (2-1)
a1 represents for the opportunities in a zone
j
1 , if ci ; c* c,* is the defined band within which the activity W 0, otherwise. opportunities can be accouted.
An example of this type of measure is the "total number of employment opportunities within 30 minutes walk from transit". From this example, the two most important weaknesses of this measure can be identified. First, how large should the range be? Second, you can choose the total employment, but why not choosing "total retail employment"? The results will be very different depending on the selected range and variable. Because of the lack of determinant ways to define the range or the variables, this type of measures are not ideal in most cases.
2.2.2 Gravity-based measures
Gravity-based measures are so called because they are derived from the denominator in the gravity model for trip distribution. A generic formulation of gravity-based measures to calculate the accessibility of zone i is
Acci af (ci;) (2-2)
Where
j
the possible destination zone from zone iai the activity opportunities in zone
j
f(cij) impedance function of traveling from zone i to zone
j.
In these measures, two components are considered, a accounts for the attraction of zone
j,
andf(cij) represents the impedance induced by traveling from zone i to the possibledestination zone
j.
In most cases,f(cij) includes the travel time/cost in a negativeexponential form. The different formulations off(cij) result in many different measures of gravity-based measures of accessibility.
This type of measure reflects the fact that the farther the opportunity is, the lower the impact of the opportunity on the accessibility values. In this way, the Gravity-based measures represent the interrelationship between transportation system and land use patterns. But these measures neglect the variations across individuals. From the Gravity-based measure, the retired old grandpa has the same value of accessibility as his grandson, who is a college student, just because they live together.
In the definition of this measure, if the impedance functionf(c1) is defined as a step
function, in which the value is 1 within the range defined to count the activity
opportunities and the value is 0 outside this range, then the Gravity-based measure is identical with the Isochrone measure. And thus the Gravity-based measure has the same weakness, which is that the Gravity-Based measures accounts for only one trip, such as the work trip starting from home. This actually constrains the usage of the gravity-based accessibility measures.
2.2.3 Utility-based measures
Utility-based measures are based on the random utility theory, see Domencich and McFadden (1975). It is assumed that people always select the alternative with the highest utility. Due to the various impacts from considerations that are hidden or difficult to capture, the utility is not known with certainty to the analyst, and therefore is treated as a random variable. The utility of an alternative is composed of two components. The first is called systematic utility, which is make up of the properties of the alternative and the
characteristics of the decision maker that are assumed to impact the decision. The other component is called the disturbances, representing the randomness of the utilities. In order to obtain a tractable form, the disturbances are assumed to be identically and independently Gumbel distributed with a scale parameter p. Under this assumption, the expected
E(max Ui,) = In
Y
exp(pVi,) (2-3)1EC, ,L
ieC,
where, Vi, is the systematic component of the utility for individual n choosing alternative i;
The expected maximum utility is defined as the accessibility of individual n over a choice situation, such as a destination choice, to represent an individual's perception of the interrelationships between land use patterns and transportation systems that he faces. One of the major advantages of the utility-based measures is that they can be defined at the individual level, and therefore can reflect the sensitivity of the choice decision to people's socioeconomic characteristics. This type of measure is the most advanced one among the existing measures.
Among the traditional measures, all of them are trip-based measures, in which people's accessibility values are calculated based on their choices over separate trips. So a trip-based measure can cover only one trip, with one purpose, one mode and one destination. It neglects the chaining of the trips and the time schedule for the trips. The ABA studied in this thesis is based on all the activities and trips taken during a whole day. Therefore, the ABA can cover multiple purposes, multiple modes and destinations, and also the
sequences of the trips and the time schedule of the activities. The detailed comparison between the ABA and the traditional measures will be conducted in chapter 6.
Chapter 3.
Methodology
In this chapter, before conducting the analysis, the features that a desired accessibility should possess is proposed, and then the methodology and study structure starting from next chapter are presented.
3.1 Defining a good measure of accessibility
Accessibility is an abstract concept. It considers both the transportation system and the land use pattern, which could be presented by many different variables. It is thus almost impossible to set up a definite mathematical rule on how to measure accessibility. From the review of the literature, there exist a myriad of ways to calculate the values of accessibility. Each of them has some advantages and disadvantages. In most cases, it is not obvious
which measures are better than the others. It is possible to define what a good measure of accessibility would be like according to the reason that it is used. The points listed following are from the general point of view. In most cases where accessibility takes the key role in analysis, a good measure of accessibility should possess the following
properties:
e Behaviorally strong. This is among the lower level requirement, but in most cases, it is not easy to be satisfied. In both transportation and urban planning, modeling and representation of people's behavior are always an essential but challenging issue. A good measure of accessibility needs to have a very strong behavioral explanation and can reflect people's choice behavior logically and correctly.
" Reasonably flexible. A good measure of accessibility should be applicable to various purposes of application. It is more convenient and desirable to have a measure that could be used in different contexts, at least to some extent. For example, in a same area, two policies are in discussion, one is whether or not to build a new bus line; the other is whether a toll should be imposed. If there exists a measure applicable to both
of these two cases, what is needed is only to compare the changes in the values of accessibility caused by each of these two scenarios. By combining this with some social impact considerations, the officials can make the decision on which way to choose. This will reduce most of the work resulted in situations when different measures have to be explored, and different data sets have to be collected.
* Adequate sensitivity. Accessibility is a key index in capturing the interrelationship
between land use and transportation systems, and thus a good measure of accessibility should posses enough sensitivity to the changes in either the property of land use or the level of service of the transportation system. More importantly, it should reflect the changes in the interrelationship between land use pattern and transportation system.
* Satisfactorily comprehensive. As accessibility is also a very important input in
residential choice modeling, it should be inclusive enough to reflect the consideration that people have when choosing where to live. By consulting an individual's behavior, it shows that multifold factors impact his/her choice of dwelling locations. The
considerations generally include the pattern of land use around the prospective living place. This reflects the activity opportunities, such as shopping stores; and the way to get to these activities, that could be described by the nature of the transportation network within reach. It also should cover the perception differences in accessibility for people with different socioeconomic backgrounds. Furthermore, as the residential location choice is a long-term decision, an accessibility measure reflecting the longer-term behavior would be preferred.
* Comparable across individuals. Accessibility is desired as a property of a person when
living in a given location. If an individual can receive a higher value of accessibility in one place, it indicates that he will prefer to live there. If one individual has a higher value of accessibility than another person does when living in a same place, it suggests that the first person have a better chance to reach activity opportunities and live a better life than the other one. So, accessibility should be comparable not only across
* Computationally efficient. A good measure of accessibility should be efficient and simple in terms of calculations. And also, it should be easy to handle. A too
complicated measure may possess very nice properties theoretically, but may lack of practical usage.
The items listed above are needed for a measure to be regarded as a good measure of accessibility. Some of the requirements might be in conflict with each other, such as the item of "comprehensive" and "simple". This makes the work to find a good measure of
accessibility much more complicated than expected. On the other hand, in a different context, the requirements would be slightly different. However, in any case, the measure should have the potentiality to explain people's behavior in a desired and logical way, and to perform well in playing its role in transportation and urban planning. None of the traditional measures could achieve all of these requirements. The activity-based
accessibility examined in this analysis satisfies many of the requirements stated above by possessing a number of favorable properties, but it is computationally more complex than the traditional measures. This indicates that the study of a good measure of accessibility still needs a lot of work. This will be made clearer in the later analysis of the ABA and from the comparison between the ABA and the traditional trip-based measures.
3.2 Overview
This chapter presents the framework that is employed to examine the properties and performance of the ABA. Two main pieces of study are presented:
* Analyze the ABA measure. With the Portland data and a computer-based micro
simulation of the DAS model, the study includes the distribution analysis and
sensitivity analysis of the ABA measure. In the distribution analysis, the scale issue of this measure and the difficulty to solve it is discovered, which is resulted from the complex structure of the DAS model. In order to make the ABA comparable across individuals, a simplified method is employed and the distribution of the ABA is thus
analyzed. In the sensitivity analysis, the sensitivities of the ABA to its three important components are examined, including the socioeconomic variables, level-of-service in transportation systems, and the land use patterns both in long-term and short-term behaviors. All these analysis is presented in chapter 4.
Compare the ABA with the traditional measures: In this analysis, the traditional
measures of accessibility are grouped according to two ways, first, based on the formulations of the measures, they are classified as isochrone, gravity-based and
simple utility-based measures. The ABA is also a utility-based measure but is different from those traditional utility-based measures, in their basis for modeling. The ABA is based on the activities and trips taken by an individual throughout 24 hours, however, the simple utility-based measures are based on separate trips. In fact, all the traditional measures are based on single trips, and the simple utility-based measure is the most advanced measure among all these traditional measures, so the comparison between the simple utility-based measure and the ABA stands for the comparison between the trip-based measures and the activity-trip-based measures. This analysis is conducted in chapter 5.
Before starting the analysis of the ABA from the next chapter, following is the properties that a good measure of accessibility are desired to have. The later analysis will show that the ABA measure satisfies most of these attributes.
Chapter 4.
Analysis of Activity-Based Accessibility (ABA)
In this chapter, the properties and performance of ABA are examined both theoretically and empirically. First, the study area and data sets are introduced. Next, the analysis is conducted by examining the distribution of ABA across the population, and its sensitivity to each of the three types of components, which are socioeconomic characteristics, land use patterns and level-of-service of transportation systems. At last, the conclusions derived from the analysis in this chapter are presented.4.1 Study area and data sets
All analysis presented in this chapter is performed using the Portland, Oregon data sets and the Portaland implementation of the DAS model system, as described in section 1.4.1. In
this research, the Portland, Oregon metropolitan area is the geographic region of primary focus. The data used for this study is based on the synthetic population that Portland's Metropolitan Planning Organization (MPO) uses for their planning purposes. The statistics are based on a 10% sample rate of this population. The sampled population consists of 55,000 households, with 105,506 individuals aged over 16 years old. Those younger than
16 are assumed to have constraints on making their own travel decisions and are therefore not considered in this analysis.
4.2 Distribution of Activity-Based Accessibility
The objective of this section is to examine how accessibility is distributed across the population. The accessibility values are calculated by implementing the ABA measure with Portland data, including information about land use patterns, transportation system
and demographics for each individual. A prerequisite for the distribution analysis is that the values of accessibility be comparable across individuals. Due to scaling issues of the DAS model system, the ABA is not directly comparable across individuals. Before a
comparison is made, it is necessary to convert the ABA to a scale that is consistent across individuals. This conversion is described next.
4.2.1 The issue of scale and the ABA
Activity-Based Accessibility belongs to the utility-based measures of accessibility, where accessibility is defined as the expected maximum utility over a choice situation faced by an individual (Ben-Akiva and Lerman, 1985), and it is formulated as
Acc* = E(max U,) = -ln Yexp(pV). (4-1)
ieC" p iC
Where: Uin =V + C,, , i e C, , C, is the choice set for individual n, i indicates an
alternative within this individual's choice set.
Vin =
p*'X,
, Xi is a vector of variables included to explain the utility ofalternative i to individual n, and
p*
is a vector of parameters;var(ein) = ' 2 2 'Ei is assumed to be iid Gumbelly distributed.
The formulation in equation 4-1 demonstrates that p defines the scale of the utility and its expected maximum value. For multinomial logit model, it is well known that the p is not identified, and must be normalized (usually to 1). In a nested logit (NL) model, there are multiple scales (one for each nest), and it also requires normalization for identification. The DAS model consists of a complicated system of nested logit equations, in which
multiple scales were normalized in the estimation process. The impact that the
normaliazations have on accessibility is that the scale is not consistent across individuals. Therefore, in order to make comparison and conduct the distribution analysis, the ABA must first be translated to a consistent scale.
4.2.2 The method for ABA unit translation
A standard method of dealing with the inconsistent scale issue is to translate the logsum to a common set of units, such as time or cost. In order to translate the unit of accessibility, the ideal situation is that either time or cost enters the utility linearly and as a generic
variable. Under this condition, the logsum can be translated to minutes or dollars by
dividing it with the marginal utility of travel time or travel cost: Acc"
Unfortunately, the DAS model, (the source of the ABA measure) does not satisfy this ideal condition. First, neither travel time nor travel cost is treated as a generic variable, it varies according to modes and income level. Second, they enter the DAS model as a combination of linear, quadratic and cubic formulations of "generalized time".
Therefore, there is no clear analytical marginal utility to use for the conversion. Instead, a numerical derivative is used and the accessibility in temporal and monetary units are formulated as:
Acc' = Acc and Acc" Acc (4-2)
AAcc " AAcc1
ATT ATC
First, the numerical derivative of the accessibility value to travel time or travel cost is calculated to approximate the sensitivity of accessibility to travel time or cost. Then the original accessibility value is divided by the sensitivity to obtain its value in temporal or monetary unit.
The specification of the DAS is such that travel time enters each mode's utility. However, travel cost is not considered in the walk and bicycle. From this point of view, the time
variable is preferred. Therefore, the majority of this analysis focuses on temporal units. The monetary accessibility is briefly examined for comparison.
4.2.3 Distribution plots
4.2.3.1 Temporal units
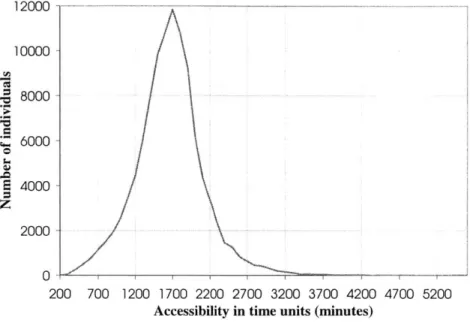
The methodology presented above is implemented and the distribution of the consistently scaled accessibility is shown in Figure 2. In this calculation, travel time of every possible trip is increased by one minute, the resulted decrease in accessibility value is thus
approximated as the accessibility value. 12000 10000 8000 2 6000 4000 2000
numerical derivative, and this is used to divide the original
0
4-200 700 1200 1700 2200 2700 3200 3700 4200 4700 5200
Accessibility in time units (minutes)
Figure 2 Distribution of accessibility in temporal unit
The distribution is normally distributed, which is not surprising. For comparison, the distribution using the pre-scaled accessibility values is shown in Figure 3, where a bi-modal distribution is presented. The two modes in the bi-model distribution are formulated by employed people and unemployed people. However, the normal distribution shown in Figure 2 indicates this is actually resulted from the scale issue.
14000 r - - -- -.-.-12000 -10000 -8000 -6000 2000-0 / 1 1' 1 1.5 2 2.5 3 3.5 4 4.5 5 5.5 Accessibility values
Figure 3 Accessibility values before transforming the units
It must be noted that the minutes shown in Figure 2 really do not mean anything related with time. According to the random utility theory, the utility is ordinal, instead of cardinal. So the values are only meaningful during comparison, but meaningless when considered
separately.
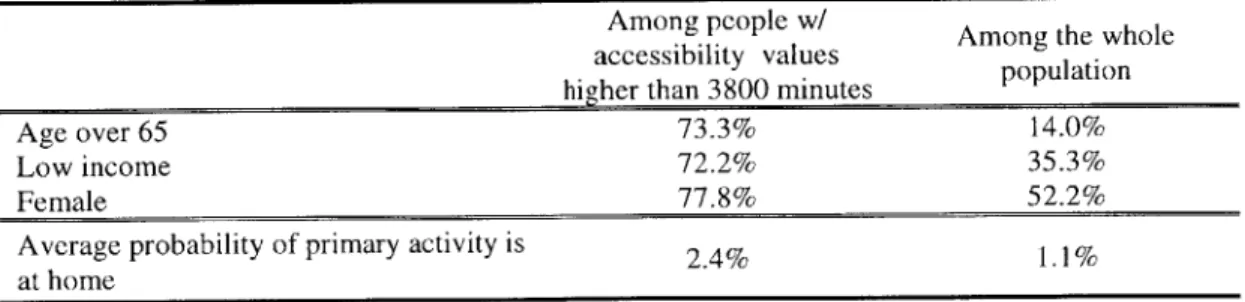
The values of the accessibility in temporal units, it is found that they are ranged from 278 minutes to 5531 minutes. Most people have an accessibility under 3800 minutes, only 90 out of the 105,506 persons have values over 3800 minutes. The analysis above has shown that the temporal values of accessibility formulate a very nice normal distribution, with mean 1658 minutes and a standard deviation of 445 minutes. Why, then, do these 90 persons have much higher accessibility values? Examination of these 90 individuals shows that they have higher percentages of elderly, low-income people and females than in the entire population, as shown in Table 2. Furthermore, they have among the highest probabilities of staying at home for most of the day. Because they take fewer trips than others, the one-minute change in travel time of each trip thus has less impact on their
accessibility values. This means that the numerical derivative of their accessibility with respect to travel time is much lower than others, and therefore their calculated temporal accessibility values are much higher. And in the subsequent analysis, only people with accessibility values lower than 3800 minutes are considered.
Among people w/ Among the whole
accessibility values population
higher than 3800 minutes
Age over 65 73.3% 14.0%
Low income 72.2% 35.3%
Female 77.8% 52.2%
Average probability of primary activity is 2.4% 1.1%
at home
Table 2 Characteristics of people with accessibility higher than 3800 minutes
This section transforms the accessibility values into temporal units. Another common approach is to translate the units into monetary unit, which is conducted in the next section.
4.2.3.2 Accessibility in monetary units
It is often desirable to translate to monetary units so that individual's "willingness to pay" for a particular change to the transportation system can be calculated.
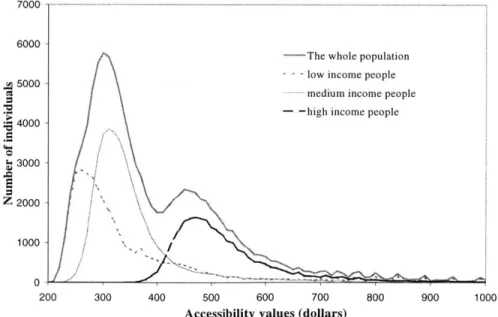
The distribution of the monetary accessibility is shown in Figure 4, which looks quite different from the distribution in temporal unit. In monetary units, the distribution of
accessibility is a bimodal distribution, with two peaks occurring at $300 and $450 respectively. To investigate the source of the segmentation, the distributions of
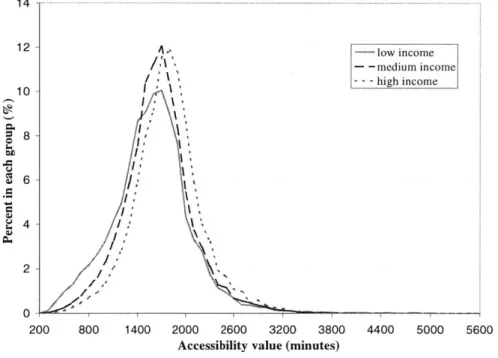
accessibility for three income levels are drawn in the same figure. It shows that the higher mode is formulated primarily by high-income people, and the lower mode is formulated by low and medium income people.
The weakness of the method to transform to monetary unit results from the nature of the DAS model system. Because in the utility functions for walk and bicycling, no travel cost variable is included, which means that the changes in travel cost would not affect the utility of these two modes at all. However, while the travel cost is changed, it does result in
a different utility for other modes, and thus a different accessibility value. The ideal situation for employing this simple method, as stated in section 4.2.2, requires that travel time/cost be a generic variable. The travel cost variable seems further away from this requirement than travel time variable, so the transformation into temporal unit is preferred,
and the subsequent analysis is based on the temporal utility values.
7000 - -- - - - ~ - -
-6000
-The whole population
-5 -low income people
medium income people - -high income people 4000
-3000
2000-00
0
200 300 400 500 600 700 800 900 1000
Accessibility values (dollars)
4.3 Sensitivity to socioeconomic status
This section studies the sensitivity of this measure of accessibility to social and economic variables by examining the difference in the distributions of accessibility for different market segments. In each subsection, market segments are defined by one variable, the distributions of accessibility for each market segment are plotted and compared.
4.3.1 Market segments defined by income
In this section, the population is segmented by household income level. People with household income less than $30K are defined as Low-income people; between $30K and $60K are Medium-income; and over $60k are High-income class.
800 1400 2000 2600 3200 3800 Accessibility value (minutes)
low income -medium income
-high income
4400 5000 5600
Figure 5 Distributions of accessibility for market segments defined by income levels
The distributions of accessibility over each of these three market segments are shown together in Figure 5. The Y-axis shows the percentage of people within each segment with the corresponding accessibility values. It shows that the income levels have only slight impact on people's accessibility. People with high income have slightly higher
accessibility values, and people with lower income have slightly lower accessibility values.
14 12 10 8-2 0 200
-Note that this is very different from the impact of income levels on the monetary
accessibility #. So the method of translation could have important consequences when the logusm is used for analysis. This warrants further investigation, and is an important area of future research.
4.3.2 Market segments defined by car ownership
In this section, the population is grouped into two market segments, "people without cars" and "people with cars". For households with no cars, they do not have the choice of "driving by car" when they want to access some activities. Therefore, they have a smaller set of alternatives for mode choices.
14 12-=10 - 0-200 800 Figure 6 Distributions of
- People without car
- -People with cars
F'
/
"
I
1
1400 2000 2600 3200 3800 4400 5000 5600
Accessibility value (minute)
accessibility for market segments defined by auto ownership
The distribution of accessibility for two segments are shown together in Figure 6. This figure shows that people without cars have lower accessibility values than those with cars, which is expected.
However, some households without cars still have a very high accessibility. An
2000 minutes2, it shows that most of them live in the zones with good services of transit. Even though they don't own a car, they can take the advantage of the transit service to access activities.
4.3.3 Market segments defined by employment status
This analysis is focused on comparing the accessibility values of employed versus
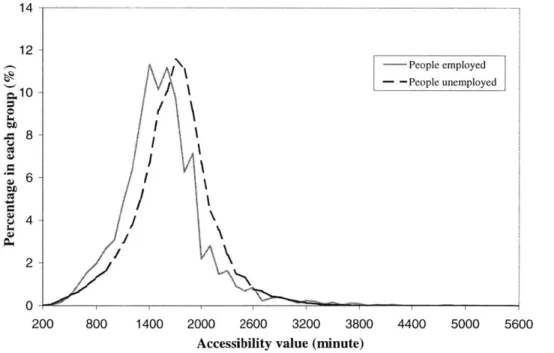
unemployed people. Similar to the previous discussion, the distributions of accessibility for these two groups are displayed in Figure 7, which implies that unemployed people have slightly lower accessibility than those who are employed. The difference between these two distributions is not very significant, because people's accessibility values are impacted
by a lot of factors, such as income, gender. However, the slight difference reflects that the
employment status is one of the impacts on people's accessibility, and employed status is favorable in terms of obtaining higher accessibility.
14 12 10 8 6 2 - People employed - -People unemployed A 800 1400 2000 2600 3200 3800
Accessibility value (minute)
4400 5000 5600
Figure 7 Distributions of accessibility for market segments defined by employment status
2 For reasons discussed in section 4.2.3, individuals with accessibility over 3800 minutes were
removed from the analysis. 0 49