Analysis and Productivity Improvement of an Automated Material Handling System through Simulation
By Willow Primack
B.S. Mechanical Engineering, United States Military Academy, 2008
Submitted to the MIT Sloan School of Management and the Mechanical Engineering Department in Partial Fulfillment of the Requirements for the Degrees of
Master of Business Administration and Master of Science in Mechanical Engineering
In Conjunction with the Leaders for Global Operations Program at the Massachusetts Institute of Technology
June 2015
I
2015 Willow Primack. All rights reserved.
F- U) 0 LX CO CL
c
00c
-, L < -U) I-The author hereby grants to MIT permission to reproduce and to distribute publicly paper and electronic copies of this thesis document in whole or in part in any medium now known or
hereafter created. Signature of Certified by Certified by Accepted by Accepted by
Author
Signature redacted
MIT Department of Mechanical Engineering, MIT Sloan School of Management /_
)
May 8, 2015:-Signature
redacted
---Bti~a nthony, Thesis Supervisor Director, Master of Engineering in Manufacturing Program Principal Research Scientist, Department of Mechanical Engineering
__________Signature redacted
ZeyiAep Toi, Thesis supervisor Adjunct AssoQ&ti Professorf.QW ratiosAanagement
____________
Signature redacted
David E. Hardt, Chair, Mechanical f g Pi6f1g Committee on Graduate Students Ralph E. and Eloise F. Cross Professor of Mechagical Engineering
____________Signature redacted
Iv1'aira Herson, MBA Program Di-rector MIT Sloan School of Management
Analysis and Productivity Improvement of an Automated Material Handling
System through Simulation
By Willow Primack
Submitted the MIT Sloan School of Management on May 8, 2015 in Partial Fulfillment of the requirements for the Degrees of Master of Business Administration and Master of Science in Mechanical Engineering Abstract
As Amazon.com has grown, the company has invested in warehouse systems similar to those
traditionally found in manufacturing. These systems are a complex and interconnected set of manned work processing stations linked together by conveyance. This thesis examines one such
system, arranged as a set of parallel single piece workflow lines joined by a central computerized
sorter that route work between lines, and examines the effect of sorter algorithms and line
capacity on production output. Work studies, interviews, and a practical experiment suggest a
deterioration in the feedback provided to the central sorter for work routing.
A Monte Carlo simulation model of the system further supports this hypothesis, suggesting that system throughput is 11.7% lower than a system that perfectly routes work to line in a pull fashion. While perfect routing is not practically feasible, the thesis then explores two routing heuristics designed around starvation response and dynamic capacity analysis, which simulation suggest may yield a 6.73% increase in throughput. In doing so, the thesis provides a case study on process improvement using simulation to characterize a complicated mechanical production system that is otherwise analytically intractable.
Thesis Supervisor: Brian Anthony
Title: Director, Master of Engineering in Manufacturing Program and Principal Research Scientist, Department of Mechanical Engineering, Massachusetts Institute of Technology
Thesis Supervisor: Zeynep Ton
Title: Adjunct Associate Professor of Operations Management, Massachusetts Institute of Technology
Acknowledgements
This thesis was made possible with the support of the Amazon.com team at the ONT2 fulfillment center. Jacqueline Underberg, Scott Anderson, and Stephanie Collett provided invaluable
management guidance and insight. The managers, process assistants, and associates in every department helped contribute to my understanding of Amazon.com's systems, generate ideas for projects, and run experiments with different hacked-together tools. I could not have asked for a better learning environment for my internship.
I would also like to thank my thesis advisors, Brian Anthony and Zeynep Ton, for helping me understand how to approach the problems addressed in this thesis and for refining my ideas. I am particularly grateful for Zeynep's book, "The Good Jobs Strategy," which has influenced my thinking about human capital and sustainable business. This book is available on Amazon Prime as of the time I'm finishing this thesis.
My classmates in the Leaders for Global Operations program have shown me powerful friendship and support in the last two years. My fellow interns Maxine Yang, Ploy, Nahathai
Srivali, and Steven Fuller were the best possible friends to have with me in SoCal.
This thesis is dedicated to my wonderful parents, Margaret and Richard, and to my awesome brothers, Daniel and Jasper.
Table of Contents
Abstract
Acknowledgements
Table of Contents
List of Figures
1 Introduction
1.1 Amazon.com Background
1.2Problem Statement
1.3Methodology
2 System Overview
2.1 System Description
2.2Sorter Algorithm for New Batches
3 Analysis
3.1 Background on Queuing
3.2Effects of Sorter Logic and Hypothesis
3.3Practical Experiment
3.4Work Studies and Interviews
3.5Processing Time Data Analysis
3.6Analysis Conclusion
4 Simulation and Results
4.1 Overview of Simulation Methods
4.2Monte Carlo Simulation Model
4.3Discussion of Results
5 Management Considerations
5. 1Amazon.com Fulfillment Center Culture and Challenges
5.2Potential Improvements
6 Conclusion
6.1 Summary
Table of Figures
Figure 1-1: Amazon.com annual net sales.
Figure 2-1: Conveyance, trays, and items in an automated material handling system. Figure 2-2: 2-Line automated material handling system linkages.
Figure 2-3: 2-line system buffers and potential starvation, blockage, and recirculation. Figure 2-4: 5-line automated material handling system linkages.
Figure 2-5: Recirculation loop behavior.
Figure 3-1: Markov states and transitions of an M/M/l system with capacity k=4.
Figure 3-2: Plots of empty and full steady-state probabilities as a function of utilization ratio for a M/M/l k=21 system.
Figure 3-3: Plot of average queue length as a function of utilization ratio in a M/M/l system with infinite capacity.
Figure 3-4: Distribution of average production rates of induct and processing associates by line over the course of a week, 266 observations.
Figure 3-5: Hypothetical collapse of work arrival and line output.
Figure 3-6: Observations from practical experiment in bottleneck adjustment.
Figure 3-7: Time study results of hour-long observations of an induction and processing station. Figure 3-8: Sample and model CDF of times between completed inductions.
Figure 3-9: Sample and model CDF of times between completed processing.
Figure 4-1: Average simulated productivity declines towards steady state; average outputs of 40 simulation runs in 30 minute increments.
Figure 4-2: Simulated output by line as a function capacity using sorter logic; from 60 simulation runs with 20 lines each.
Figure 4-3: Simulated output by line as a function capacity using pull benchmark; from 60 simulation runs with 20 lines each.
Figure 4-4: Simulated starvation by line as a function capacity using sorter logic; from 60 simulation runs with 20 lines each.
Figure 4-5: Sensitivity of model to variation in line capacity.
Figure 4-7: Combined heuristics: line output as a function of capacity. Figure 4-8: Combined heuristics: starvation levels as a function of capacity. Figure 4-9: Sensitivity of heuristic-modified model to variation in line capacity.
Figure 5-1: Amazon "Box Man" figure holds a poster quoting Amazon.Com founder Jeff Bezos on the integral importance of putting customers first.
Chapter 1 - Introduction to Amazon.com and Automated Materiel Handling Systems
1.1 Amazon.com Background
Since its 1994 inception as an online bookstore, Amazon.com has undergone dramatic expansion and growth into a leading retailer for online commerce. Throughout this period of growth, the company has held convenience, reliability, and customer experience as core priorities. Over the past nine years, the company has particularly emphasized and expanded its "Amazon Prime"
customer subscription program, offering customers free two day shipping on orders. This service has increased individual customer consumption and expectations. As stated in the company's
2013 Annual Report, "Customers love Prime... On a per customer basis, Prime members are ordering more items, across more categories, than ever before" [1].
With the growth of revenue, delivery requirements, and the breadth of inventory, the company has expanded and differentiated its fulfillment center network. This growth in operations
presents a significant management challenge: "As we continue to add fulfillment and warehouse capability or add new businesses with different fulfillment requirements, our fulfillment network becomes increasingly complex and operating it becomes more challenging" [1]. The company has invested in more than 50 new warehouses since 2010, with a particular eye towards
shortening delivery times by locating warehouses near metropolitan centers [2]. A typical large Amazon.com warehouse may have a floor space of 1.0-1.2 million square feet and employ between 1,000 to 1,500 employees [3]. The company is also expanding outbound capability through the development of a network for postal injection and a special USPS contract for Sunday deliveries [3]. This expansion has helped meet the demands of the company's continuous and dramatic annual growth in net sales, as shown in Figure 1-1.
Amazon Net Sales (Millions of Dollars), 2004-2013 $74,452.00 $61,093.00 $48,077.00 $34,204.00 $24,509.00 $19,166.00 $14,835.00 $10,711.00 $6,921.00 $8,390.00 2004 2005 2006 2007 2008 2009 2010 2011 2012 2013
Figure 1-1: Amazon.com annual net sales [1].
With the increasing scale and growth of warehouse operations the company has looked to new systems and technology for inventory handling and storage. The most dramatic of these
investments has been the acquisition of Kiva Systems, a maker of robotic inventory systems [4]. Amazon has also invested internally in the development of automated materiel handling systems [2]. These systems are comprised of a series of conveyance and scanners that route items to manned workstations for processing. This paper focuses on the in-depth analysis of the software logic, metrics, and efficiencies of a particular automated materiel handling system, developing methods to characterize losses, build better controls, and achieve greater worker job satisfaction.
1.2 Problem Statement
Automated material handling systems are flow systems with multiple manned stations linked together by conveyance and limited buffer space. Amazon systems often rely on adjustable capacity in order to meet spikes in demand [5]. A workstation may at different times be manned by multiple associates, or given partial attention by a single associate. These spikes in demand are associated not only with a daily ordering and shipping cycle [5], but also significant
seasonality. In 2014, Amazon.com hired 80,000 temporary associates for fulfillment center operations [6], expanding the available labor pool by more than a third. Many operational parameters of automated material handling systems are often unknown, given the complexity of
interconnection within the system, particularly how achieved throughput compares to a theoretical optimum, which may not be derivable from observed parameters. Computerized
algorithms for sorting work interact with the physical flow of material. This thesis forms an inquiry into how well existing system software performs to avoid workflow problems, an analysis of how this performance compares to a theoretical optimum, and development of heuristics to correct workflow problems.
Starvation and blockage of workstations is a particular concern for efficient operation of the system. Starvation is defined as a period in which a workstation does not have the materiel inputs needed to do work; blockage is defined as a period in which a workstation cannot send an item to the next station because the buffer between stations is full. Automated material handling systems often utilize single piece workflow, in which workstations process one item at a time instead of batches of similar items. Single piece workflow provides a quality advantage over batching methods, measured in this case by first-time-correct item placement into inventory or into a customer order. Single piece workflow also allows for problem identification and response by
managers, an important capability for system improvement [7]. Buffer space is at a premium within these systems, as the physical space occupied by conveyance competes with valuable inventory for floor space. Given these factors, starvation and blockage of workstations has the very real ability to inhibit productivity. While starvation and blockage mechanics can sometimes be derived analytically through queuing theory, certain problems are analytically intractable due to system complexity or the presence of non-Markovian arrival times and processing
distributions. As this is the case for the studied system, this thesis will turn to simulation of queue state transitions to characterize losses from starvation and blockage.
Starvation and blockage also has the potential to frustrate workers and reduce job satisfaction. Amazon workers are evaluated by the quality and quantity of the work they produce. Starvation and blockage problems present impediments to worker productivity that workers may perceive to be out of their individual control. This paper will address psychological factors of satisfaction within these factory-like automated material handling systems in the context of traditional Amazon culture, and recommend adjustments based on mechanical evaluation of these systems.
1.3 Methodology
In order to explore the issues raised in the problem statement, this paper will first provide an analysis of the system, comprised of four parts:
1. An overview of the system's physical connections and characterize the distribution of work processing rates.
2. And assessment of worker time studies in order to obtain a sense of the occurrence of starvation and blockage.
3. An examination of the software logic of the system, delving into the mechanics of how it routes materiel and whether it operates as a pull or push process and under which conditions. 4. A Monte Carlo random variable simulation modelling system behavior to characterize
theoretical efficiency compared to ideal productivity.
The paper will next examine the effect of these losses on worker morale and the management challenges that may arise. The paper will then make recommendations for new metrics and software logic to reduce the effects and occurrence of starvation and blockage within the
automated materiel handling system, and simulate the expected outcomes of implementing these heuristics. In doing so, this paper serves as a research case study in the applied analysis and improvement of complex mechanical systems that integrate automation with human labor.
Chapter 2 -System Overview
2.1 System Description
The automated material handling system studied for this paper is located in a large fulfillment center in Southern California. Similar systems are in use throughout the Amazon.com fulfillment center network, with variations adapted to different types of items and processes. The system receives items, scans them into a computer system, processes the items, and consolidates the items into batches for further processing. Throughout the flow of items through the system, items are examined for damage and matched to a computer database for inventory verification. The single piece workflow of the system is critical to reduction of defects. The conveyance of the system brings items to workers, allowing workers to perform their receiving and processing tasks from one location.
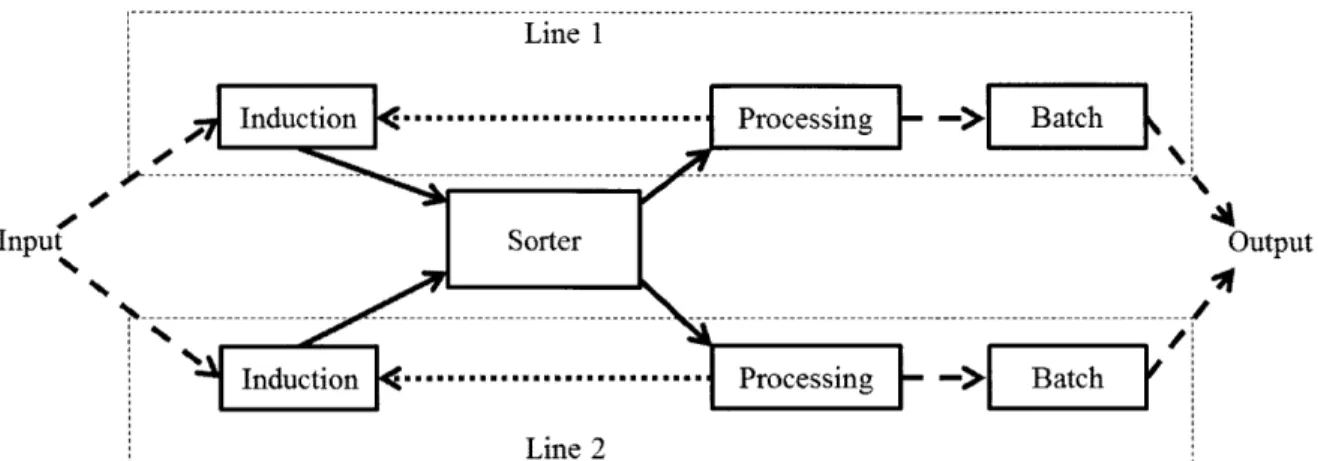
Items arrive at the system entrance and are stored in a large communal buffer. These items are received into the system at manned workstations (induction stations) and placed on orange trays, shown in Figure 2-1, to be transported through the system conveyance. Items are routed to a central sorter, which sends items to individual manned processing stations. Multiple batches at once can be assigned to each processing station. If an item is part of an existing batch, it is directed to the processing station that holds the batch (processing stations). If the item is the first of a new batch, the sorter uses an algorithm to decide which processing station to make an assignment to (see Section 2.2 for details).
At the processing stations, items are removed from the conveyance trays and placed by batch in a large buffer for further processing at downstream stations (batch stations). Each processing station is linked to one or more batch stations that serve the processing station exclusively. The orange conveyance trays, now empty from the processing station, are recirculated to the
induction stations. Each processing station is exclusively linked to a single induction station, with the processing to induction link referred to as a line. These linkages are shown in Figure 2-2 for a system with two lines (2-line).
The actual work done at stations will vary between system based on the overarching design and purpose. In the system studied for this paper, workers at induction stations pick items out of crates, scan the items, place the items in orange conveyance trays, then trigger motors to send the
orange tray and contained item to the sorter. Associates at processing stations pick items out of orange trays and place them into physical lots selected by the computer system.
Line 1
Induction ---... Processing Batch
Input Sorter Output
Induction ---... Processing -> Batch Line 2
- - - - >Flow of Items
Key ...---- >Flow of Empty Trays -FFlow of Items in Trays
Figure 2-2: 2-Line automated material handling system linkages.
The buffers leading into processing stations are very short, as are the buffers for empty trays between processing and induction stations. This thesis will assume that these buffers can store 20 full and empty trays respectively, although this quantity varies by system configuration. An induction station is starved if either items or empty trays are not available in its two input
buffers. A processing station is starved if full trays are not available in its sole input buffer and is
blocked if the empty tray buffer leading to the paired induction station is full of empty trays. If a
station is full or blocked, it temporarily halts work. For the purposes of this paper, the sorter is assumed to have an infinite processing rate, such that induction stations are never blocked. The potential location of starvation and blockage in a 2-line system is shown in Figure 2-3.
Processing to Processing to
Induction Input Induction BuJfer Batch Buffer
Buffer (Small -20 (Large - 200
(Tety Large) Rays) Items)
Induction --- Processing Batch
Processing Input Buffer \
Input Sorter (Small - 20 Tays) Output
If buffer emptv, if
Processing is starved /
Induction .--.--.--.- - -- -Processing > Batch
If buffer
emptY, If bqjffr If buJf]r
Induction is emptv, Aull
starved Induction is Processing
starved is blocked
IfProcessing Input Buffer is full, trays and items designatedfor the processing station recirculate through the sorter system without being
reassigned
Figure 2-3: 2-line system buffers and potential starvation, blockage, and recirculation.
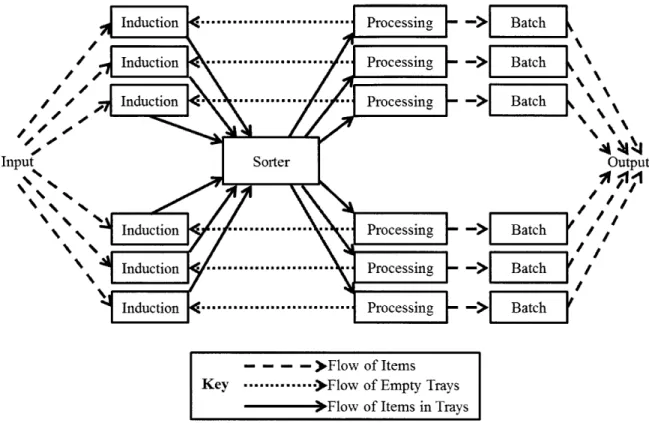
While the flow of items and trays through the system is most easily visualized through the 2-Line
diagram above, the system can contain many more lines to suit the needs of a particular purpose
within the fulfillment center. A diagram for a 5-line system is shown in Figure 2-3. The system
Induction ... Processing Batch Induction ... ".. -... Processing
->
Batch/O / Induction . .. ... . Processing - Batch
Input Sorter Output
Induction ".... . ... Processing -> Batch Induction .... . ... Processing -> Batch Induction ... Processing Batch
- - - - >Flow of Items
Key --->Flow of Empty Trays -,Flow of Items in Trays
Figure 2-4: 5-line automated material handling system linkages. As with the 2-line system, lanes send inducted items on trays to the sorter for distribution to processing stations, linking the
parallel lanes.
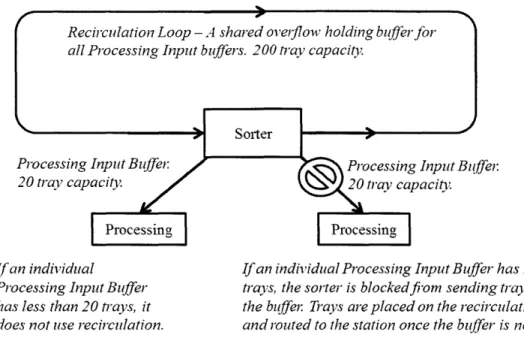
If the individual buffers for full trays leading into processing stations are full, having 20 trays and items present, trays assigned by the sorter are placed instead in the recirculation loop, a limited capacity communal overflow buffer described in Figure 2-4. If the recirculation loop is at capacity, items are rejected from the system ad must be processed into their batches by hand, a processes that is labor-expensive. Estimating how many items will be rejected from the system under particular conditions is important to understanding system efficiency.
Recirculation Loop - A shared oveiflow holding buJJer for all Processing Input buffers. 200 tray capacity.
SSol-ter
Processing Input Bzuffer Processing Input Buffer
20 tray capacity. 202 trh ycapacit 20 rycaay
Processing Processing
If an individual If an individual Processing Input Buffer has 20 Processing Input Buffer trays, the sorter is blocked fom sending trays into has less than 20 trays, it the buffer Trays are placed on the recirculation loop does not use recirculation. and routed to the station once the buffer is not full.
Figure 2-5: Recirculation loop behavior allows flexibility to handling volatility in the short processing input buffers.
The recirculation loop serves two important purposes. If the arrival rate of trays to an individual
processing station is lower than the rate at which the station processes items, the queue leading
into the station will have a finite expected value, L, and achieve steady-state. In a given moment
of time the queue can be larger than the expected value based on variance in arrival and
processing. The recirculation loop attempts to absorb both the excess queue from variance and
any component of the expected value greater than the individual processing station input queue.
If making the modeling assumption that the input buffers of processing stations can be modeled as queues with infinite capacity, the length of the recirculation loop imposes a practical limit on
the viability of this assumption. Queue length is therefore important for assessing the real-world
suitability of a model.
If the arrival rate of trays to an individual processing station equals or exceeds the processing rate of the station, the queue leading into the station will not reach steady state, and will grow
infinitely over time. If this rate condition is temporary, the recirculation loop can absorb the lengthening queue until rate conditions change and the queue can achieve steady state. This
capability is critical to dealing with spikes in demand. During periods of high demand, stations can also receive additional staffing; while proving inefficient returns on labor, this overstaffing can increase capacity. Both of these flex capabilities in dealing with demand spikes are critical to Amazon.com systems, as discussed in previous case studies in on Amazon.com systems dealing with volatility [5].
2.2 Sorter Algorithm for New Batches
As described in the previous section, items arriving at the automated materiel handling system are either part of an open batch already assigned to a processing station, or are the first item in a new batch that must be assigned to a processing station. All subsequent items in the batch that will arrive at the entry queue to the system will be directed to the processing station where the batch is assigned. Items do not arrive in a coherent batch sequence; if an item from a particular batch has just arrived, there may be many items from other batches that arrive before the next item in the particular batch.
When evaluating where to place a new batch, the algorithm considers several different
parameters. These parameters are prioritized, with the most important parameters first. The sorter implements these priorities as follows:
1. Check to see if each processing station is active. If only one station is active, assign the order to that station, otherwise go to Step 2.
2. Check to see if each processing station has an appropriate storage space in the large buffer between the processing station and the batch station. Choose the lane with the most
appropriate storage space, otherwise go to Step 3. This factor is assumed to be irrelevant for the studied system, in which item sizes are similar for almost all orders.
3. Assess each processing station for the number of items incoming to the station from
incomplete batches with its processing-batch buffer. Assign the new order to the station with the least number of incoming items by this metric. This step can be disabled through
parameter settings; if it is, go to Step 4.
4. Assess each processing station for the number of available batch slots in the processing-batch buffer. Assign the new order to the station with the most available space in its outgoing buffer.
Steps 3 and 4 almost always determine the placement of items. Step 3 attempts to balance workload between all processing stations. Analysis of the system will assess the results of this load balancing given the variance in the functional work rates between workers assigned to the processing stations. Step 4 seeks to place items based on the status of the outbound buffer from the processing station leading to the batch station, as shown in Figure 2-5. Analysis of this logic will assess whether this results in a push or pull system, and the efficiency that results.
Recommendations resulting from the analysis will compare the performance of these two existing options and consider further alternatives.
Chapter 3 - Analysis
3.1 Background on Queuing
As the system contains buffers fed by work arrival and depleted by work processing, it is necessary to review the mechanics of queues prior to conducting a specific analysis of the system. A queue is a line or backlog of work that can form leading into workstation providing a service or process. In the context of queues, N designates the number of stations servicing a single queue, X designates the average arrival rate of work over time, pi designates the average
processing rate of a station over time, and p designates the utilization ratio as defined as p =
N*y. The property k designates the capacity of the system, both within the queue and the items being processed by stations [8].
One sort of very well understood queue is an M/M/1 queue, the notation indicating that arrival times are Markovian, processing times are Markovian, and 1 station services the queue. Item arrival and processing distributions within this system are negative exponential distributions with probability density function (PDF) and cumulative density function (CDF) as a property of time of f(t) = A * e -1tand F(t) = 1 - e~A*t for t ;> 0 respectively [8]. these distributions are characteristic of random event occurrence over time, with the low probability long waiting periods representing rare events [8]. In the context of item processing, these rare events may be items that are heavy, damaged, or require special handling, occupying the station for periods that
separate clumps of common items. Negative exponential distributions are memoryless, unchanged in shape by elapsed time. With X=.2, for example, there would be an 18. 1%
probability of an arrival within the first second at which the queue and station stood empty. If several seconds had passed in waiting without an arrival, there would still be an 18.1%
probability that there would be an arrival in the next seconds following the time spent waiting. In other words, time spent waiting is not recorded by the system for the purpose of future outcomes.
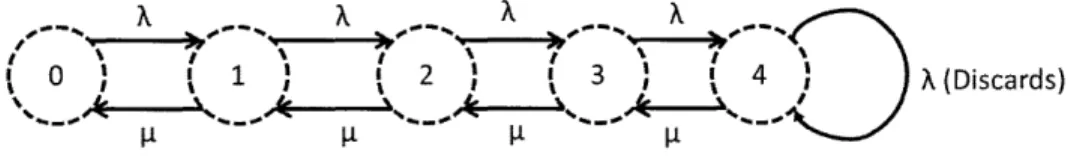
Given this memoryless property of the arrival and processing of items, the only relevant information needed to fully characterize the system and the probability of future events is the current number of items in the system, both in the queue and the single item being processed by the workstation. The system can thus be modeled as a Markov chain [9]. For an M/M/1 system with capacity k=4, the Markov chain can be modeled as per Figure 2-1. The numbers inside the circular states represent the total number of items in the system.
0 1 2 3 4 1 X(Discards)
Figure 3-1: Markov states and transitions of an M/M/1 system with capacity k=4.
If the utilization ratio of an M/M/1 queue is less than 1, i.e. if A P, the queue achieves
steady-state [7]. The average length of the queue, Lq, will have a finite expected value. Of course, at a given instant, the queue length may not equal Lq. Items enter the system in clumps instead of a steady flow, given the negative exponential distribution of time between arrivals. The probability that the system will have a certain number of items present at steady-state is stated as Px where x is the number of items. The sum of all these steady-state probabilities is one: Z= Px = 1 [8].
Po is the state at which no items are being processed or in queue and that Pk is the state in which the queue capacity is full. Po and Pk are therefore the fractions of a given block of time that the workstation will respectively be starved or be blocking new work from entering the queue. Once the steady-state probabilities are known, they can be used to predict lost work to starvation and
blockage. If the arrival rate into a queue is X=30 items per hour, and Pk=15%, we would expect
X*Pk= 4.5 items per hour to be rejected from the system due to blockage.
The state probabilities of an M/M/1 system can be solved by writing a series of steady-state equations for transitions between steady-states, resulting in k equations. Combined with the summation equation, the number of equations will match the number of steady-state
probabilities, allowing for solution as a system of equations. The steady-state probabilities of an
M/M/1 system with k capacity and a utilization ratio p are P(x) = T [9].
.P k+1
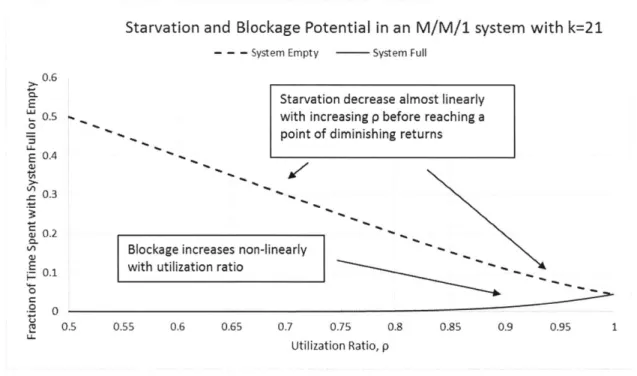
Calculating Po and Pk for a system with capacity of k=21 yields the following results for progressive utilization ratios, as per Figure 2-2.
Starvation and Blockage Potential in an M/M/1 system with k=21 - - - System Empty System Full
0.6 0. L:Jo 0. LJ 4 -c0.3 0.2 CL 0. 0 0 LL
Starvation decrease almost linearly with increasing p before reaching a point of diminishing returns
Blockage increases non-linearly
with utilization ratio
.5 0.55 0.6 0.65 0.7 0.75 0.8 0.85 0.9 0.95 1
Utilization Ratio, p
Figure 3-2: Plots of empty and full steady-state probabilities as a function of utilization ratio for an M/M/1 k=21 system, resulting in system starvation or blockage of the upstream stations.
As p approaches one, steady-state probabilities for both a full and empty system converge to
4.54%. Even when the rate of work arrival into an M/M/l system of finite queue length
approaches the rate at which the system can process items, the variance in arrival and processing ensures that there will still be starvation within the system, forming a theoretical constraint. Managers must therefore expect some level of starvation and blockage for workstations and
optimize utilization ratios to produce the best productivity for the system as a whole [8]. Variation reduction can reduce these factors.
When considering a system with a very large input buffer, it may be reasonable to model it is as an M/M/1 system with infinite queue capacity. As before, the condition for steady-state is p<l. The steady-state probability of no items being present in the system at a given time is:
PO = 1 - p [9]
While this expression for starvation time is simple, in a practical sense we must consider the
average length of the queue, Lq, that will form. Lq is given by:
p2 Lq = [9]
The queue length therefore increases in a non-linear fashion, approaching infinity as p approaches one, as per Figure 2-3. If a queue length of Lq=20 is desired, the percent of time
spent in starvation, PO, will equal 4.56%. While the system cannot fill and block the upstream station, at particular times the queue length will exceed Lq, requiring large buffers.
Queue Length in a M/M/1 System with Infinite Capacity 200 180 160 140 120 100 80 60 40 20 0 0.75 0.8
Asymtotic behavior as p approaches one; averare queue length and wait time approaches infinity
Non-linear increase queue length and wait time as p increases
0.85 0.9 0.95
Utilization Ratio, p
Figure 3-3: Plot of average queue length as a
function
of utilization ratio in a M/M/1 system with infinite capacity.The time required for item processing and arrival does not always follow distribution that is exponential, altering the fundamental memoryless processing property of previous examples. If a process is a composite of tasks each of which require an amount of time corresponding to an independent exponential distribution, the overall distribution of the process by definition will follow a Gamma distribution. This sort of behavior occurs when considering the arrival or processing of a batch of items. C.W. Zhang et al. (2007) propose a using a Gamma distribution
control chart to monitor the processing times of non-standard items on a manufacturing line, for instance [10]. Other common non-memoryless queues may have deterministic elements in their processes, particularly as influenced by standard work or a reliable mechanical process. These
components can sometimes be separated to simplify analysis. For example in their discussion of transfer line decomposition, B. Xia et al. (2012) assume that manufacturing processes are
C a, -I a, a, ci a, a,
Low queue length with
low utilization ratio
deterministic, but subject to exponential breakdown and repair [11]. The analysis of state transitions in queues with non-memoryless properties in both arrival and processing is difficult and often very specific in utility, as the queues with non-memoryless arrival and processing can generally not be modeled effectively using Markov chains [8]. Simulations in this case may therefore provide a more practical means of analysis, although the M/M/1 results discussed in this section are analytically useful as rough guidelines for what sort of starvation and blockage to expect within the system.
3.2 Effects of Sorter Logic and Hypothesis
As discussed in Section 2.2, there are two algorithms that the system's central sorter can use to route work to production lines, activated by different parameters within the sorter script. One assigns work based on available space within the buffer between processing and batch stations. The other script attempts to balance work arrival rate uniformly across all lines. This section will consider the effect of these two algorithms on system performance.
The algorithm that assigns work based on the availability of space within the processing-batch buffer appears to produce a contrary response to variations in the rate of the processing station. Consider a single line with a batch station that operates at a fixed rate. Let the processing station operate at a particular initial work rate. The steady-state condition of the buffer will tend to produce a particular initial arrival rate in response. After a couple of hours, the associate
manning the processing station gets tired and slows down. With the batch station still operating at the same rate, the number of batches in the processing-batch buffer will tend to decrease and more space will become available in the buffer. The sorter will tend to assign more batches to the
line, raising the item arrival rate: a decrease in capacity triggers the routing of additional work. Over the entire system, this effect is consistent; if all batch stations work at the same pace, slower processing stations will tend to receive more work than fast ones.
The space-available processing-batch buffer algorithm is ideally suited to a particular purpose within the observed system. Batch stations are very flexible in terms of manning, and the most labor intensive of the three types of stations. A management strategy for the system is to minimize the number of associates working in the batch stations by dynamically re-assigning batch associates to lines with many items in the processing-batch buffer throughout the course of operations. As a heavily staffed batch station depletes a buffer, the empty buffer space pulls work from the sorter to the line.
This strategy has hidden costs in terms of management attention and the movement of associates. The strategy is also limited in terms of productivity maximization, as processing stations form the mechanical bottleneck of the system and are less scalable with staffing. Dynamically reassigning batch associates leads to inconstant arrival rates of work to the processing stations throughout the course of operations, and therefore wastes capacity within the bottleneck. This thesis must therefore focus on the other algorithm for uniform work between lines in order to consider the throughput optimization.
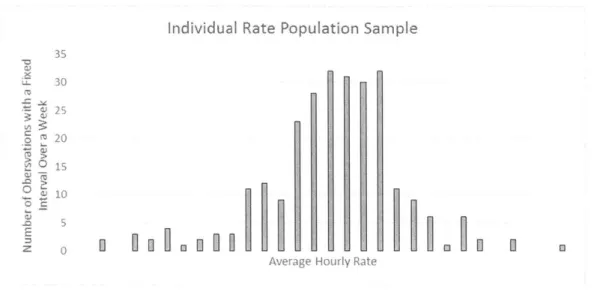
The algorithm that attempts to direct a uniform arrival rate to each production line is also based on batches within the processing-batch buffer and the items designated for those batches. The feedback response is therefore much less agile than a pull system based on the processing stations' input buffers. The system operates as a pull system if faster lines can complete batches more rapidly than others; this will not be the case, however, if the arrival rate of items to the
rates over the course of a week suggest that the average production rate of associates follows a bell shaped distribution with a coefficient of variation of 9%, as shown in Figure 3-1. This level of variation suggests that the sorter feedback mechanism may operate differently for low
capacity and high capacity stations.
Individual Rate Population Sample
3-3 0
2 S0
0
>
Figure 3-4: Distribution of average production rates of induct and processing associates by line over the course of a week, 266 observations. Actual rate data is proprietary to Amazon.com.
If a line has less capacity than the arrival rate of items, the line's production rate will be equal to capacity, which will influence the rate of batch completion and hence the rate at which new work is draw to the line. This is a negative feedback system designed around the principle that the stations' capacity "pulls" work to the station. If the line has a higher capacity than arrival rate, the production rate will be the arrival rate itself, forming a break in feedback that does not pull work based on the line's capacity.
Queueing
theory discussed in Section 3.1 states that the arrival rate of items to stations will always be lower than station capacity for a finite average queuelength. The hypothesis formed from examining this software logic and flow system is therefore that the maiority of lines, which must necessarily have finite average ciueue lengths due to the
physical constraints of buffers and recirculation, will end up with little or no pull effect from the sorter, essentially receiving a random arrival rate unrelated to line capacity. Only very low capacity lines will experience pull response as their queues build. Furthermore, the material flow of the system described in Section 2.1 dictates that sorter output is defined, on average, by overall line output and vice versa as orange carrier trays loop through the system. It can therefore be surmised that the overall output of the system can never greatly exceed the output of the lowest capacity lines, as explored in the next section. This hypothesis forms the basis of inquiry for the thesis.
3.3 Practical Experiment
The hypothesis stated in Section 3.2 need not hold true over the short term. If work-in-progress is available within each buffer, stations can for a short time operate at their individual capacity. As work-in-progress becomes exhausted, however, station outputs will match the arrival rate of work and the hypothesis should exert itself according to the pattern speculated in Figure 3-2.
New Sorter
Sorter Output Output
Rates
Without work- continue to
n-progress, all collapse
bottleneck towards the
+- -- tain lowest
compact into individual
the meanrate
4...Transforms to:
Bottleneck Bottleneck
Capacity Capacity
Figure 3-5: Hypothetical collapse of work arrival (and line output) towards the average capacity and continued collapse towards the lowest capacity over time.
This behavior suggests an easy practical experiment to test the plausibility of the hypothesis. During the course of a normal work day, the system manager added additional personnel to the system bottleneck, raising system capacity and randomly setting the capacity of each individual line. Under these conditions, the hypothesis suggests that there will be a short period of high production followed by a collapse in output.
The observed results of this experiment match expectations, as per Figure 3-3. The system achieved a higher than normal rate of production for approximately thirty minutes, then decreased in productivity by 18% over the course of the next thirty minutes, stabilizing just above the capacity predicted by the historical rates of the slowest associates. These results
support the hypothesis and provide behavior to look for in a system model, but remain anecdotal and without enough detailed examination of lines.
Production Results of Bottleneck Expansion Experiment
1
0.95 Baseline predicted by historical rates
> of associates in slowest lane.
0 0.85 00.85
0.8
CL 0.7
2 15 30 45 60 75 90
Minutes Since Start of Experiment
3.4 Work Studies and Interviews
Extending the search for anecdotal evidence to a more detailed level involved a time study of individual stations and interviews with managers (with consent for use in this paper). The time studies were conducted through direct observation of two experienced associates working at processing and induction stations, each over the course of an hour. These stations were in two separate lanes. All associate actions were recorded by the observer with corresponding times noted by an internal computer clock, achieving a detailed record of actions. On this particular day, each induction associate worked at two adjacent stations, and induction formed the system bottleneck. The induction associate spent 17% of his time starved for work, including time spent moving between the stations in response to the depletion of one or the queue. The processing associate spent 12% of his time blocked by the processing-induction buffer and 6% of his time starved for work by the sorter. These values, shown in Figure 3-4, are once again anecdotal, but demonstrate that there are considerable losses within the system to starvation and blockage at the level of individual lanes. That these losses are so much higher than the 4.56% starvation time discussed in Section 3.1 for a model M/M/1 infinite capacity queue with average queue length of 20 suggests that the lines studied are operating far below the optimal productivity suggested by the limits of their physical space.
Figure 3-7: Time study results of hour-long observations of an induction and processing station.
Interviews with managers confirm that this behavior suggest that this level of starvation and blockage is common. One manager's assistant stated that some associates would spend up to 30% of their time idle during some operational periods as a result of starvation, blockage, and mechanical problems. A senior manager stated that this idle time was frustrating for associates, and that the system required intensive engagement from the managers to address associates' concerns.
Interviews with a shift manager and a system manager described a system behavior that provides further support for the hypothesis that sorter behavior leaves untapped system potential. During shifts with high demand, when processing formed the system bottleneck, they manually fed empty trays to the processing-induction buffer, alleviating the starvation of induction stations from the bottleneck. This process temporarily boosted the work sent from induction to the sorter, and hence the arrival rate of work to the processing stations. System output would temporarily increase, then drop off as per the practical experiment discussed in the previous section. This behavior demonstrates that there is likely untapped capacity within the system bottleneck that is being limited by work arrival rates and sorter behavior.
3.5 Processing Time Data Analysis
In order to move beyond anecdotal evidence and estimate the parameters of lost production potential, it is necessary to examine the processing data from induction, processing, and sorter routing in order to characterize their distributions. Data was collected from all stations within the system over the course of several typical hours of operation on different days. This data recorded the second at which item processing was completed by each station. This second-long
measurement has a lower than ideal granularity, but patterns are still observable for modelling.
Both induction and processing were characterized by a high kurtosis and strong positive skew. Observation of the stations indicated that this distribution was formed from a near-deterministic component dictated by standardized work and mechanical constraints and the long right-ward tail characterized by rare "problem events," such as items that are heavy, damaged, or have incorrect computer information. Amazon.com emphasizes characterization of problem events and finding standardized solutions; most common problems are solved rapidly. Each of these distributions can therefore be modeled as the compound of a deterministic component, designated as D seconds, and a distribution adding a long rightward tail offset D seconds from zero.
The sample distribution of time for items to go through induction is very sharp peaked and has a very thin tail. A deterministic and exponential model does not provide a good fit. Using an offset gamma distribution with D=1 and shape parameter a=.0825 (fit by minimization of sum of square residual error) provides a better model, as shown in Figure 3-5. The rate parameter
p
will vary for individual station's mean induction time, pt, such thatP([t)
= [ D. The cumulative0 fort 1 FI(t,pi) __p_"
{FtI l ) * y(a,fl(i) * t) for t> 1
1 (a)
Induction Sample and Model
amm=*Sample CDF *...*.-Model CDF - -- Offset Exponential CDF
--- - --- -
-0.9
0.8 -J
0.7 An offset exponential CDF is too gradual
0.6 (thick-tailed) in increase to provide a
- suitable model.
0.s
0.4
0.3 A gamma distribution with a shape
0.2 factor less than one provides a
. thinner tail and better fit.
0.1
0-'
Time Between Inductions
Figure 3-8: Sample and model CDF of times between completed inductions. Specific timing data is proprietary to Amazon.com
The sample distribution of time for items to go through processing is less extreme than the
induction distribution, having a less sharp peak and thicker tail. It can be modeled using an offset
exponential distribution with a deterministic component of D=3 and a rate component equal to
t-D, where p. is the mean processing time for an individual station. This model is shown in Figure
3-6. The CDF is therefore:
t 0 fort 3
Processing Sample and Model OunamSample CDF * -* *Model CDF 0.9* 0.8 0.7 0.6 0.5 0 0.4 0.3 0.2 0.1 0
Time Between Processings
Figure 3-9: Sample and model CDF of times between completed processing. Specific timing data is proprietary to Amazon.com
The main sorter routes work to individual lanes in a distribution that follows a negative
exponential curve; this is as expected as a most items arriving at the sorter are part of an existing order that will be located at a fundamentally random station. The distribution does include, however, gaps at static intervals after sending an item during which no items are sent to the same
lane. Items bound for a particular line arriving at the sorter within these gaps are placed in the line's recirculation overflow instead. The random agitation this behavior cases may help provide agitation to arrival rates, keeping the system from fully collapsing as predicted by the hypothesis. While the model could attempt to treat this distribution as a general distribution, the same effect may be achieved by treating the distribution as memoryless and randomly assigning an
3.6 Analysis Conclusion
This chapter postulated that the sorter algorithm that attempted to balance work between lanes will inadvertently deteriorate the productive capacity of the system based on the configuration of materiel flow. A practical experiment and interviews with managers provided anecdotal evidence for this behavior. While work studies confirmed that levels of starvation and blockage could exceed 15% at stations even within the system bottleneck; further interviews suggest that this may be commonplace. Analysis of data on the passage of items through induction and processing
stations, as well as sorter routing to individual lines, suggest logically sound cumulative distribution functions for models. Given that item processing distributions for processing and
induction are not memoryless, the system can be described as an interconnected set of non-Markovian queues, and is analytically intractable. A Monte Carlo simulation that models the behavior of individual lines and the system as a whole by randomly exploring state transitions
Chapter 4 - Simulation and Results
4.1 Overview of Simulation Methods
A Monte Carlo simulation is a virtual experiment used to study a system [8]. The simulation first
creates a computerized model of the system, defining the relevant connections and interactions
for study. The system is then stimulated by input, the virtual arrival of material or jobs driven by
random variables. Processing of items within the system, and hence the relevant queuing
behavior, is also driven by random variables. In the context of the queues discussed previously in
Section 3.1, the simulation effectively records each state and uses random variables to drive state
transitions. By running the simulation over a long period of time, system parameters - such as
work output, average queue length, and starvation and blockage periods - can be experimentally
estimated.
Simulations are a powerful tool when dealing with systems that are too mathematically
complicated to solve analytically, or when a level of detail is required about specific parameters
that cannot be provided through analytical understanding. Simulations are useful for estimating
the theoretical sensitivity of the system to design parameters, and can be used to explore design
decisions for a new system by trial and error [8]. The ultimate goal of simulation is develop
actionable estimates and upper and lower bounds to support decisions, which may include
consideration of "worst case scenarios" generated by the system [12]. Simulations are sensitive
to arbitrary initial conditions, the effects of which must be accounted for when considering
results [12].
As an example of the application of these limitations and goals within a warehouse and
possible outcomes of volatile customer demand and use the resulting parameter estimates to explore different smoothing capacity management strategies [13]. Lee et al. (2013) proposes the use of Monte Carlo methods to evaluate specific risk and costs of quality control strategies, allowing for planning and justification of management decisions [14]. Betterton and Cox (2012) model synchronous transfer lines otherwise intractable to analysis, and suggest that Monte Carlo simulations may be a fruitful and underutilized tool for characterizing complex production lines
[15]. These papers are part of a much larger body of literature applying Monte Carlo techniques
to manufacturing processes, and this paper forms a continuation of this work in examining a modem warehouse material handling system.
When designing a simulation, it is necessary to use random variables to mimic the distributions of work arrival and processing. Random number generators typically output a uniform
distribution between zero and one, or U[0, 1]. As most cumulative distribution functions (CDF) of random variables increase continuously between zero to one, an inversion of the CDF
provides a simple way of randomly sampling system behavior [12]. For example, let a process V be a random variable characterized by an exponential distribution as a function of time and a rate parameter of X. As per Section 3.1, the CDF of V is FV(t) = 1 - e 4*t. Let R be a uniform unit
random variable, R=U[0,1]. Substituting R into the expression for the CDF and solving for t yields:
ln(l - R) _In(R )
t = - = - [12 - modified
format]
Through using a random number generator, we can now sample values of the time process V takes. This method can also be used for more complicated distributions. If there is both a
to the inverse exponential sampled time. An Erlang distribution can be sampled as the aggregate of a number of exponential samples equal to the Erlang distribution's shape parameter [12]. These composition methods allow for the simplification of otherwise complicated distributions.
As simulations track the experimental events over time, it is necessary to determine how the simulation runs its internal clock. The simulation can advance the clock by a fixed window interval, then check what events happened within this time window [8]. This method may lose a level of detail if the order of events within a window is significant. This problem can be
counteracted by selecting a fixed interval that is small compared to the arrival and processing rates, minimizing the chances of multiple events within an interval that could interfere with one another, but doing so is computationally expensive. The simulation can also use the occurrence of events to move the clock forward [8]. The simulation determines which event will occur next in time using random sampling. Time is advanced to this next event. This simulation has the advantage of tracking only one state change within the system at a time, providing a high level of detail for sequential interactions between events. The advancement of time to each must be accounted for in all non-memoryless distributions regardless of the whether the simulation is fixed interval or event driven.
4.2 Monte Carlo Simulation Model
A Monte Carlo simulation model for the automated material handling system allows estimation of parameters of interest, specifically the portion of theoretically optimal throughput achieved for the system and throughput, starvation, and queue length for lines of varied capacity. This
exhibits push behavior for lines that do not have particularly low capacity, degrading the throughput of high capacity lines compared to their potential.
The simulation is a fixed-interval model of stochastic processes that operates by tracking the state of the system, i.e. the number of trays, items, and batches in each line. The fixed interval length is one second. This is the longest interval that guarantees that no station will complete multiple items in a single interval, based on the deterministic component of distributions modeled in Section 3.5. Preventing the simulation of multiple item processing from a single
station eliminates most of the error associated with the sequences of actions within intervals.
The average rate, JPN, of each processing station N is set using an independent random variable
following a normal distribution. Based on the distribution of rates observed in Section 3.2, the coefficient of variation for this distribution is 9%. Based on benchmarked and observed rates, processing rates are on average 76% of induction rates. As the experiment is mainly concerned with interactions between lines, the average rate for each induction station is set using a fixed ratio to its paired induction station: pfN = gPN / 76%. A control test using randomly assigned
induction rates according to a normal distribution produced essentially the same results as this method, but with more variation in stochastic outcome. The rates set for each station dictate the cumulative distribution function (CDF) of their work distributions as described in Section 3.5. Because the gamma distribution for induction work is difficult to invert directly, the CDF is instead solved as a discretized inversion table for reference by the script during model initialization.
As per the system description given in Chapter 2, processing-induction buffers have a capacity of 20 units. Sorter-processing buffers are treated as infinite, given the availability of recirculation loop overflow, but the average queue length is relevant to the physical limitations of the system
and must be recorded. These buffers are initialized with 15 items present at the start of simulation. The influence of these initial conditions will be explored in the next section.
The buffer capacity between processing and batching will be modeled as having a capacity of
180 batches, with each having 50 batches to start. Each batch will be considered to have an
average of four items needed for completion. To model sorter logic, a random 25% of items will be designated as opening a new batch; this batch will be assigned to the line with the least batches, or randomized between the lines with the least batches. Items not opening new batches will belong to a batch that already exists. These items will be assigned to a line randomly, with the exclusive probability of assignment to a line equal to the number of incomplete batches in that line divided by the total number of incomplete batches. To represent the closure of batches, items that go through the processing station will have a 25% chance of removing a batch from the line, representing batch completion for the purpose of sorter routing.
An important simplifying assumption is that items are instantaneously transmitted from induction through the sorter. There is a real time travel and queuing process, but as the items move through the sorter continuously at very high volume, this assumption preserves the reality that the sorter processing rate is not the bottleneck but instead dictated by the arrival of items
from induction. It is also assumed that induction stations cannot be starved for items arriving at the system, but only for empty trays, as the focus of the model is on the internal interactions between stations.
Each run of the simulation is a virtual period of time with the same initial conditions. The run starts with the setting of initial conditions, then follows the following steps:
1. For all stations that do not have a "next action" time set and that are not starved or blocked, use an independent uniform random variable and the inversion of the work CDF to find the integer interval in which the station's next action will occur.
2. Advance the simulation clock one interval.
3. Resolve state changes resulting from induction actions. For each station account for non-integer times within the interval so as not to distort the next action calculation. Track the number of completed items in this interval and reduce the input buffer state of stations taking actions.
4. For all completed items in the interval, make sorter line assignments. If an independent
uniform unit random variable is less than 25%, send the item to a line with the least open batches and create a new batch within that line, otherwise randomly send the item to a line as weighted by open batches.
5. Resolve state changes resulting from processing actions. For each station account for
non-integer times within the interval so as not to distort the next action calculation. For each item processed, if an independent uniform unit random variable is less than 25%, remove a batch from the line. For stations taking actions, reduce the input buffer state and add to the
processing-induction buffer with the linked processing-induction station.
6. Record state data. If the simulation time is less than the set length of the simulation, return to step one.
4.3 Discussion of Results
Simulation results provides support for the hypothesis that system productivity is inhibited by sorter logic that does not provide sufficient feedback to pull work reliably to high capacity lines. Throughput was 11.9% lower than a "perfect pull" benchmark, in which the sorter always sent work to the line with the least items present in the sorter-processing buffer; this benchmark is not realistic to implement due to the need to assign items in batches. Average queue length did not indicate potential problems with exhausting recirculation capacity.
Prior to discussing detailed results, it is first necessary to consider the simulation's match to real-world behavior and possible distortions caused by initial conditions, as discussed in Section 4.1.
Given the evenness of batches and work-in-progress in the initial condition, it would be reasonable to expect the same peaking of production and drop-off in output found in the real world system during the practical experiment discussed in Section 3.3. The simulation does in
fact mimic this general behavior. Figure 4-1 displays the average incremented outputs of 40 simulated 3-hour runs are shown as a function of virtual time. The drop from peak is much more gradual than the real-world system, which may be because of the perfectly even initial conditions of the simulation. Since the study is concerned with steady-state and since real world conditions will never be as even as the model, to reduce distortions from the initial conditions the results will only deal with state data following two hours of simulation, and the simulation will be set for four hour runs.
![Figure 1-1: Amazon.com annual net sales [1].](https://thumb-eu.123doks.com/thumbv2/123doknet/13951680.452362/9.918.113.788.101.487/figure-amazon-com-annual-net-sales.webp)