Analysis and Detection of Jamming Attacks in an
All-Optical Network
by
Poompat Saengudomlert
Submitted to the Department of Electrical Engineering and Computer Science
in partial fulfillment of the requirements for the degree of
Master of Science
at the
MASSACHUSETTS INSTITUTE OF TECHNOLOGY
May 1998
@ Massachusetts Institute of Technology 1998. All rights reserved.
Author ...
Department of Electrical Engineering and Computer Science
May 1, 1998
Certified by ...
Dr. Muriel Medard
MIT Lincoln Laboratory Staff
Thesis Supervisor
Certified by ...Robert G. Gallagei
Professor of EECS Thesis SupervisorAccepted by ...
Arthur C. SmithChairman, Department Committee on Graduate Students
"-Analysis and Detection of Jamming Attacks in an All-Optical Network
by
Poompat Saengudomlert
Submitted to the Department of Electrical Engineering and Computer Science on May 1, 1998, in partial fulfillment of the
requirements for the degree of Master of Science
Abstract
Existing supervisory schemes which can be used for detecting jamming attacks in all-optical networks are mostly based on average power detection and the use of pilot signals. We point out that these methods are not adequate to handle all types of jamming attacks. Based on a newly designed attack detection device at a network node, a novel attack detection scheme against jamming attacks is proposed. Preliminary results on the performance of the proposed attack detection scheme are given for both in-band and out-of-band jamming attacks. To analyze the performance of the attack detection scheme in further detail, we find, under certain conditions, the worst case in-band jamming attack scenarios which correspond to the smallest probabilities of being detected for a given value of average degraded bit error rate. We then investigate how our proposed attack detection scheme performs under the worst case in-band jamming attack scenarios. Finally, we make some modification to our attack detection scheme to improve its performance.
Thesis Supervisor: Dr. Muriel M6dard Title: MIT Lincoln Laboratory Staff Thesis Supervisor: Robert G. Gallager Title: Professor of EECS
Acknowledgments
I wish to express my utmost gratitude to Dr. Muriel M6dard who closely supervised my master thesis from the very beginning to the very end. Her invaluable advice, her patience as well as her kindness helped make this work possible.
I also wish to thank professor Robert Gallager for his insightful comments on various parts of the thesis, professor Amos Lapidoth for the research experience in my first year of the graduate study, and the MIT EECS Department together with the Advanced Networks
Group of MIT Lincoln Laboratory who provided me with financial supports. This master thesis is devoted to my beloved family and my dearest Chaliga.
Contents
1 Motivation for a Novel Jamming Attack Detection Scheme 12
1.1 Introduction to AONs ... 12
1.1.1 Basic Concepts of AONs ... ... 12
1.1.2 Basic Components of AONs ... .... 14
1.1.3 Modulation and Detection Schemes in AONs . ... 15
1.2 Major Attack Categories ... ... 17
1.2.1 Eavesdropping ... 17
1.2.2 Jam m ing . . .. . . .. . .. . . . .. . 17
1.3 Motivation for an Attack Detection Scheme ... 19
1.4 Requirements of an Attack Detection Scheme . ... 22
1.4.1 Applicability to All Types of Data Traffic . ... 22
1.4.2 Identification of Attacked Network Nodes . ... 22
1.4.3 Time Requirement of an Attack Detection Scheme . ... 22
1.4.4 Additional Network Upgrades ... ... 23
1.5 Existing Supervisory Mechanisms ... ... 24
1.5.1 Power Detection ... 24
1.5.2 Optical Spectral Analysis ... 25
1.5.3 Pilot Tones . ... .... .. .. .. . ... .. . . ... ... . ... 26
1.5.4 Optical Time Domain Reflectrometry . ... 27
1.5.5 Bit Error Rate Testing ... 28
1.6 Summary and Outlines of Remaining Chapters . ... 29
2 Novel Jamming Attack Detection Scheme 32 2.1 Attack Detection Device at a Network Node . ... 33
2.1.1 In-Band Jamming Attack ... 33
2.1.2 Out-of-Band Jamming Attack ... ... 34
2.2 Probability Distribution of the Output of the Square Law Detector .... . 35
2.3 Scenario for the Analysis of Jamming Attack Detection . ... 40
2.3.1 Network Topology ... 40
2.3.2 Noise and SNR . ... . ... ... .. 40
2.3.3 Transmission and Detection Scheme . ... 40
2.3.4 Calculation of the BER ... 41
2.3.5 Guaranteed BER .... ... . ... . . . 42
2.4 Attack Detection Scheme: In-Band Jamming . ... 42
2.4.1 Degraded BER ... 42
2.4.2 Probability of Alarm Generation by Attack Detection Devices . ... 43
2.4.3 Construction of an Attack Detection Scheme . ... 45
2.5 Attack Detection Scheme: Out-of-Band Jamming Causing Gain Competition at ED FA s . . . ... . . 51
2.5.1 EDFA Characteristics ... 51
2.5.2 Degraded BER ... 52
2.5.3 False Positive and False Negative Probabilities . ... 52
2.5.4 Construction of an Attack Detection Scheme . ... 53
2.6 Sum m ary . . . .. . . . .. . . . .. . . . . .. . ... . . . .. 55
3 Worst Case In-Band Jamming Attack Scenarios 56 3.1 Setup for the Analysis ... 56
3.1.1 OOK Signalling and the BER ... ... 56
3.1.2 Device Alarm Generation and the Device Alarm Rate at a Network N ode . . . . . . .. . . 59
3.1.3 Formulation of the Optimization Problem . ... 59
3.2 Worst Case Scenario for In-band Jamming at Multiple Bits at a Single Net-work Node . . . .. . . ... ... ... .. . ... . ... . .. .... .... . . 61
3.2.1 Worst Case Scenario for In-band Jamming at Two Bits at a Single Network Node ... 62 3.2.2 Worst Case Scenario for Jamming at T Bits at a Single Network Node 69
3.3 Worst Case Scenario for Jamming at Multiple Bits at Multiple Network Nodes 72 3.3.1 Worst Case Scenario for an Attack at a Single Bit at Two Network
N odes . . . . . . .. . . 73
3.3.2 Worst Case Scenario for an Attack at a Single Bit at M Network Nodes 77 3.3.3 Worst Case Scenario for an attack at T Bits at M Network Nodes . 79 3.4 Sum m ary . . .. . . . .... . . 83
4 Example Attack Detection Systems Against In-Band Jamming Attacks 85 4.1 Calculation of FPattack and FNattack . . . . 85
4.1.1 FPattack and FNattack: Scheme 1 ... 86
4.1.2 FPattack and FNattack: Scheme 2 ... . 87
4.2 Requirements on the Attack Detection Scheme Performance . ... 88
4.3 Examples of Attack Detection Schemes ... .. 89
4.4 Modification to the Attack Detection Scheme Using Hard Limiters at the Input to Network Nodes ... . ... .. ... . 91
4.5 Sum m ary .. .... .. .. .. . .. .... . ... . . .. . .. . .... . . 93
5 Summary and Directions for Future Research 94 5.1 Summary of Results ... 94
5.2 Applicability of the Attack Detection Scheme . ... 95
5.3 Directions for Future Research ... 95
A Proofs of Various Lemmas 96 B Comments on Scheme 2 of the Attack Detection System 115 B.1 Attack at a Single Bit at Two Network Nodes . ... 115
B.2 Attack at a Single Bit at Multiple Network Nodes . ... 118
List of Figures
1-1 Receiver decision regions for coherent detection (left diagram) and for direct
detection (right diagram). ... 16
1-2 Illustration of in-band jamming via component crosstalk at a network node. Node B is the scene of an attack. Node A demonstrates the propagation of the effects of such an attack. ... 18 1-3 Illustration of out-of-band jamming causing gain competition at an EDFA at
a network node. Node B is the scene of an attack. Node A demonstrates the propagation of the effects of such an attack. . ... 19 1-4 EDFA gains of signals at 4 legitimate wavelengths, each with input power
10- 4 W. There are 16 legitimate wavelengths evenly spaced between 1540 nm and 1555 nm. An attack is a uniform pulse which occurs at 1530 nm
(out-of-band) and lasts for 2.5 ms. ... .. 20 1-5 Gain-clamped EDFA gain of signals at 4 legitimate wavelengths, each with
input power 10- 4 W. A uniform pulse attack occurs at 1,530 nm
(out-of-band) with power 10- 4 W and lasts for 2.5 ms. . ... . . 20
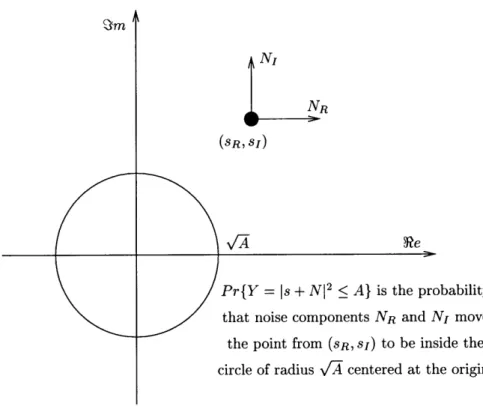
2-1 Attack detection device around a node. . ... . 34 2-2 Geometric view of Pr{Y < A}. ... 37 2-3 Illustration of the fact that Fd(rNo, A, SR, sI) only depends on s through its
norm for the proof of lemma 2.1. ... 39 2-4 Upper bound on BER versus degradation at each of the M (equal to 10)
network nodes in percentage of the ON level (160e). For M = 1, multiply the degradation level (horizontal axis) by 10. Note that the bottom plot is the zoomed version of the top one. ... 43
2-5 FPend-to-end versus detection device threshold (allowed degradation) at each
network node ... . . . .. . . . .. . . . .. . . . . . 46
2-6 FNend-to-end versus detection device threshold (allowed degradation) at each
network node given that the jamming signal magnitude is 0.06% of the ON level for M=10 (0.6% for M=1). With these jamming signal magnitudes,
BERend-to-end can be as high as 10-8. ... 46 2-7 Expected device alarm rate versus BERend-to-end for different detection
de-vice thresholds (M=10, in-band jamming). . ... 48 2-8 Expected device alarm rate versus BERend-to-end for different detection
de-vice thresholds (M=1, in-band jamming). . ... 48 2-9 Expected device alarm rate versus BERend-to-end for different detection
de-vice thresholds (M=10, out-of-band jamming). . ... 54 2-10 Expected device alarm rate versus BERend-to-end for different detection
de-vice thresholds (M=5, out-of-band jamming). . ... 54
3-1 The left diagram shows the decision regions for the receiver, while the right diagram shows the decision regions for the attack detection device at each network node .... .... ... .. .. . ... ... ... .. .. . . .. ... 57 3-2 The BER curves as a function of accumulated coherent components of
jam-ming signals (equal to ET J(i)) in percentage of v/i. ... . 58
3-3 The expected device alarm rate curve as a function of the jamming signal (coherent component) at a single network node together with the BER curve as a function of accumulated coherent components of jamming signals along the light path. The jamming signals (coherent components) in both cases are in percentages of v/?t. In this plot, the SNR is 20 dB, the attack detection device threshold a is 0.15V/ . . . . . . 60 3-4 Expected device alarm rate versus BER for different attack detection device
thresholds (a) in proportion of v7. In this plot, the SNR is 20 dB, and there is one network node (M = 1) ... 60 3-5 The curve of A'(Ji) superposed on the curves of AB'(Ji) for different values
of A (A > 0). Notice that for all values of A, the two curves intersect at zero and a strictly positive value. In this plot, the SNR is 20 dB, and a is 0.15x/v. 63
3-6 IHI(j,j) as a function of J. The values of a for the SNRs of 16, 20, and 24
dB are 0.30v-P, 0.15v7P, and 0.10v/- respectively. . ... 66 3-7 IHI(js,o) as a function of JS. The values of a for the SNRs of 16, 20, and 24
dB are 0.30v1-, 0.15\/-i, and 0.10v/-I respectively. . ... 68 3-8 (Scheme 1) C'(J)/C(J) curves for different values of the SNR. Note that the
function is one-to-one ... ... 75 3-9 (Scheme 1) The curve of B'(J) superposed on the curves of -CM(J) for a
few values of M. In the range (0, q -
V-a),
there exists at most one positive intersection point (7 - M--a is 0.45/-IP in this case). The SNR is 20 dB, anda is 0.15,/P (for M = 1). ... .... 81 3-10 (Scheme 1) IHI(jj) as a function of J. In all cases, IHI(j,j) > 0 in (0,7
-v/Ma). The SNR is 20 dB, and a is 0.15v/-i (for M = 1). . ... 82
3-11 (Scheme 1) IHI(Ja,o) as a function of JS. In all cases, IHI(J,o) < 0 in (0, 7
-v/Mr). The SNR is 20 dB, and a is 0.15v/- (for M = 1). . ... 82 A-1 Illustrations of f(x) in three different cases for the proof of lemma 3.3. . . . 97 A-2 fa(x) and f,(x) as defined in equations A.11 and A.12. . ... 107
B-1 (Scheme 2) The curve of A'(Ji) superposed on the curves of A for different values of A (A > 0). Note that there are at most two positive intersection points. In this plot, the SNR is 20 dB, and a is 0.15vfP (for M = 1)... . 116 B-2 (Scheme 2) The curve of A"(J). Note that there is a unique positive value
J* such that A"(J*) = 0. In this plot, the SNR is 20 dB, and a is 0.15V/-1 (for M = 1) ... .. ... .. 117 B-3 (Scheme 2) The curve of A'(J) together with its reflection across J*, where
A" (J*) = 0. Note that the reflection of A'(J) lies above A'(J) in the interval
[0,J *) . . . . 118 B-4 (Scheme 2) The curve of B'(J) superposed on the curves of A'M(J) for a few
values of M. In the range (0, 7 - V/Ma), there exists at most one positive
intersection point (7 - via is 0.45/-IP in this case). The SNR is 20 dB, and
a is 0.15VP (for M = 1). ... 120 B-5 (Scheme 2)
IH(jj)
as a function of J. In all cases, IHI(jj) > 0 in (0,7B-6 (Scheme 2) IHI(J,o) as a function of JP. In all cases, IHI(J,o) < 0 in (0, 77 -V'iMA). The SNR is 20 dB, and a is 0.15V/-i (for M = 1). . ... 121
List of Tables
2.1 Expected number of device alarms in an observation period. The top row contains the detection device threshold values in percentage of the ON level (160a2). The first column contains the length of an observation period. The first number of each entry in the table is the expected number of device alarms when there is no attack, while the second number is the expected number of device alarms when there is an attack causing BERend-to-end to be approximately 10-8. In this case, M = 10 ... 49 2.2 Expected number of device alarms in an observation period (M = 1). All
the entries have the same meanings as in table 2.1. . ... 49 2.3 Noise variances (a2 and a2 ) associated with EDFA square magnitude gains
(y2) for the transmission at 1540 nm and a bit rate of 1 Gb/s using 1 GHz
bandwidth. ... . ... ... 52
2.4 Expected number of device alarms in an observation period (M = 10, out-of-band jamming). All the entries have the same meanings as in table 2.1. . 53 2.5 Expected number of device alarms in an observation period (M = 5,
Chapter 1
Motivation for a Novel Jamming
Attack Detection Scheme
In this chapter, we outline the basic information on all-optical networks (AONs) that is relevant to the development of an attack detection scheme. Throughout this work, we consider only attacks upon the AON infrastructure. We shall explain why the detection of such attacks in an AON is an important problem. In addition, we explain how the problem of attack detection in an AON is different from the similar problems in electro-optic networks, and from the detection of network failures.
We shall introduce two major attack categories, jamming and eavesdropping, together with existing network supervisory mechanisms which can be used as attack detection schemes. This work concentrates on the detection of jamming attacks. In the final section, we ar-gue that existing supervisory mechanisms are not sufficient to handle all types of jamming attacks.
1.1
Introduction to AONs
1.1.1
Basic Concepts of AONs
In an AON, data transmission within the network is entirely in the optical domain. Aside from the user-to-network interfaces (equivalently the access points), there are no optical-to-electronic or electronic-to-optical conversions of transmitted signals at all nodes within the network. However, there is usually a separate supervisory network, which may not be
all-optical, for management and control purposes.
One major advantage of AONs with respect to their electro-optic counterparts is their much higher bandwidth. In an electro-optic network, the fiber medium is used in place of copper (or other types of transmission medium) for data transmission between network nodes. When data signals arrive at a network node, they are converted to electrical signals which can then be processed for the purposes of routing, signal regeneration, error correc-tion, and so on. While an electro-optic network such as the Fiber Distributed Data Interface (FDDI) can transmit up to the order of 100 megabits per second [7], recent demands for gigabit applications such as video conferencing and remote access to medical images have indicated the need for an even higher network capacity.
The transmission rate of an electro-optic network is limited by the so-called "electronic bottleneck", which refers to the time consuming processes of optical-to-electronic conversion, electrical signal processing, and electronic-to-optical conversion of data signals at network nodes. In this regard, an AON is a natural solution to the need of higher network capac-ity since transmitted signals remain optical throughout the network. At present, various testbeds and laboratory experiments have achieved an aggregated throughput of over 1 ter-abit per second in AONs [10, 8, 22]. Higher network throughputs are expected in the future since much of the 25-terahertz fiber bandwidth remains unused.
Most existing research AONs can be divided into two groups based on the network multiple-access scheme. Simultaneous transmissions on the same fiber can be accom-plished by using either different optical wavelengths in wavelength division multiple-access (WDMA) or different time slots in time division multiple-access (TDMA) or a combination of both. Compared to WDMA, TDMA requires synchronization and is therefore more vul-nerable to dispersion effects. In addition, the use of TDMA in an AON requires further research and development [6]. This work will therefore concentrate on WDMA networks.
In a WDMA network, the fiber bandwidth is divided into optical "wavebands" each of which can currently support the transmission rate up to 10 gigabits per second (capacity of the standard Optical Carrier 192 (OC-192)) [20]. The process of assigning a waveband which is routed through an AON to establish an end-to-end optical transmission path is called "wavelength routing".
Wavelength routing provides a "transparent" transmission path. Transmitted signals may be ampliflied but are not processed or regenerated at network nodes. To the network
nodes, it makes no difference whether transmitted signals are analog or digital, or whether the modulation scheme is amplitude shift keying (ASK) or phase shift keying (PSK). Con-sequencely, an AON can simultaneously support different types of data traffic regardless of their formats or modulation schemes. In addition, transparency provides backward com-patibility since new types of data traffic can be supported by existing networks.
Its high throughput and its ability to support various types of network traffics suggest that an AON can serve as a backbone for a broadband network designed to support diversity of applications by simultaneously carrying data, voice, images and video.
For convenience in future discussion on AONs, we shall refer to a connection between two adjacent network nodes as a "link", and a connection between any two network nodes as a "light path" between them. In general, a light path can consist of a single link or multilple links.
1.1.2
Basic Components of AONs
Basic physical components of AONs are optical terminals (OTs), transmission lasers, optical receivers, fiber cables, splitters and combiners, switches, multiplexers and demultiplexers, and optical amplifiers. These components are used to construct AONs consisting of user terminals at access points (APs), optical links and network nodes.
OTs are user devices attached to an AON through the AP interface. They are nor-mally electro-optic devices that transmit data to an AON using transmission lasers and/or receive data from an AON using optical receivers. Optical receivers are commonly made of photodetectors which are square-law detectors. Consequently, direct detection is easily implemented and is used in several AON testbeds instead of coherent detection. We shall address the distinction between direct detection and coherent detection in the next section. Fiber cables are used to transmit signals across the links between network nodes. In the mostly used wavelength vicinity of 1.5 micrometer, signals travelling along the fiber undergo attenuation of about 0.2 decibel per kilometer [14]. Accordingly, there is a need for optical amplifiers to compensate for signal attenuation on fiber links. In addition, signals travelling at different wavelengths on the same fiber can interact with one another. In particular, a signal travelling at one wavelength may cause amplification or attenuation of a signal at another wavelength on the same fiber [20].
does the opposite by splitting a signal from a single fiber to multiple fibers. A demulti-plexer assigns each of multiple signals (at different wavelengths) on the same fiber to its individual output fiber. A multiplexer combines individual signals (at different wavelengths) from multiple fibers onto a single fiber. A switch is used to route optical signals from one fiber to another. Examples of switches are add-drop multiplexers (ADMs) and wavelength selective switches (WSSs) used in WDMA networks. In general, a switch can be mechan-ical, opto-electronic, or optical. These components are commonly used at network nodes. One undesirable characteristic is component crosstalk, which allows a portion of a signal travelling through a switch at a network node to be present on another output fiber link belonging to a different light path.
Optical amplifiers are used mainly to compensate for signal attenuation along fiber links. They are also used at network nodes to compensate for losses at switching compo-nents. In particular, pre-amplifiers are optical amplifiers used to amplify the input to the network node. Conversely, post-amplifers are optical amplifers used at the output of the network node. At present, the most commonly used optical amplifiers are erbium doped fiber amplifiers (EDFAs) which operate well in the 1.5-micrometer fiber bandwidth.
In addition to naturally occurring noise in passive AON components, EDFAs generate amplified spontaneous emission (ASE) noise which is a dominant noise source in EDFAs. Another important characteristic is the dependency of the EDFA gain on the component noise variance. Moreover, signals in different wavebands on the same fiber can cause "gain competition" at an EDFA by sharing the limited pool of upper-state photons within the same fiber [3].
1.1.3 Modulation and Detection Schemes in AONs
There exist several modulation schemes for the transmission of digital data. In the case of data transmission through telephone lines, the limited bandwidth necessitates the use of higher order symbols, as opposed to binary symbols, to increase the transmission rate. For example, in quatenary phase shift keying (QPSK), a single transmission can represent one of four possible signal values.
In AONs, it is a common practice to represent digital data as streams of binary digits and transmit them using on-off keying (OOK), which is a special case of amplitude shift keying (ASK). In OOK, the light source is turned off during the 0-bit transmission and
turned on during the 1-bit transmission. Furthermore, the ON signal of OOK can have either a non-return to zero (NRZ) pulse shape or a return to zero (RZ) pulse shape.
There are several reasons for the choice of OOK in AONs. First of all, modulating lasers is difficult. Because of the simple structure of OOK, it is easier to modulate lasers based on OOK than on other transmission schemes. Moreover, detection of OOK signals can easily be done using photodetectors which are usually square-law detectors. Finally, owing to the enormous bandwidth of the fiber medium, we do not have a restriction on bandwidth; and representing digital data as binary streams is sufficient for practical purposes.
We shall adopt OOK as the transmission scheme throughout this work. Furthermore, we assume a binary data source with equal probabilities of "0" and "1", and the transmission rate of 1 gigabit per second using 1 gigahertz bandwidth.
In AONs, detection of transmitted bits is generally done using square-law magnitude detection of received signals. The decision rule for the receiver can be based on whether the output of a square-law detector at the receiver exceeds a certain threshold. This method is referred to as "direct detection". The right hand side of figure 1-1 shows the decision regions for a decision rule based on direct detection.
Fm decision region sm
boundary -
Z
On level
Re
,
On level ReZo
Z1
decision region Zo: decision region for OFF level boundary Z1: decision region for ON level
Figure 1-1: Receiver decision regions for coherent detection (left diagram) and for direct detection (right diagram).
Based on the knowledge of both real and imaginary parts of the received signals, the receiver can use a different decision rule whose corresponding decision regions are shown in the left hand side of figure 1-1. This detection method is referred to as "coherent detection". Coherent detection yields a lower bit error rate (BER) than direct detection for the same
value of signal-to-noise ratio (SNR). However, the implementation of coherent detection requires additional hardware because photodetectors are square-law detectors.
Typical values of BERs under normal operation in AONs are lower than 10-12; and are much lower than those of non-optical networks. It is important to keep this quantity in mind so that we are aware of the operating regions (in terms of BERs) in the remaining chapters.
1.2
Major Attack Categories
This work concentrates on intentional attacks upon the infrastructure of an AON. By an "attack", we mean an action performed on the infrastructure of an AON with an intention to disrupt network services and/or obtain unauthorized information.
There exist several methods of attacks upon the infrastructure of an AON. However, these attacks can be grouped into two categories for the purpose of attack detection. We consider two categories: eavesdropping and jamming [16].
1.2.1 Eavesdropping
Eavesdropping refers to the attempts of an attacker trying to obtain unauthorized infor-mation from an AON. For example, an attacker can obtain the desired inforinfor-mation by "tapping", which refers to the method of bending the fiber to change an incidence angle and allowing light to escape from a fiber core [5, 26, 27]. Alternatively, an eavesdropper can obtain the desired information from a "crosstalk channel", which refers to an adjacent output link (leaving from the network node shared by a legitimate light path) that contains portions of legitimate data signals as a result of component crosstalk at the network node.
1.2.2 Jamming
A jamming attack can directly alter data signals if jamming signals have the same fre-quencies as data signals. We refer to this case as "in-band jamming". Conversely, an "out-of-band jamming" attack occurs when a jamming signal is out of the transmission band but can still degrade the data signals. For example, an out-of-band jamming signal at an EDFA can cause gain competition and attenuate data signals at other frequencies.
This work concentrates on the detection of jamming attacks. Although jamming can occur at fiber links as well as at network nodes, we shall consider only jamming at network nodes since there exist several ways of constructing optical-fiber transmission systems with good protection against line tapping [5, 27].
Note that we do not worry about jamming attacks which do not change the BER signif-icantly. An example of such attacks is in-band jamming with additive low-variance white Gaussian noise at a single network node.
In-Band Jamming Attacks
We concentrate on the case in which an attacker gains legitimate access to a network node (or multiple network nodes) and inserts in-band jamming signals onto a legitimate light path using component crosstalk at a network node. Figure 1-2 illustrates an in-band jamming attack via crosstalk at a network node. Note that jamming can also occur at several network nodes simultaneously.
data signal A
legitimate node with a light path switching plane
in-band -- I
jamming signal
-via crosstalk
jammming
*
light path accessed- " . . -. by a jammer
Figure 1-2: Illustration of in-band jamming via component crosstalk at a network node. Node B is the scene of an attack. Node A demonstrates the propagation of the effects of such an attack.
In electronic or electro-optic networks, component crosstalk is significantly lower than 0.03% of the signal level, while the same quantity in an AON is between 0.03% to 1.0% [9]. Since the level of component crosstalk in an AON is higher than in an electro-optic network, an attack using the same set of jamming signals can be more detrimental to the BER in an AON than in its electro-optic counterpart. However, jamming via component crosstalk at network nodes requires high jamming signal power (compared to the power level under
normal operation) to affect data signals in a legitimate light path significantly.
Out-of-Band Jamming Attacks Causing Gain Competition at EDFAs
An out-of-band jamming attack can cause gain competition at EDFAs and attenuate data signals. Figure 1-3 illustrates this type of out-of-band jamming attacks. Amplifier gain fluctuation during an attack depends on the type of EDFAs used. Throughout this project, we assume the use of gain-clamped EDFAs in which internal out-of-band oscillation is used to clamp the gain [17].
A
legitimate node with data light path an EDFA signal
attenuated
data signal
a
-J \ jamming
B signal C
# light path accessed " - - . by a jammer
Figure 1-3: Illustration of out-of-band jamming causing gain competition at an EDFA at a network node. Node B is the scene of an attack. Node A demonstrates the propagation of the effects of such an attack.
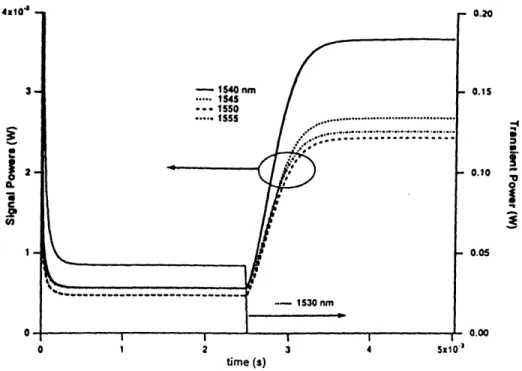
Figure 1-4 shows gain fluctuation for an EDFA under an out-of-band jamming attack. Figure 1-5 shows similar information for a gain-clamped EDFA.
As in the case of in-band jamming, an attacker can cause gain competition at multiple network nodes simultaneously. We shall discuss the effects of jamming at multiple network nodes in further detail later on.
1.3
Motivation for an Attack Detection Scheme
Before we consider the method of attack detection, it is important to understand why the detection of attacks in an AON is an important problem.
One important characteristic of an AON is its "transparency", which refers to the ab-sence of detection and processing (besides amplification) of transmitted signal at network nodes. Transparency allows an AON to support different types of data traffics
simultane-4x10 3 - 40nm - 0.15 *.... 1545 ... 1550 *-.-... ... 1 - ,0.10 0 -- S130 nm 0 I I I I 0.00 0 1 2 3 4 5x10" time (s)
Figure 1-4: EDFA gains of signals at 4 legitimate wavelengths, each with input power 10- 4
W. There are 16 legitimate wavelengths evenly spaced between 1540 nm and 1555 nm. An attack is a uniform pulse which occurs at 1530 nm (out-of-band) and lasts for 2.5 ms.
I.Ox10- - 0.20 8 0.15 o.- O.S - 1540 nm a 0.6- •... 1545 --- 1550
1
--... 1555 - o.io oo S 0.4 -1530 nm 0.05 0.2-0.0 I I I 0.00 0.0 0.2 0. 0.6 0.8 1.0 1.2x10⁴ time (s) Figure 1-5: input power 10- 4 W andGain-clamped EDFA gain of signals at 4 legitimate wavelengths, each with 10- 4 W. A uniform pulse attack occurs at 1,530 nm (out-of-band) with power
lasts for 2.5 ms.
ously regardless of their formats or modulation schemes. In general, the network manager does not know whether a particular data bit stream is coded for error control, or what type of coding scheme is used. Apart from an error control mechanism between the transmitter and the receiver, there is no error detection or error control mechanism for the transmission across individual fiber links. While an error detection mechanism between the transmitter and the receiver may tell us about the presence of an attack, it cannot provide information regarding the location of an attack.
An important consequence of transparency in an AON is "attack propagation", which refers to the propagation of the effects due to an attack at a network node to downstream nodes. In an AON, attenuated or degraded data signals propagate through downstream nodes without being processed. Therefore, the effects due to an attack at a single network node will not be removed by any downstream node.
As a result, simultaneous jamming at multiple network nodes can provide accumulated effects along a light path. For in-band jamming, coherent components of jamming signals at multiple network nodes add up constructively along the light path. In general, intentional coherent in-band jamming at multiple network nodes is hard to perform since an attacker needs to have complete timing information.
For out-of-band jamming that causes gain competition at EDFAs, the effects due to simultaneous jamming at multiple network nodes always add up constructively. In other words, the SNR degradation increases as we move towards downstream nodes.
Attack propagation allows an attacker to insert relatively small in-band or out-of-band jamming signals at multiple network nodes and degrade the overall BER along the light
path significantly.
Network transparency and high component crosstalk in AONs raise several security issues which do not exist in electro-optic networks. To provide a secure network connection in an AON, there is a need for the detection of attacks. The detection of attacks which disrupt AON services will serve as an error detection mechanism in the data link layer. On the other hand, the detection of eavesdropping will protect sensitive information. An attack detection system will also provide information regarding the location of an attack. The information is useful for further actions such as rerouting.
Owing to unique characteristics of AONs, the detection of attacks in an AON requires special consideration and a new solution.
1.4
Requirements of an Attack Detection Scheme
In this section, we describe desirable characteristics of an attack detection scheme. In gen-eral, an attack detection scheme in an AON should satisfy all of the following requirements.
* Is applicable to all types of data traffic. * Identifies attacked network nodes.
* Detects an attack in a short period of time.
* Does not require complicated network hardware upgrades. We shall address each requirement separately.
1.4.1 Applicability to All Types of Data Traffic
Because of transparency in an AON, an attack detection scheme cannot depend on specific characteristics of the data traffic, such as a coding scheme and a transmission rate, since there is no detection of transmitted signals within a network (refer the discussion in section 1.3).
1.4.2
Identification of Attacked Network Nodes
In order to perform appropriate actions after detecting an attack, we may need to know the location of an attack. For example, if we know the locations of network nodes which are under attack, we can reroute the light path to avoid attacked nodes. [18] presents an algorithm for attack localization in an AON provided that we have a detection scheme for detecting whether a particular node is under attack.
1.4.3 Time Requirement of an Attack Detection Scheme
In a high data rate AON, we need to detect an attack quickly for several reasons. The first reason is that the effects of a very short attack (e.g. an attack on a single data bit) become less and less apparent over time as the observation period increases. If the required observation period in our attack detection scheme is too long, a very short attack will not be detected. We shall demonstrate that it is harder to detect an attack in which relatively
few number of bits are attacked than to detect an attack in which a large number of bits are attacked.
The second reason is that a large amount of data can be affected by an attack which lasts for a relatively short time. Another reason is the large network "latency", which refers to the number of bits in flight or equivalently the number of bits under transmission within the network at a given time. We provide detailed explanation in what follows.
Consider the consequences of a high data rate for the detection of attacks in an AON. In the case of eavesdropping, we want to find out quickly whether or not an eavesdropper is present since a longer detection time means a larger amount of data being compromised. For a jamming attack corrupting the BER, we can perform retransmission of data after the detection of an attack. Doing so would require memory buffers at the transmitter and possibly at the receiver. After detecting an attack, we may want to retransmit all data bits under transmission during the observation period for the detection of that particular attack (since we do not know which portion of bits are corrupted). Owing to the large network latency, the number of bits we want to store in memory can be very large. For example, if we take one second to detect a jamming attack in a system with a transmission rate of 1 gigabit per second, we may need to retransmit 1 gigabit of data. Although the time used
in retransmitting bits may not be a problem, the amount of memory buffers used to store data bits can be very large; and the associated cost can be very high.
For real time applications in which there is no retransmission of data, we may still want to detect an attack quickly so that the network supervisor can reroute the data traffic onto an alternate light path before sacrificing a large amount of data (provided that such a fast rerouting scheme exists).
1.4.4 Additional Network Upgrades
It is desirable to build an attack detection system in an AON with little network modifica-tion. As we shall describe in chapter 2, our proposed attack detection system is constructed from attack detection devices proposed in [16]. The proposed device is a "wrapper", which refers to a wrap-around device to be installed at a network node.
The use of wrap-around devices at network nodes allows a construction of an attack detection system with relatively little network modifications. In addition, we can choose to install these wrappers only in certain parts of an AON which are susceptible to attacks.
Finally, it is important to distinguish between the problem of attack detection and the detection of network failures. The quality of service can be significantly degraded without the presence of network failure. For example, an attacker can perform in-band jamming and increase the BER by several orders of magnitude. A failure detection mechanism will not be able to recognize such an intentional attack since an attack does not cause any malfunction in the network. We shall see in the next section that existing supervisory mechanisms are more apt to detect network failures than to detect intentional attacks.
1.5
Existing Supervisory Mechanisms
Existing supervisory mechanisms which could be used as attack detection schemes are power detection, optical spectral analysis, pilot tone, optical time domain reflectrometry, and bit error rate testing. We shall discuss each method separately. In particular, we shall demonstrate why each method is not sufficient for detecting jamming attacks in an AON. Some comments on the detection of eavesdropping are included for completeness of the discussion. [16] provides the basic ideas outlined in this section.
1.5.1 Power Detection
In power detection, we measure the average signal optical power over a bandwidth of a single waveband or across multiple wavebands, and compare the measured power to the estimated level. If the difference between the measured power and the estimated level is beyond a certain threshold, an attack yielding that amount of change in the power level will be detected.
Power detection has been used to detect network failures such as amplifier failures in an AON [12, 24]. It can be used to detect an eavesdropper who taps off a significant amount of signal power from a legitimate channel [27], or a jammer who introduces in-band jamming signals which significantly alter the average power of transmitted signals. It can also be used to detect significant EDFA gain degradation due to out-of-band jamming attacks.
Power detection techniques rely on the computation of statistical averages which requires an observation of a large number of samples. For the detection scheme to be able to distinguish between the presence and the absence of a jamming attack, an observation of a sufficiently large number of corrupted bits is required. If an attacker performs
in-band sporadic jamming to degrade the BER to an unacceptable level without changing the average signal power enough to cause an alarm, the detection scheme based on power detection techniques will not detect such an attack.
As a specific example, an attacker can jam at only one bit in every period of 10 mi-croseconds. At the transmission rate of 1 gigabit per second, jamming signals are present only 0.01% of the time and the average power of data signals together with jamming signals may not be much different from the average power of data signals alone since the power of jamming signals is not significant "on average", i.e. the power of jamming signals is averaged out over a large number of observed bits. As a result, such an attack may not be detected. Note that if such a sporadic attack is out-of-band, the EDFA gains for trans-mitted signals, which vary as users come on and off, will not be significantly degraded on
average. Therefore, the attack will not be detected.
According to [16], an out-of-band jammer can cause gain competition at an EDFA without causing degradation in total power. For example, consider a series of two EDFAs. An out-of-band jammer can cause gain competition at the first EDFA. Consequently, the data signals are attenuated and the output of the first EDFA has a lower SNR. Suppose that the second EDFA has "automatic gain control" (AGC), i.e. the second EDFA maintains its output power at a specified level. As a result, the output of the second EDFA will have the same power level (despite lower SNR) as if there were no attack.
As another example, an attacker can perform an out-of-band jamming attack causing gain competition at an EDFA together with an in-band jamming attack to compensate for the power loss due to gain competition [16].
An eavesdropper may insert in-band jamming signals after tapping data signals from a legitimate fiber and leave the power level unchanged. In this case, an attack will not be detected by power detection techniques. Finally, if power detection is performed only on the legitimate channel, eavesdropping from a crosstalk channel will not be detected.
1.5.2 Optical Spectral Analysis
Optical spectral analyzers (OSAs) measure average optical powers of signals at different frequencies. One obvious benefit of the use of an OSA with respect to power detection is the ability to detect a change in the spectrum shape of transmitted signals, even if the change in the spectrum shape does not alter the average power level over the channel bandwidth.
An OSA can be used to detect in-band jamming attacks which significantly alter the spectrum shape of transmitted signals even if these attacks yield the same average power as before.
Moreover, an OSA can be used to detect out-of-band jamming attacks provided that jamming signal frequencies are still in the range of an OSA. Using an OSA, we are able to detect some sporadic out-of-band jamming attacks which cause gain competition at EDFAs but do not change the average power and cannot be detected by power detection techniques. An OSA can also be used to detect an eavesdropper who taps off a significant amount of signal power and causes the change in the spectrum shape. In this regard, an OSA does not provide much more information than power detection techniques.
Although we can detect a wider variety of attacks using an OSA, the additional infor-mation given by an OSA is still the values of statistical averages. As in the case of power detection, the use of an OSA to detect jamming attacks requires an observation of a large number of corrupted bits in order to distinguish between the presence and the absence of an attack. Therefore, an OSA may not detect in-band sporadic jamming attacks for the same reason as in the case of power detection.
Furthermore, an OSA may not detect sporadic out-of-band jamming attacks when the jamming signal frequencies are outside the OSA spectrum range. Finally, if an OSA is used to detect eavesdropping only on the legitimate channel, eavesdropping from a crosstalk channel will not be detected.
1.5.3 Pilot Tones
Pilot tones are signals which are transmitted along the same paths as the data signals but are distinguishable from the data signals. They are used to detect any transmission disruption that may occur to the data signals.
In general, pilot tones will not detect a jamming attack unless the pilot tones themselves are affected by such an attack. An attack which affects only the transmitted signals may not be detected. For example, if pilot tones are outside the transmission band, an in-band jamming attack will not be detected.
For subcarrier multiplexed (SCM) signals, which are the signals obtained from combining data signals and pilot tones in the same frequency band, an in-band jamming attack may affect the pilot tones and may therefore be detected. However, pilot tones are generally less
sensitive to corruption than data signals.
If pilot tones are amplified by the same amplifiers as transmitted signals, an out-of-band jamming attack causing gain competition at EDFAs will attenuate pilot tones and may be detected. However, with AGC in subsequent EDFAs, the power levels of pilot tones may automatically be restored. In this case, an attack will not be detected.
On the other hand, if pilot tones and the transmitted signals are separately amplified, an out-of-band jamming attack which attenuates data signals through gain competition will not be detected by the use of pilot tones.
Note that pilot tones are subject to jamming themselves. An attacker may attempt to modify pilot tones directly after degrading data signals. By doing so, the attacker may restore the power levels of pilot tones to their normal levels and the corresponding attack will not be detected. For example, an attacker can perform out-of-band jamming causing gain competition which attenuates the power levels of pilot tones as well as data signals. At the same time, the attacker introduces in-band jamming signals at the frequencies of pilot tones to compensate for power losses. This combination of attacks will not be detected.
Futhermore, since pilot tones are detected only where we expect to receive the trans-mitted signals, they do not provide any information about an eavesdropper who taps the desired signals from a crosstalk channel instead of a legitimate channel.
1.5.4 Optical Time Domain Reflectrometry
Optical time domain reflectrometers (OTDRs) analyze echoes of the probe signals at the transmitter end instead of at the receiver end. One unique characteristic of the use of OTDRs which differentiates it from the use of pilot tones is the ability to perform attack detection solely at the transmission side.
OTDRs are mainly used to detect faults, bends and losses in fiber links. By modulating OTDR probe signals, the performance of OTDRs in fault detection can be enhanced [25]. If jamming signals share the same frequencies as OTDR probe signals, the corresponding attacks may be detected. On the other hand, we cannot detect an in-band jamming attack if OTDR probe signals are out of the transmission band.
The use of OTDRs to detect failures across multiple links requires bi-directional EDFAs [13]; otherwise, we cannot detect the reflected OTDR probe signals. In general, we may not have bi-directional EDFAs; and OTDRs are used to detect malfunction on individual
sections of fiber links. As in the case of pilot tones, if OTDR probe signals share the same EDFAs as transmitted signals, out-of-band jamming attacks causing gain competition at EDFAs may be detected. However, like pilot tones, OTDR probe signals are generally less sensitive to corruption than data signals. On the other hand, if OTDR probe signals and transmitted signals are separately amplified, out-of-band jamming attacks causing gain competition at EDFAs will not be detected.
OTDR probe signals are subject to jamming themselves. An attacker can perform out-of-band jamming causing gain competition at an EDFA, together with in-band jamming at the frequencies of OTDR probe signals to compensate for power losses. This combination of attacks will not be detected.
Finally, as in the case of pilot tones, if we detect OTDR probe signals only where we expect to receive transmitted signals, eavesdropping from a crosstalk channel will not be detected.
1.5.5 Bit Error Rate Testing
A bit error rate tester (BERT) can be used to monitor the quality of the transmission path of interest in terms of the number of bit errors per time period. Based on the fact that both in-band and out-of-band jamming attacks can degrade transmitted signals and thus make it more likely for the receiver to make decision errors, an unusually high BER is an indicator of the possible presence of an attack on the network. In this regard, a BERT can also be used to detect jamming attacks based on degradation of the BER.
A BERT can also be used to detect eavesdropping provided that the eavesdropper taps off a significant amount of power from transmitted signals and the associated BER deteriorates significantly.
As in power detection and optical spectral analysis, the operation of a BERT is based on computing a statistical average which can consume too much time (see the discussion on why we want to detect an attack quickly in section 1.4.3). Specifically, the time required for a BERT to obtain a good estimate on the BER of a transmission path is in the order of several seconds for a transmission at 1 gigabit per second and the BER in the range of a 10-10 to 10-8 (provided that an attack lasts for several seconds), and in the order of hundreds of seconds for the BER in the range of 10- 12 to 10-10 (provided that an attack lasts for several hundreds of seconds).
Another drawback of the use of BERTs is the need to transmit test patterns, which take up transmission resources. Moreover, the use of a BERT requires information on the modulation scheme. Thus this technique is not appropriate for a transparent network. Finally, BERTs are very expensive.
We shall refer to BERTs again in chapter 2 when we compare the time required for our proposed attack detection scheme to detect some jamming attacks to the time required for a BERT to perform the same task.
1.6
Summary and Outlines of Remaining Chapters
In this chapter, we argued why existing supervisory mechanisms cannot be used to detect all types of jamming attacks in an AON. The insufficiency of existing supervisory mechanisms in detecting jamming attacks serves as the motivation to the construction and the analysis of a novel jamming attack detection scheme which is the subject of the remaining chapters.
In chapter 2, we introduce the attack detection device at a network node as proposed in [16]. Based on this device, we construct a jamming attack detection system. In ana-lyzing its performance, we assume some rather pessimistic jamming attack scenarios. In those scenarios, we consider a light path consisting of 1 and 10 network nodes and OOK transmission at a rate of 1 gigabit per second using 1 gigahertz bandwidth. In addition, coherent components of jamming signals at all network nodes are assumed to be equal and constant throughout an observation period.
We consider separately the cases of band jamming and out-of-band jamming. For in-band jamming, we assume that the transmitted signals are always degraded in such a way that the receiver is more likely to make a decision error, i.e. the jamming signals increase the magnitude of the transmitted signal when the OFF signal of OOK is sent and vice versa for the ON signal.
We assume that an out-of-band jamming attack causes gain competition at gain-clamped EDFAs. In particular, we assume an equal percentage of gain attenuation of data signals at all network nodes. With gain attenuation at EDFAs, transmitted signals associated with the OFF level of OOK are not affected while those associated with the ON level are. An important factor is the dependence of the noise variance on the EDFA gain. Therefore, we base our analysis on the simulation data obtained from [1].
The decision rules for the attack detection device at each network node and at the re-ceiver are based on direct detection, which is implemented in several existing AON testbeds. Our goal in chapter 2 is to obtain preliminary results on the performance of the proposed attack detection scheme. Therefore, we adopt direct detection in the analysis. When we investigate the performance of our approach for detecting jamming attacks in general, we shall remove the direct detection constraint and consider coherent detection since it yields a lower BER than direct detection for a given SNR, and since coherent detection can be done using direct detection photodetectors. [19] discusses how we can measure, using square-law detection, the input to a network node and its delayed version as well as the output of a network node and its delayed version in order to find both the magnitude difference and the phase difference between the input and the output of a network node.
In particular, our proposed attack detection scheme employs two levels of alarms. The first-level alarms are generated by attack detection devices at network nodes. The second-level (higher-second-level) alarm is generated on top of the first-second-level alarm in each observation period. Decision of the second-level alarm generation is based on the number of alarms generated by attack detection devices in each observation period.
An important parameter is the observation time required for our proposed attack de-tection scheme to detect an attack with high reliability, i.e. the associated probabilities of decision errors are sufficiently low. We measure the performance of the attack detection scheme in terms of two quantities: the false positive and the false negative probabilities of a second-level alarm in the corresponding observation period. Finally, we compare the observation periods in our attack detection scheme with those of BERTs.
In chapter 3, we assume coherent detection at attack detection devices at network nodes as well as at the receiver. The main goal of this chapter is to find the worst case in-band jamming attack scenario among all scenarios associated with the same average degraded BER. In particular, the worst case in-band jamming attack scenario yields the lowest ex-pected number of first-level alarms in a given observation period. Consequently, it is the attack scenario with the lowest probability of being detected. We want to consider the worst case scenario since we want to be able to provide a guarantee on BER regardless of the policy or the sophistication of an attack.
We choose to describe an attack scenario by specifying coherent components of jamming signals at all network nodes and at each bit time. We formulate the problem of searching
for the worst case attack scenario as an optimization problem whose variables are coherent components of jamming signals at all network nodes at each bit time and whose objective is to minimize the expected number of first-level alarms in an observation period.
After deriving the expressions for the average BER and the expected device alarm (first-level alarm) rate functions, we solve the minimization problem for a jamming attack at one network node and at two transmitted bits. We then extend the result to the case of jamming at one network node and at more than two bits.
In parallel, we solve the minimization problem for an attack at one transmitted bit and at two network nodes. We then extend the result to the case of jamming at one transmitted bit and at more than two network nodes.
Finally, we combine the results to establish the worst case in-band jamming attack scenario for jamming at multiple network nodes and at multiple transmitted bits.
In chapter 4, we find out how our proposed attack detection scheme performs under the worst case in-band jamming attack scenarios that we found in chapter 3. As in chapter 2, we measure the performance of the attack detection scheme in terms of the false positive and the false negative probabilities of a second-level alarm in the corresponding observation period. Finally, we suggest the use of hard limiters at the input to network nodes in order to improve the performance of our proposed attack detection scheme. Chapter 5 provides a summary of this work together with directions for future research.
Chapter 2
Novel Jamming Attack Detection
Scheme
In this chapter, we construct a jamming attack detection scheme based on the detection device proposed in [19]. The chapter begins with basic information on the attack detection device and related analytical groundwork. Throughout the chapter, we assume the decision rules based on direct detection at the receiver as well as at attack detection devices at all network nodes.
We then introduce a novel attack detection scheme which is a decision system based on the number of alarms generated by attack detection devices at network nodes in an observation period.
To analyze the performance of our attack detection system, we assume some pessimistic in-band jamming attack scenarios. Rather than assuming that jamming signals at different network nodes are additive white Gaussian random variables, we assume that they are coherent and add up constructively along the light path. Moreover, we assume that jamming signals are equally spreaded out at all attacked nodes so that no overt attack is present at any network node.
The problem of determining in-band jamming attack scenarios which are the hardest to detect is relegated to chapter 3. The results obtained in this chapter will indicate that the proposed detection scheme can at least handle some in-band jamming attack scenarios. The performance analysis in the worst case scenarios (which are the hardest to detect) will be postponed to chapter 4.
In the final section, we investigate the detection of out-of-band jamming attacks causing gain competition at EDFAs. The analysis is based on the data obtained from [1] and on some pessimistic of-band jamming attack scenarios. The subject of the worst case out-of-band jamming attack scenarios (which are the hardest to detect) is extremely device specific and is outside the scope of this research.
2.1
Attack Detection Device at a Network Node
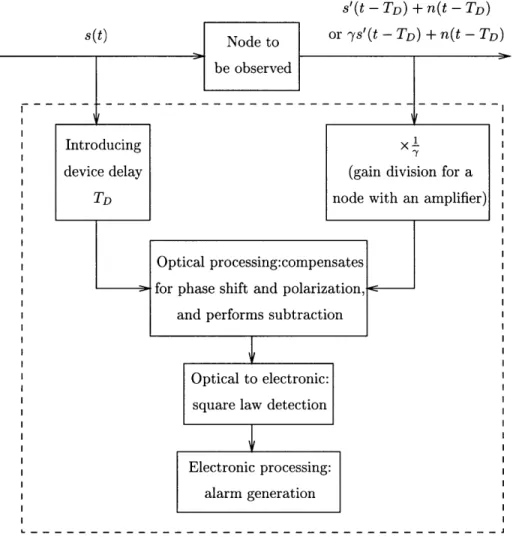
Our jamming attack detection system is constructed from attack detection devices which wrap around certain network nodes. In general, a network node can consist of switching devices such as ADMs and WSSs, or optical amplifiers such as EDFAs, or a combination of different devices. Each attack detection device contains two taps, one at the input and the other at the output of a network node. Figure 2-1 shows the schematic diagram of the device proposed in [19].
Denote the signal at the first tap by s(t), which after passing through a device delay
TD, becomes s(t - TD). Denote the sum of the signal and noise at the second tap by s'(t - TD) + n(t - TD), or ys'(t - TD) + n(t - TD) for a node with an amplifier. Note that we
describe the signal component at the second tap by s'(t - TD) instead of s(t - To) to take
into account a possible phase shift and polarization due to normal operation of the network node.
Our device takes these two signals and compensates for the phase shift and polarization due to normal operation of the network node, i.e. the device makes the signals from the two taps coherent with each other. The device then performs a signal subtraction and a square-law magnitude detection of the result. In general, the change in phase and polarization of s(t) does not vary rapidly; and we can safely assume, in the absence of any attack, the output of the square law detector is In(t - TD)12, or 1-n(t - TD)12 for a node with an amplifier. For notational simplicity, we shall drop the time notation in what follows.
2.1.1 In-Band Jamming Attack
If there is an in-band jamming signal denoted by J, the output of the square law detector will be In + J12 (or I (n + J)12) , which is likely to be much greater than In12 (or IIn 2) for an attack with a sufficiently large in-band jamming signal. Based on the output of the
s(t) Introducing device delay TD Optica for pha and Node to or be observed s'(t- TD) + n(t- TD) ys'(t - TD) + n(t - TD)
x1
(gain division for a ode with an amplifier)ates
ion,
- - - -- - - - - - -I
Optical to electronic: square law detection
Electronic processing: alarm generation
Figure 2-1: Attack detection device around a node.
square law detector, we set a decision threshold for an alarm generation. As we shall see later on, the value of such a threshold is a design parameter for our attack detection system.
2.1.2 Out-of-Band Jamming Attack
In analyzing gain competition, our analysis assumes that each EDFA at a network node makes up precisely for signal attenuation in the previous link of the light path. Consider an out-of-band jamming attack causing gain competition at an EDFA in a network node. An out-of-band jamming attack which robs the EDFA gain for the legitimate signal by a% will cause the output of the square law detector to be a-s + 1.
Since the quantities involved in the analysis of the device behaviours are in terms of
I processing:compens ise shift and polarizat