Conjugated linoleic acid supplementation for 8 weeks fails to impact body composition, lipid profile, or safety parameters in overweight, hyperlipidemic men 1, 2, 3
Shama V Joseph4, Hélène Jacques4, Mélanie Plourde5, Patricia L Mitchell6, Roger S McLeod6, Harold M Aukema7 and Peter JH Jones7*
4Department of Food Science and Nutrition, and Institute of Nutraceuticals and Functional Foods, Laval University, Quebec, QC G1V 0A6, Canada
5Research Center on Aging, University of Sherbrooke, Sherbrooke, QC J1H 4C4, Canada
6Department of Biochemistry & Molecular Biology, Dalhousie University, Halifax, NS B3H 4H7, Canada
7Department of Human Nutritional Sciences, and Richardson Center for Functional Foods and Nutraceuticals, University of Manitoba, Winnipeg, MB R3T 6C5 Canada
RUNNING TITLE: Conjugated linoleic acid and body composition
WORD COUNT: 6,417, NUMBER OF FIGURES: 2, NUMBER OF TABLES: 6
AUTHOR LIST FOR INDEXING: Joseph, Jacques, Plourde, Mitchell, McLeod, Aukema, Jones
1Supported by funding from the Advanced Foods and Materials Network, Canada. M. Plourde is also supported by funding from Fonds de la recherche en santé du Québec, Canada.
3Author disclosure: Shama V Joseph, Hélène Jacques, Mélanie Plourde, Patricia L Mitchell, Roger S McLeod, Harold M Aukema and Peter JH Jones have no conflicts of interest.
*To whom correspondence should be addressed: PJH Jones, Richardson Center for Functional Foods and Nutraceuticals, 196 Innovation Drive, University of Manitoba, Winnipeg, MB R3T 2N2 Canada, Tel: (204) 474-8883 Fax: (204) 474-7552, Email: [email protected]
8Abbreviations used: -OHB, -hydroxybutyrate; c, cis; CRP, C-reactive protein; CVD, cardiovascular disease; hs, high sensitive; Ox-LDL, oxidized LDL; RCFFN, Richardson Center for Functional Foods and Nutraceuticals; t, trans.
ABSTRACT 1
The usefulness of conjugated linoleic acid as a nutraceutical remains ambiguous. Our objective 2
was, therefore, to investigate the effect of CLA on body composition, blood lipids and safety 3
parameters in overweight, hyperlipidemic men. A double-blinded, 3-phase crossover trial was 4
conducted in overweight (BMI ≥ 25 kg/m2); borderline hypercholesterolemic (LDL-C ≥ 2.5 5
mmol/L) men aged 18-60 y. During three 8-wk phases, each separated by a 4-wk washout period, 6
27 subjects consumed under supervision in random order 3.5 g/d of (i) safflower oil: Control, (ii) 7
50:50 mixture of trans 10, cis 12 (t10, c12) and cis 9, trans 11 (c9, t11) CLA: Clarinol G-80® and 8
(iii) c9, t11 isomer: c9, t11 CLA. At baseline and endpoint of each phase body weight, body fat 9
mass and lean body mass were measured by DXA. Blood lipid profiles and safety biomarkers, 10
including insulin sensitivity, blood concentrations of adiponectin, and inflammatory [hs-C-11
reactive protein (CRP), TNF-α, IL-6] and oxidative (oxidized-LDL) molecules were measured. 12
Effect of CLA consumption on fatty acid oxidation was also assessed. Results show that CLA 13
treatments did not affect body weight, body composition or blood lipids compared to control, 14
either at phase end or as change from baseline to endpoint. CLA failed to impact β-oxidation rate 15
of fatty acids. No significant alterations were observed in any of the safety parameters tested. In 16
conclusion, while no detrimental effects were observed with supplementation, these results fail to 17
confirm a role for CLA in either body weight or blood lipid regulation in humans. 18 19 20 21 22 23 24
INTRODUCTION 25
Nutraceutical and functional food approaches are being investigated as viable options to help 26
combat the obesity epidemic (1). Positional and geometric isomers of linoleic acid, known as 27
conjugated linoleic acid, have shown promise with respect to modulation of body composition, 28
but the majority of the evidence is from in vitro and animal models. In mice, CLA induces as 29
large as a 60 % reduction in body fat mass (2). Less dramatic, results have been observed in rats 30
(3), pigs (4), and hamsters (5). It has been established that the trans 10, cis 12 isomer (t10, c12 31
CLA), rather than the cis 9, trans 11 (c9, t11 CLA; ‘Rumenic acid’) isomer, is primarily 32
responsible for these effects (Reviewed in 6, 7). CLA supplements for humans promoting weight 33
loss and increased lean body mass are currently being marketed in the form of a 50:50 mixture of 34
the t10, c12 and c9, t11 isomers based on these animal data and on limited clinical evidence (8-35
10). However, CLA does not perform consistently in humans, and therefore its purported anti-36
obesity effects remain unconfirmed. In fact, a growing number of studies suggest a lack of effect 37
of CLA on body composition (11-13). In addition, CLA’s effect on risk markers of 38
cardiovascular disease (CVD) also remains inconclusive. CLA has been shown to have hypo-39
cholesterolemic, hypo-triglyceridemic and anti-atherosclerotic properties in animals (14). CLA 40
supplementation for 8 wk in normolipidemic men and women lowered plasma TG and VLDL-C 41
(15). However, other studies showed that CLA supplemented at varying doses either in the form 42
of naturally enriched foods or industrially produced supplements, failed to affect blood lipids (11, 43
13, 16, 17). The discrepancy observed between the effectiveness of CLA in animal and in vitro 44
models, and human studies may be due to differences in dose and duration of supplementation, 45
species-specific physiology, gender, as well as the initial metabolic status of the study sample 46
(18). 47
In addition, controversy surrounds the safety of CLA as a dietary supplement. In mice, 48
CLA causes liver enlargement due to steatosis (19, 20). In humans, CLA has been shown to 49
induce insulin resistance in overweight men (21), possibly due to increases in inflammatory 50
molecules [C-reactive protein (CRP), TNF- α and IL-6] (22-24). 51
The primary objective of this study was to evaluate the effectiveness of two forms of CLA 52
in modulating body weight and body composition, as well blood lipids, in overweight, 53
hyperlipidemic men in a free living environment. Our secondary objective was to study the effect 54
of the CLA supplementation on selected inflammatory and oxidative markers and insulin 55
sensitivity, considered as safety parameters in the sample population. 56 57 58 59 60 61 62 63 64 65 66 67 68 69 70 71
SUBJECTS AND METHODS 72
Subjects. Healthy male volunteers aged 18 to 60 y, with a BMI ≥ 25 kg/m2 were recruited from 73
the city of Winnipeg, Manitoba. Men responding to radio and newspaper advertisements were 74
initially screened for eligibility by answering a phone-based questionnaire. Individuals were 75
considered ineligible for participation in the study if they were smokers, were consuming 2 or 76
more alcoholic drinks per day, were taking medication that affects lipid metabolism such as 77
cholestyramine, colestipol, niacin, clofibrate, gemfibrozil, probucol, HMG-CoA reductase 78
inhibitors, high dose (4 g/d) dietary supplements, as well as fish oil capsules within 6 mo prior to 79
the start of the intervention. The diagnosis of diabetes mellitus, liver disease, kidney disease or 80
heart disease precluded participation in the study. Potential subjects from this initial stage were 81
invited to the Richardson Center for Functional Foods and Nutraceuticals (RCFFN) at the 82
University of Manitoba to undergo further screening based on anthropometry and a blood draw to 83
determine fasting blood lipid profile. Subsequently, suitable candidates were invited back for 84
assessment of their overall health and fitness involving a second blood draw for routine 85
biochemistry and hematology, and a complete history and physical examination taken by the 86
study physician. Signed informed consent was obtained from subjects prior to any procedure 87
performed on them for study purposes. The study protocol was approved by Health Canada, and 88
the Research Ethics Boards of the University of Manitoba and Dalhousie University. This study 89
was registered at www.clinicaltrials.gov, ID NCT01047280 (January 8, 2010). 90
91
Diet and treatments. The three treatments tested in the study were (i) 3.5 g/d of safflower oil 92
(Control) (ii) 3.5 g/d of 50:50 mixture of t10, c12 + c9, t11 CLA oil (Clarinol G-80®, containing 93
2.8 g of total CLA)], and (iii) 3.5 g/d of c9, t11 CLA (c9, t11 CLA oil, containing 2.7 g of total 94
CLA). The three experimental oils were kindly provided by Lipid Nutrition (Wormerveer, The 95
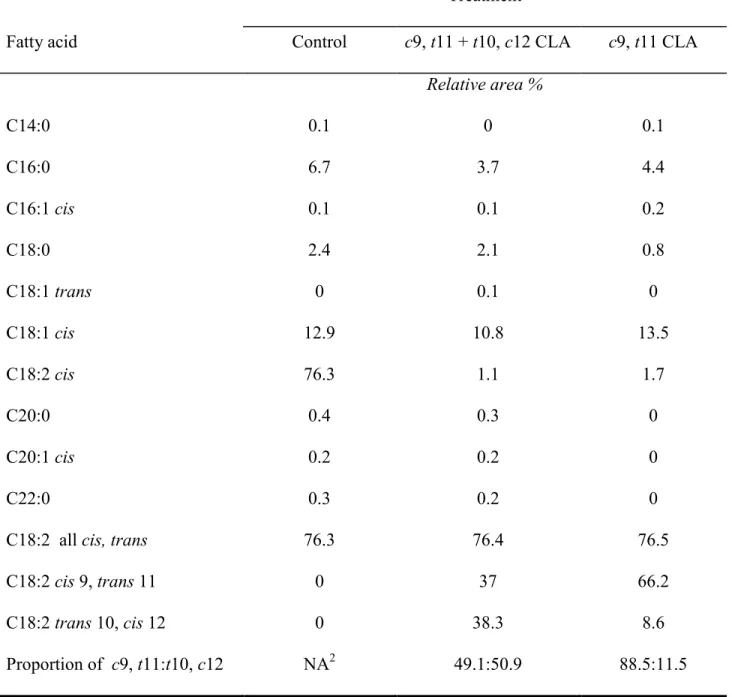
Netherlands). The fatty acid composition of the experimental fats is presented in Table 1. The 96
CLA and control treatments were administered to subjects in the form of liquid oil, which was 97
mixed into a constant amount (150 g) of fat-free, sugar-free fruit yogurt. This study was 98
conducted under free-living conditions wherein subjects were able to maintain their usual dietary 99
habits and physical activity level during the intervention phases, as well as washout periods. 100
Study volunteers were required to be present at the RCFFN during week day evening mealtimes 101
when treatment yogurts were administered under supervision of the clinical coordinator, ensuring 102
strict compliance. Subjects were strongly encouraged to partake of a complementary supper 103
buffet that was offered to them during their daily visits. Weekend treatments were provided as 104
‘take away’, and empty or unused containers were returned on the following Monday to monitor 105
compliance on the weekends. 106
107
Study Protocol. This study was designed as a double-blind crossover clinical intervention in 108
which subjects received the two experimental CLA treatments and a control treatment in random 109
order. The clinical trial comprised 3 treatment phases of 8 consecutive wk each, alternated with 4-110
wk wash out periods. The crossover nature of the study ensured minimal subject variability as 111
each participant served as his own control. Subjects were instructed by the clinical coordinator to 112
maintain their regular dietary habits and physical activity during the treatment phases, as well as 113
during the washout periods. Physical activity questionnaires and 24 h dietary recalls provided a 114
general idea of any changes in diet and physical activity that may have occurred during the study. 115
Blood biochemistry and hematology were conducted at the end of each phase to ensure that no 116
health abnormalities had occurred as a result of the experimental treatments. 117
Measurement of body weight and body composition. Subjects weighed themselves on a clinical 119
weighing scale during their daily visits to the RCFFN. BMI was calculated as weight (kg)/height 120
(m2). Body composition (including overall body fat mass and lean mass) was analyzed at the 121
beginning and end of each phase using DXA. DXA scan series was conducted using General 122
Electric’s Lunar Digital Prodigy Advance and the General Electric Prodigy Body Composition 123
software program, EnCore 2005, was used to analyze the scans and generate body composition 124
data. 125
126
Blood sampling. On days 1, 2, 56 and 57 of each phase, venous blood samples were collected 127
following a 12 h overnight fast. Subjects were also asked to abstain from alcohol 24 h prior to 128
blood draw. Evacuated blood collection tubes containing disodium EDTA were used for 129
obtaining plasma, whereas serum samples were obtained from blood drawn into uncoated tubes. 130
Blood samples were centrifuged at 1500 rpm for 20 min, and plasma and serum were separated 131
and stored at -80 C until further analysis. All analyses on the stored samples were completed 132
within 24 mo of initial collection. 133
134
Estimation of plasma lipids and lipoproteins. Commercially available enzymatic assays were 135
used to quantify cholesterol (Roche Diagnostics) and triglycerides (Sigma-Aldrich) in plasma 136
samples and lipoprotein gradient fractions. Plasma lipoproteins in 1000 L of sample were 137
separated by density gradient unltracentrifugation at 55,000 rpm for 20 h in a SW60Ti rotor 138
following pre-treatment of samples as described previously (25). Twenty fractions of 200 L 139
each were then collected starting from the top of the gradients. Fractions were defined as 140
VLDL=1-4, and HDL=11-20. The cholesterol concentration of each class of lipoproteins was 141
calculated as the area under the curve of the corresponding density gradient profile (25). LDL-C 142
concentrations were calculated using the Friedewald equation (26). 143
144
Assessment of atherogenicity of LDL-C. Oxidation of LDL-C is considered to be one of the key 145
events in the development of atherosclerosis. There is some evidence that CLA can beneficially 146
influence the susceptibility of LDL to oxidation. Plasma concentration of oxidized LDL (Ox-147
LDL) was measured using a commercially available solid phase two-site enzyme immunoassay 148
(Mercodia, Sweden) with murine monoclonal antibody mAb-4E6. The assay was performed 149
according to the manufacturer’s instructions. 150
151
Assessment of insulin sensitivity (HOMA index). Insulin sensitivity of subjects was determined 152
by the homeostasis model insulin resistance index (HOMA-IR) (27). HOMA index was 153
calculated using the formula: fasting insulin concentration (µU/mL) x fasting glucose 154
concentration (mmol/L)/22.5. Plasma insulin and glucose concentrations were measured by 155
radioimmunoassay and enzymatic methods, respectively (28, 29). 156
157
Estimation of inflammatory biomarkers [hs (high sensitive)-CRP, TNF- and IL-6]. Plasma 158
concentrations of hs-CRP were estimated using Behring latex enhanced high-sensitivity assays, 159
which were conducted on a Behring BN-100 nephelometer (Behring Diagnostic, Westwood, 160
Massachusetts), using calibrators provided by the manufacturer (N rheumatology standards SL). 161
Serum IL-6 and TNF- concentrations were measured with the help of commercially available 162
ELISA kits (Quantikinine HS immunoassay kits; R&D Systems Inc., Minneapolis, MN). 163
Measurement of plasma adiponectin. Plasma concentrations of adiponectin were measured with 165
a commercially available ELISA kit according to manufacturer’s instructions (Linco Research, 166
St. Charles, MO). 167
168
Estimation of 13C-linoleate β-oxidation. CLA is known to be a ligand for PPAR-α (30), and
169
therefore might increase the rate of β-oxidation of fatty acids in muscles. For this purpose, a 170
subset of 10 men from the study were orally administered a dose of uniformly labeled linoleic 171
acid on day 56 of each phase. During the breakfast mealtime subjects consumed a single dose of 172
50 mg of 13C-linoleate (Cambridge Isotope Laboratories Inc., Andover, USA), which was mixed 173
into butter and spread on half a bagel. -oxidation of the tracer was measured toward recovery of 174
13CO2 in breath samples collected in duplicate at baseline and every hour for the next 12 h using a 175
breath collection device (Easysampler, Quintron Instrument Company, Milwaukee, WI) and 10 176
mL evacuated glass tubes (Exetainer, Labco Ltd, Buckinghamshire, UK). A final breath sample 177
was collected at 24h after 13C-linoleate administration. Enrichment of 13C in breath CO2 178
following the ingestion of 13C-linoleate was analyzed by isotope ratio mass spectrometry (Europa 179
20-20, Sercon Ltd, Crewe, Cheshire, UK) using He as the carrier gas (Praxair Canada Inc. 180
Mississauga, ON, Canada). 100% CO2 gas was used as the reference. Additionally, fasting 181
plasma concentrations of FFA, TG, and -hydroxybutyrate ( -OHB), the most stable plasma 182
ketone and possibly another marker of -oxidation, were estimated at the end of each phase. 183
Commercially available reagent kits were used for the analysis of -OHB (RX Daytona kit; 184
Randox Laboratories Ltd., Antrim, UK), FFA (Wako Diagnostics, Richmond, VA) and TG (Dade 185
Behring Inc., Newark, DE) using an automated clinical chemistry analyzer (Dimension XPand 186
Plus, Dade Behring Inc., Newark, DE). 187
Statistical analyses. A sample size of 28 was determined based on a power level corresponding to 188
80 % in detecting an anticipated difference in our primary outcome, which was body fat mass, to 189
a probability level of < 0.05 (31). Taking into account a dropout rate of approximately 25 %, the 190
target sample size for recruitment was determined to be 36. We therefore recruited a final sample 191
of 36. Sample size for the measurement of fatty acid oxidation rate was calculated to be 8 based 192
on the change in the area under the curve with an alpha of 0.05 and a beta of 0.8 (32). A total 193
sample of 10 men, randomly selected from the main study group of 27, ensured that we obtained 194
complete information on beta oxidation of at least 8 participants. 195
Data were subjected to repeated measures ANOVA based on the comparison between the 196
final data from the end of each phase with the data from the start of the phase. Due to the 197
crossover nature of the study, possible carryover effects were tested by including a term in the 198
statistical model referring to the sequence in which the experimental treatments were 199
administered. However, a repeated-measures ANOVA was used to identify significant 200
differences between the effects induced by the three treatments on total triglycerides, cholesterol, 201
glucose, FFA and β-OHB, and fatty acid oxidation of 13C-linoleic acid at the end of phases only, 202
in a subset of 10 men. Data that were not normally distributed were transformed with the PROC 203
RANK procedure of SAS prior to analysis (hs-CRP, TNF-α, IL-6, HOMA-IR index, 204
triglycerides, total cholesterol, HDL-C, Ox-LDL and adiponectin). Spearman’s correlation 205
coefficient was used to identify significant associations between dependent variables. Statistical 206
significance was set at α=0.05 for all analyses, and data are presented as their mean ± standard 207
error of mean (SEM). Data were analyzed with SPSS versions 11.5 and 12.0 for Windows (SPSS 208
Inc., Chicago, IL), GraphPad Prism (GraphPad Software Inc. La Jolla, CA) and SAS (SAS 209
Institute Inc., Cary NC). 210
RESULTS 212
Subject characteristics. A total of 36 men were recruited. Participants were randomly assigned to 213
one of 6 treatment sequences. Eight subjects withdrew from the study due to reasons described as 214
‘inconveniences of a personal nature’ (phase 1-n=6; phase 2-n=2). A total of 28 men successfully 215
completed the entire 3-phase protocol. However, the data of one subject who was diagnosed with 216
mononucleosis during his second washout period have been excluded from the entire statistical 217
analysis. The final sample size was 27. Additionally, one subject’s data was removed only from 218
HOMA-IR analysis due to highly unstable fasting plasma glucose concentration. The baseline 219
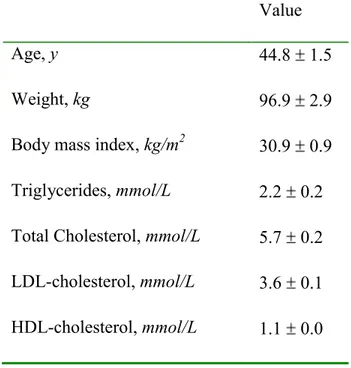
characteristics of the subject population are presented in Table 2. Subjects were overweight or 220
obese (BMI = 30.8 0.8 kg/m2) (33), with plasma LDL-C concentrations categorized, based on 221
American Heart Association criteria, as being either optimal (<2.6 mmol/L, n=1), near optimal 222
(2.6-3.3 mmol/L, n=9), borderline high (3.4-4.1 mmol/L, n=11), high (4.15-4.9, n=5), or very 223
high (> 4.9, n=1) (34). 224
225
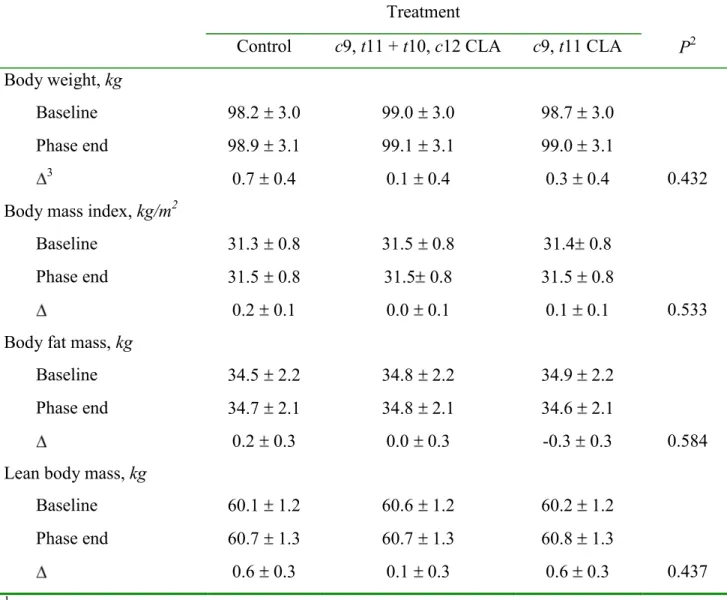
Effect of CLA supplementation on body weight and body composition. At the end of the 8-wk 226
supplementation period no significant differences were observed in the changes in body weight, 227
BMI, body fat mass, or lean body mass, either at end of phase or over time from baseline to 228
endpoint, as a result of CLA supplementation compared to control, or between the two CLA 229
treatments (Table 3). 230
231
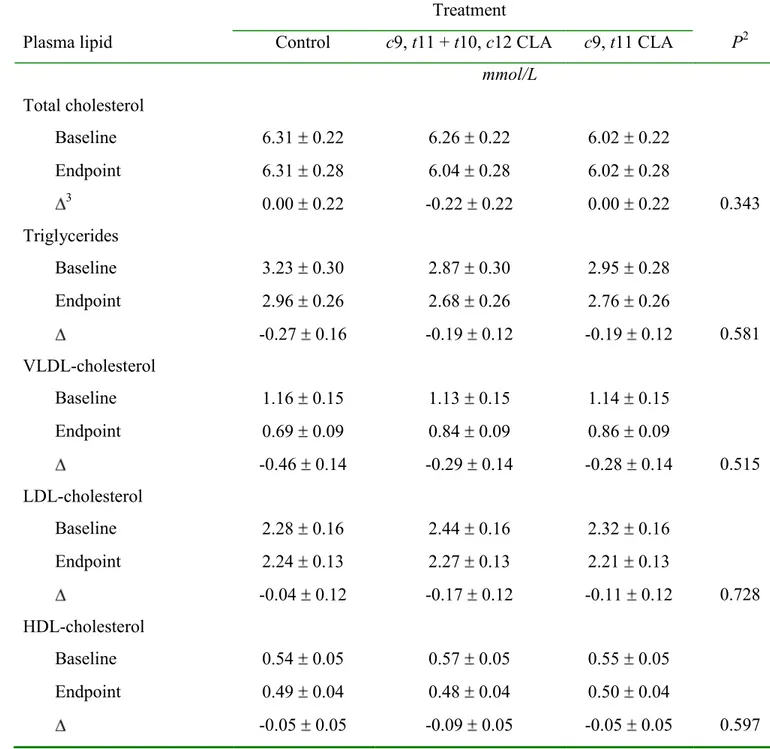
Effect of CLA supplementation on plasma lipids and lipoproteins. Compared to control, and 232
between the two CLA treatments, no significant changes were observed in circulating 233
concentrations of total cholesterol and triglycerides at the end of 8 wk of CLA supplementation 234
Plasma lipoprotein concentrations in response to treatments are presented in (Table 4). 235
Consumption of CLA supplements for 8 wk did not alter plasma concentrations of VLDL-C, 236
LDL-C and HDL-C when compared to control treatment and between the two CLA treatments 237
(Table 4). 238
239
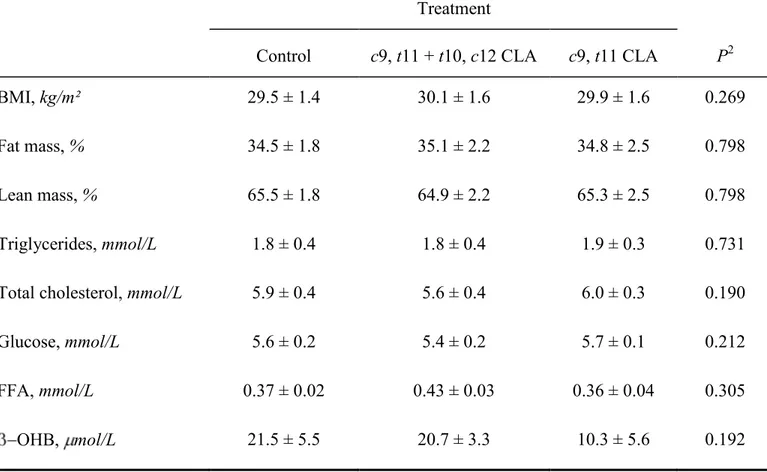
Effect of CLA supplementation on β-oxidation of linoleic acid. There was no statistical 240
difference between the three treatment phases for the fasting plasma measures in a subgroup of 241
our subjects, as presented in Table 5. Consuming CLA as the c9, t11 CLA or t10, c12 and c9, t11 242
CLA mixture did not increase FFA and β-OHB concentrations compared to the control, and 243
between CLA treatments. Although there seems to be a link between certain variables such as 244
BMI, plasma FFA and -OHB, we did not find any such significant correlation in this trial among 245
the men consuming any of the treatments (data not shown). These results indicate that CLA 246
supplementation did not increase β-oxidation of 13Clinoleate as seen by the cumulative -247
oxidation curves of 13C-linoleate following 8 wk of supplementation (Figure 1); neither did it 248
increase ketone production. 249
250
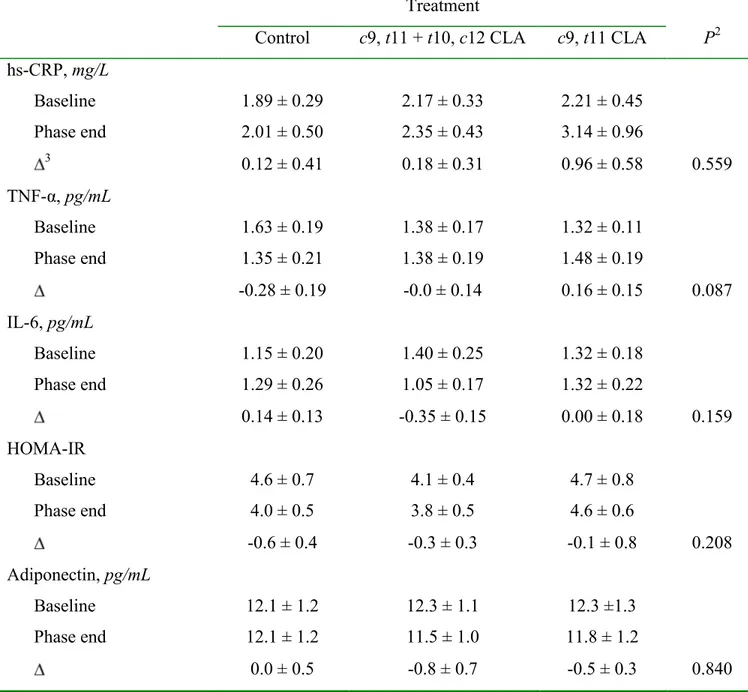
Effect of CLA supplementation on inflammatory markers. No significant differences between 251
treatments were observed in change from baseline to endpoint in the blood concentrations of 252
either hs-CRP, TNF-α or IL-6 (Table 6). 253
254
Effect of CLA supplementation on plasma adiponectin. No significant change in circulating 255
adiponectin concentration was observed as a result of CLA supplementation when compared to 256
control treatment, as well as between the two CLA supplements (Table 6). 257
Effect of CLA supplementation on plasma oxidized-LDL. At the end of 8 wk of 259
supplementation, no significant effect of CLA treatments was observed on plasma concentrations 260
of oxidized-LDL when compared to control (Figure 2). 261
262
Effect of CLA supplementation on insulin sensitivity. Determination of the HOMA-IR index as 263
a surrogate marker of insulin resistance indicated that no significant differences between 264
treatments, in change from baseline to endpoint, occurred following 8 wk of supplementation 265 (Table 6). 266 267 DISCUSSION 268
Functional foods such as CLA may aid in controlling the increasing prevalence of obesity 269
and related diseases. The amount of CLA in the diet ingested from ruminant meats, milk and 270
dairy products has been estimated to be approximately 152 mg/d in women and 212 mg/day in 271
men (35), and may be somewhat higher due to the endogenous conversion of vaccenic acid from 272
these foods to CLA (36). However, dietary CLA alone is not sufficient to attain therapeutic levels 273
(~ 3-6 g/d), necessitating the use of CLA supplements and CLA-enriched foods. 274
The present study shows that supplementation of CLA in overweight, hyperlipidemic men 275
for a period of 8 wk failed to alter body weight or body composition. Similarly, none of the CLA 276
treatments improved blood lipid profiles. These results agree with other human data 277
demonstrating a lack of effect of CLA (as either c9, t11 isomer, t10, c12 isomer or c9, t11 + t10, 278
c12 CLA mixture) on body mass or the different body compartments from recent clinical trials
279
(11-13, 16, 17, 37, 38). However, a meta-analysis of 18 studies concluded that CLA 280
supplementation (mainly as a 50:50 mixture of c9, t11 and t10, c12 isomers) at a dose of 3.2 g/d 281
does reduce fat mass at a rate of 50 g/wk for up to 2 y in both men and women (39). More 282
recently, the ability of CLA to elicit significant reductions in total (40) and regional (trunk and 283
legs) fat mass was observed in a sample of women (40-42). Our study population consisted of 284
only males, which could partly explain the lack of efficacy, but further work in females is 285
required to establish if gender plays a role in determining the effectiveness of CLA in humans. 286
Nevertheless, the results of the current study add to the growing body of evidence that CLA 287
might not be a useful tool for weight management in men. 288
It has also been suggested that CLA possesses cardio-protective potential by regulating 289
markers that are associated with the development of heart disease. However, the failure to elicit a 290
response in the plasma lipid and lipoprotein profiles following CLA supplementation in 291
overweight, hyperlipidemic men in this study is in keeping with recent data indicating that CLA 292
does not impact blood lipids (13, 37). Furthermore, whether CLA in mixed or pure form, is either 293
naturally incorporated into dairy products such as milk (1.3 g CLA/d) (13) and butter (2.59 g 294
CLA/d) (11), or is chemically synthesized, the results on blood lipids are apparently the same 295
suggesting no impact of the CLA dietary form. In an overweight male population similar to the 296
current study (37), consumption of 4.5 g/d of c9, t11 and t10, c12 CLA mixture did not improve 297
blood lipid profile which supports our finding. 298
Proposed mechanisms by which CLA, mainly the t10, c12 isomer, have been shown to 299
reduce fat mass and body weight in animal and in vitro studies include decreased enzymatic 300
activity of lipoprotein lipase (43) and stearoyl CoA desaturase (44) leading to decreased TG 301
uptake by adipocytes. Inhibitory effects of CLA have been documented on preadipocyte 302
differentiation via reduction in the expression of transcription factors regulating adipogenesis, 303
such as PPAR-γ (45). In addition, CLA induces higher fat β-oxidation leading to smaller 304
adipocyte size (46) perhaps by increasing the activity of the rate limiting enzyme, carnitine 305
palmitoyl transferase. We, therefore, investigated if CLA consumption would increase linoleic 306
acid -oxidation in a subset of 10 subjects. Our results failed to support our hypothesis since 307
neither of the two CLA treatments significantly increased cumulative -oxidation. Similar results 308
were observed in a recent study in men and women given 4 g/d of a c9, t11 + t10, c12 CLA 309
mixture (47). Since cumulative -oxidation was unchanged after treatment, the concentration of 310
β-OH in the blood also remained unaffected by treatment. However, it is possible that the low 311
number of subjects may have contributed to the lack of a significant effect. 312
A few studies have reported that CLA supplementation in humans, specifically with the 313
t10, c12 isomer, increases concentrations of CRP, which is a marker of systemic inflammation
314
(22, 48, 49). The current study did not show such an increase in circulating hs-CRP after 8 wk of 315
both CLA treatments in comparison to control. This difference could be due to our use of 316
safflower oil, instead of olive oil as the control, which has been shown to have strong anti-317
oxidative property as well as the ability to lower CRP concentrations (50). It is to be noted that 318
olive oil was used as the control in studies in which CLA supplementation increased circulating 319
CRP concentrations (22, 48, 49). None of the two other serum inflammatory markers analyzed in 320
this study varied upon CLA intake and confirm observations reported in previous clinical trials 321
(13, 48, 49). Taken together with the absence of an influence on blood lipid profile, the lack of an 322
effect on inflammatory markers, and adiponectin concentrations provides further evidence that 323
CLA may have no negative impact on CVD risk. 324
There has been some evidence that CLA increases in vivo oxidant stress status. Ox-LDL, 325
formed by the exposure of LDL to oxidizing agents, is also a widely used marker of in vivo 326
oxidative stress. Ox-LDL particles are known to play a key role in atherosclerosis by being pro-327
inflammatory in nature; their concentrations in plasma have been correlated with the presence of 328
insulin resistance and clinical CVD (51). In the present study, a positive correlation was indeed 329
found between baseline to phase end change in Ox-LDL concentration and change in HOMA 330
index in the study subjects (n=76, r=0.347, p=0.002). However, CLA supplementation for 8 wk 331
did not modify Ox-LDL, suggesting that under the present experimental conditions CLA 332
supplementation does not affect oxidative status in men. 333
The presence of insulin resistance represents an important step in the sequence of events 334
leading to the development of type 2 diabetes. Early studies conducted in animals indicated that 335
CLA can improve insulin sensitivity; however, these results have since been shown to be 336
exclusive to rat models of diabetes (52, 53). In fact, in both mice (19, 20) and men (21), 337
supplementation with a CLA mixture or t10, c12 isomer reportedly resulted in insulin resistance. 338
In our study, 8 wk of supplementation with the two CLA treatments did not modify the HOMA 339
index, a marker used to assess insulin sensitivity. These data suggest that under the current 340
experimental conditions, CLA (c9, t11 isomer and c9, t11 + t10, c12 CLA mixture) appears not to 341
affect glycemic control. 342
In light of the findings from our study, although we did not control the dietary intake of 343
subjects, no changes in body weight or in body composition were observed, suggesting that 344
habitual dietary intake was maintained among the three dietary interventions. Physical activity 345
was maintained as well during the study period (data not shown). Of particular interest in the 346
context of the current study is that there is some evidence that additional physical exercise in 347
conjunction with CLA supplementation could lead to beneficial changes in body composition 348
(54, 55). 349
In conclusion, the present study failed to provide evidence to support the purported anti-350
obesity and anti-CVD effects of CLA, which is in agreement with a substantial number of studies 351
showing that CLA indeed does not impact body weight and body composition, or blood lipid 352
concentrations. However, 8 wk of CLA intake did not alter any of the safety parameters that were 353
tested, supporting the concept that CLA-rich oil supplementation at a dose of 3.5 g/d (2.7-2.8 g/d 354
of CLA isomers) is safe. Overall, the results of this study did not support a role for CLA per se as 355
an effective weight loss nutraceutical for overweight or obese men. 356
ACKNOWLEDGMENTS 357
We are extremely grateful to all the study participants, as well as to the staff of the Richardson 358
Center for Functional Foods and Nutraceuticals. 359
The authors’ responsibilities were as follows: SVJ, HJ, MP, RSM, HMA and PJHJ: 360
responsible for study concept and design; SVJ: responsible for conducting the clinical trial, data 361
collection, sample analyses, data analysis, statistical analysis and writing of the manuscript; HJ 362
and PJHJ: contributed majorly to interpretation of data and preparation of manuscript; MP: 363
responsible for design of fatty acid oxidation study, sample analysis, data analysis, and 364
contributed to writing of the manuscript; RSM: responsible for measurement of plasma lipids 365
and adiponectin; PLM: contributed to data collection. All the authors reviewed the manuscript. 366
The authors have no conflict of interest to declare. 367
LITERATURE CITED
1. James WP. WHO recognition of the global obesity epidemic. Int J Obes (Lond). 2008; 32 (suppl): 120S-6S.
2. Park Y, Albright KJ, Liu W, Storkson JM, Cook ME, Pariza MW. Effect of conjugated linoleic acid on body composition in mice. Lipids. 1997; 32: 853–8.
3. Azain MJ, Hausman DB, Sisk MB, Flatt WP, Jewell DE. Dietary conjugated linoleic acid reduces rat adipose tissue cell size rather than cell number. J Nutr. 2000; 130:1548-54. 4. Ostrowska E, Muralitharan M, Cross R, Bauman D, Dunshea F. Dietary conjugated
linoleic acids increase lean tissue and decrease fat deposition in growing pigs. J Nutr. 1999; 129:2037–42.
5. Bouthegourd JC, Even PC, Gripois D, Tiffon B, Blouquit MF, Roseau S, Lutton C, Tomé D, Martin JC. A CLA mixture prevents body triglyceride accumulation without affecting energy expenditure in Syrian hamsters. J Nutr. 2002; 132:2682-9.
6. Brown JM, McIntosh MK. Conjugated linoleic acid in humans: regulation of adiposity and insulin sensitivity. J Nutr. 2003; 133:3041-6.
7. Miller JR, Siripurkpong P, Hawes J, Majdalawieh A, Ro HS, McLeod RS. The trans-10, cis-12 isomer of conjugated linoleic acid decreases adiponectin assembly by PPARgamma-dependent and PPARgamma-independent mechanisms. J Lipid Res. 2008; 49:550-62.
8. Blankson H, Stakkestad JA, Fagertun H, Thom E, Wadstein J, Gudmundsen O. Conjugated linoleic acid reduces body fat mass in overweight and obese humans. J Nutr. 2000; 130: 2943-8.
9. Gaullier JM, Halse J, Høye K, Kristiansen K, Fagertun H, Vik H, Gudmundsen O. Conjugated linoleic acid supplementation for 1 y reduces body fat mass in healthy overweight humans. Am J Clin Nutr. 2004; 79: 1118-25.
10. Watras AC, Buchholz AC, Close RN, Zhang Z, Schoeller DA. The role of conjugated linoleic acid in reducing body fat and preventing holiday weight gain. Int J Obes (Lond). 2007; 31:481-7.
11. Desroches S, Chouinard PY, Galibois I, Corneau L, Delisle J, Lamarche B, Couture P, Bergeron N. Lack of effect of dietary conjugated linoleic acids naturally incorporated into butter on the lipid profile and body composition of overweight and obese men. Am J Clin Nutr. 2005; 82:309-19.
12. Larsen TM, Toubro S, Gudmundsen O, Astrup A. Conjugated linoleic acid supplementation for 1 y does not prevent weight or body fat regain. Am J Clin Nutr. 2006; 83:606-12.
13. Venkatramanan S, Joseph SV, Chouinard PY, Jacques H, Farnworth ER, Jones PJH. Milk enriched with conjugated linoleic acid fails to alter blood lipids or body composition in moderately overweight, borderline hyperlipidemic individuals. J Am Coll Nutr. 2010; 29:152-9.
14. McLeod RS, LeBlanc AM, Langille MA, Mitchell PL, Currie DL. Conjugated linoleic acids, atherosclerosis, and hepatic very-low-density lipoprotein metabolism. Am J Clin Nutr. 2004; 79 (Suppl):1169S-74S
15. Noone EJ, Roche HM, Nugent AP, Gibney MJ. The effect of dietary supplementation using isomeric blends of conjugated linoleic acid on lipid metabolism in healthy human subjects. Br J Nutr. 2002; 88: 243–51.
16. Tricon S, Burdge GC, Jones EL, Russell JJ, El-Khazen S, Moretti E, Hall WL, Gerry AB, Leake DS, et al. Effects of dairy products naturally enriched with cis-9, trans-11 conjugated linoleic acid on the blood lipid profile in healthy middle-aged men. Am J Clin Nutr. 2006; 83:744-53.
17. Naumann E, Carpentier YA, Saebo A, Lassel TS, Chardigny JM, Sébédio JL, Mensink RP; FunCLA Study Group. Cis-9, trans-11 and trans-10, cis-12 conjugated linoleic acid (CLA) do not affect the plasma lipoprotein profile in moderately overweight subjects with LDL phenotype B. Atherosclerosis. 2006; 188:167-74.
18. Plourde M, Jew S, Cunnane SC, Jones PJ. Conjugated linoleic acids: why the discrepancy between animal and human studies? Nutr Rev. 2008; 66:415-21.
19. Poirier H, Niot I, Clement L, Guerre-Millo M, Besnard P. Development of conjugated linoleic acid (CLA)-mediated lipoatrophic syndrome in the mouse. Biochimie. 2005; 87:73-9.
20. Cooper MH, Miller JR, Mitchell PL, Currie DL, McLeod RS. Conjugated linoleic acid isomers have no effect on atherosclerosis and adverse effects on lipoprotein and liver lipid metabolism in apoE-/- mice fed a high-cholesterol diet. Atherosclerosis. 2008; 200: 294-302.
21. Riserus U, Arner P, Brismar K, Vessby B. Treatment with dietary trans10, cis12 conjugated linoleic acid causes isomer-specific insulin resistance in obese men with the metabolic syndrome. Diabetes Care. 2002; 25:1516-21.
22. Riserus U, Basu S, Jovinge S, Fredrikson GN, Arnlov J, Vessby B. Supplementation with conjugated linoleic acid causes isomer-dependent oxidative stress and elevated C-reactive protein: a potential link to fatty acid-induced insulin resistance. Circulation. 2002; 106:1925-9.
23. Riserus U, Vessby B, Arnlov J, Basu S. Effects of cis-9,trans-11 conjugated linoleic acid supplementation on insulin sensitivity, lipid peroxidation, and proinflammatory markers in obese men. Am J Clin Nutr. 2004; 80:279-83.
24. Basu S, Smedman A, Vessby B. Conjugated linoleic acid induces lipid peroxidation in humans. FEBS Lett. 2000; 468:33-6.
25. Mitchell PL, Langille MA, Currie DL, McLeod RS. Effect of conjugated linoleic acid isomers on lipoproteins and atherosclerosis in the Syrian Golden hamster. Biochim Biophys Acta. 2005; 1734: 269-76.
26. Friedewald WT, Levy RI, Fredrickson DS. Estimation of the concentration of low-density lipoprotein cholesterol in plasma, without use of the preparative ultracentrifuge. Clin Chem. 1972; 18: 499-502.
27. Matthews DR, Hosker JP, Rudenski AS, Naylor BA, Treacher DF, Turner RC. Homeostais model assessment: insulin resistance and β-cell function from fasting plasma glucose and insulin concentrations in man. Diabetologia. 1985; 28:412–9.
28. Richterich R, Dauwalder H. Determination of plasma glucose by hexokinase-glucose-6-phosphate dehydrogenase method. Schweiz Med Wochenscher. 1971; 101: 615–18. 29. Desbuquois B, Aurbach GD. Use of polyethylene glycol to separate free and
antibody-bound peptide hormones in radioimmunoassays. J Clin Endocrinol Metab. 1971; 33:732– 38.
30. Moya-Camarena SY, Belury MA. Species differences in the metabolism and regulation of gene expression by conjugated linoleic acid. Nutr Rev. 1999; 57:336-40.
31. Jones B, Kenward MG. Design and Analysis of Cross-Over Trials. 2nd edition. Chapman & Hall, London. 2003.
32. Tremblay-Mercier J, Tessier D, Plourde M, Fortier M, Lorrain D, Cunnane SC. Bezafibrate mildly stimulates ketogenesis and fatty acid metabolism in hypertriglyceridemic subjects. J Pharmacol Exp Ther. 2010; 334:341-6.
33. National Cholesterol Education Program (NCEP) Expert Panel. Third Report of the National Cholesterol Education Program (NCEP) Expert Panel on Detection, Evaluation, and Treatment of High Blood Cholesterol in Adults (Adult Treatment Panel III) final report. Circulation. 2002; 106:3143–421.
34. Trumbo P, Schlicker S, Yates AA, Poos M. Dietary reference intakes for energy, carbohydrate, fiber, fat, fatty acids, cholesterol, protein and amino acids. J Am Diet Assoc. 2002; 102:1621–30.
35. Ritzenthaler KL, McGuire MK, Falen R, Shultz TD, Dasgupta N, McGuire MA. Estimation of conjugated linoleic acid intake by written dietary assessment methodologies underestimates actual intake evaluated by food duplicate methodology. J Nutr. 2001; 13: 1548-54.
36. Turpeinen AM, Mutanen M, Aro A, Salminen I, Basu S, Palmquist DL, Griinari JM. Bioconversion of vaccenic acid to conjugated linoleic acid in humans. Am J Clin Nutr. 2002; 76:504-10.
37. Taylor JS, Williams SR, Rhys R, James P, Frenneaux MP. Conjugated linoleic acid impairs endothelial function. Arterioscler Thromb Vasc Biol. 2006; 26:307-12.
38. Nazare JA, de la Perrière AB, Bonnet F, Desage M, Peyrat J, Maitrepierre C, Louche-Pelissier C, Bruzeau J, Goudable J, et al. Daily intake of conjugated linoleic acid-enriched yoghurts: effects on energy metabolism and adipose tissue gene expression in healthy subjects. Br J Nutr. 2007; 97:273-80.
39. Whigham LD, Watras AC, Schoeller DA. Efficacy of conjugated linoleic acid for reducing fat mass: a meta-analysis in humans. Am J Clin Nutr. 2007; 85:1203-11.
40. Raff M, Tholstrup T, Toubro S, Bruun JM, Lund P, Straarup EM, Christensen R, Sandberg MB, Mandrup S. Conjugated linoleic acids reduce body fat in healthy postmenopausal women. J Nutr. 2009; 139:1347-52.
41. Norris LE, Collene AL, Asp ML, Hsu JC, Liu LF, Richardson JR, Li D, Bell D, Osei K, et al. Comparison of dietary conjugated linoleic acid with safflower oil on body composition in obese postmenopausal women with type 2 diabetes mellitus. Am J Clin Nutr. 2009; 90:468-76.
42. Gaullier JM, Halse J, Høivik HO, Høye K, Syvertsen C, Nurminiemi M, Hassfeld C, Einerhand A, O'Shea M, et al. Six months supplementation with conjugated linoleic acid induces regional-specific fat mass decreases in overweight and obese. Br J Nutr. 2007; 97:550-60.
43. Zabala A, Churruca I, Fernández-Quintela A, Rodríguez VM, Macarulla MT, Martínez JA, Portillo MP. Trans-10, cis-12 Conjugated linoleic acid inhibits lipoprotein lipase but increases the activity of lipogenic enzymes in adipose tissue from hamsters fed an atherogenic diet. Br J Nutr. 2006; 95:1112-9.
44. Choi Y, Kim YC, Han YB, Park Y, Pariza MW, Ntambi JM. The trans-10, cis-12 isomer of conjugated linoleic acid downregulates stearoyl-CoA desaturase 1 gene expression in 3T3-L1 adipocytes. J Nutr. 2000; 130:1920-4.
45. Granlund L, Juvet LK, Pedersen JI, Nebb HI. Trans10, cis12-conjugated linoleic acid prevents triacylglycerol accumulation in adipocytes by acting as a PPARgamma modulator. J Lipid Res. 2003; 44:1441-52.
46. Evans M, Lin X, Odle J, McIntosh M. Trans-10, cis-12 conjugated linoleic acid increases fatty acid oxidation in 3T3-L1 preadipocytes. J Nutr. 2002; 132:450-5.
47. Close RN, Schoeller DA, Watras AC, Nora EH. Conjugated linoleic acid supplementation alters the 6-mo change in fat oxidation during sleep. Am J Clin Nutr. 2007; 86:797-804. 48. Smedman A, Basu S, Jovinge S, Fredrikson GN, Vessby B. Conjugated linoleic acid
increased C-reactive protein in human subjects. Br J Nutr. 2005; 94:791-5.
49. Tholstrup T, Raff M, Straarup EM, Lund P, Basu S, Bruun JM. An oil mixture with trans-10, cis-12 conjugated linoleic acid increases markers of inflammation and in vivo lipid peroxidation compared with cis-9, trans-11 conjugated linoleic acid in postmenopausal women. J Nutr. 2008; 138:1445-51.
50. El Seweidy MM, El-Swefy SE, Abdallah FR, Hashem RM. Dietary fatty acid unsaturation levels, lipoprotein oxidation and circulating chemokine in experimentally induced atherosclerotic rats. J Pharm Pharmacol. 2005; 57:1467-74.
51. Tsimikas S. Oxidative biomarkers in the diagnosis and prognosis of cardiovascular disease. Am J Cardiol. 2006; 98:9P-17P.
52. Henriksen EJ, Teachey MK, Taylor ZC, Jacob S, Ptock A, Krämer K, Hasselwander O. Isomer-specific actions of conjugated linoleic acid on muscle glucose transport in the obese Zucker rat. Am J Physiol Endocrinol Metab. 2003; 285:E98-E105.
53. Taylor CG, Zahradka P. Dietary conjugated linoleic acid and insulin sensitivity and resistance in rodent models. Am J Clin Nutr. 2004; 79 (Suppl):1164S-8S.
54. Colakoglu S, Colakoglu M, Taneli F, Cetinoz F, Turkmen M. Cumulative effects of conjugated linoleic acid and exercise on endurance development, body composition, serum leptin and insulin levels. J Sports Med Phys Fitness. 2006; 46:570-7.
55. Pinkoski C, Chilibeck PD, Candow DG, Esliger D, Ewaschuk JB, Facci M, Farthing JP, Zello GA. The effects of conjugated linoleic acid supplementation during resistance training. Med Sci Sports Exerc. 2006; 38:339-4.
TABLE 1 Fatty acid composition of Control and CLA treatments1
1 According to certificate of analysis provided by Lipid Nutrition. 2 NA, not available.
Fatty acid
Treatment
Control c9, t11 + t10, c12 CLA c9, t11 CLA Relative area % C14:0 0.1 0 0.1 C16:0 6.7 3.7 4.4 C16:1 cis 0.1 0.1 0.2 C18:0 2.4 2.1 0.8 C18:1 trans 0 0.1 0 C18:1 cis 12.9 10.8 13.5 C18:2 cis 76.3 1.1 1.7 C20:0 0.4 0.3 0 C20:1 cis 0.2 0.2 0 C22:0 0.3 0.2 0
C18:2 all cis, trans 76.3 76.4 76.5
C18:2 cis 9, trans 11 0 37 66.2
C18:2 trans 10, cis 12 0 38.3 8.6
TABLE 2 Baseline characteristics of study population1
1 Values represent means SEM , n=27.
Value
Age, y 44.8 1.5
Weight, kg 96.9 2.9
Body mass index, kg/m2 30.9 0.9 Triglycerides, mmol/L 2.2 0.2 Total Cholesterol, mmol/L 5.7 0.2 LDL-cholesterol, mmol/L 3.6 0.1 HDL-cholesterol, mmol/L 1.1 0.0
TABLE 3 Effect of 8 wk of CLA supplementation on body weight and body composition1
1 Data are presented as means SEM, n=27.
2 P values refer to comparisons between absolute changes from baseline to phase end elicited by experimental treatments (repeated measures ANOVA).
3 Change from baseline to end of phase.
Treatment
P2 Control c9, t11 + t10, c12 CLA c9, t11 CLA
Body weight, kg
Baseline 98.2 3.0 99.0 3.0 98.7 3.0
Phase end 98.9 3.1 99.1 3.1 99.0 3.1
3 0.7 0.4 0.1 0.4 0.3 0.4 0.432
Body mass index, kg/m2
Baseline 31.3 0.8 31.5 0.8 31.4 0.8
Phase end 31.5 0.8 31.5 0.8 31.5 0.8
0.2 0.1 0.0 0.1 0.1 0.1 0.533
Body fat mass, kg
Baseline 34.5 2.2 34.8 2.2 34.9 2.2
Phase end 34.7 2.1 34.8 2.1 34.6 2.1
0.2 0.3 0.0 0.3 -0.3 0.3 0.584
Lean body mass, kg
Baseline 60.1 1.2 60.6 1.2 60.2 1.2
Phase end 60.7 1.3 60.7 1.3 60.8 1.3
TABLE 4 Effect of 8 wk of CLA supplementation on plasma lipid and lipoprotein concentrations1
1 Data are presented as means SEM, n=27. Plasma lipid
Treatment
P2 Control c9, t11 + t10, c12 CLA c9, t11 CLA
mmol/L Total cholesterol Baseline 6.31 0.22 6.26 0.22 6.02 0.22 Endpoint 6.31 0.28 6.04 0.28 6.02 0.28 3 0.00 0.22 -0.22 0.22 0.00 0.22 0.343 Triglycerides Baseline 3.23 0.30 2.87 0.30 2.95 0.28 Endpoint 2.96 0.26 2.68 0.26 2.76 0.26 -0.27 0.16 -0.19 0.12 -0.19 0.12 0.581 VLDL-cholesterol Baseline 1.16 0.15 1.13 0.15 1.14 0.15 Endpoint 0.69 0.09 0.84 0.09 0.86 0.09 -0.46 0.14 -0.29 0.14 -0.28 0.14 0.515 LDL-cholesterol Baseline 2.28 0.16 2.44 0.16 2.32 0.16 Endpoint 2.24 0.13 2.27 0.13 2.21 0.13 -0.04 0.12 -0.17 0.12 -0.11 0.12 0.728 HDL-cholesterol Baseline 0.54 0.05 0.57 0.05 0.55 0.05 Endpoint 0.49 0.04 0.48 0.04 0.50 0.04 -0.05 0.05 -0.09 0.05 -0.05 0.05 0.597
2 P values refer to comparisons between absolute changes from baseline to phase end elicited by experimental treatments (repeated measures ANOVA).
TABLE 5 Phase-end anthropometric and fasting plasma measures of a subset of participants1
1 Data are presented as means SEM, n=10.
2 P values refer to comparisons between changes elicited by experimental treatments at end of phases only (repeated measures ANOVA).
Treatment
P2 Control c9, t11 + t10, c12 CLA c9, t11 CLA
BMI, kg/m² 29.5 ± 1.4 30.1 ± 1.6 29.9 ± 1.6 0.269
Fat mass, % 34.5 ± 1.8 35.1 ± 2.2 34.8 ± 2.5 0.798
Lean mass, % 65.5 ± 1.8 64.9 ± 2.2 65.3 ± 2.5 0.798
Triglycerides, mmol/L 1.8 ± 0.4 1.8 ± 0.4 1.9 ± 0.3 0.731
Total cholesterol, mmol/L 5.9 ± 0.4 5.6 ± 0.4 6.0 ± 0.3 0.190
Glucose, mmol/L 5.6 ± 0.2 5.4 ± 0.2 5.7 ± 0.1 0.212
FFA, mmol/L 0.37 ± 0.02 0.43 ± 0.03 0.36 ± 0.04 0.305
TABLE 6 Effect of 8 wk of CLA supplementation on plasma markers of insulin sensitivity and inflammation1
1 Data are presented as means SEM, n=27; except for HOMA-IR, n=26.
2 P values refer to comparisons between absolute changes from baseline to phase end elicited by experimental treatments (repeated measures ANOVA).
3 Change from baseline to end of phase.
Treatment
P2
Control c9, t11 + t10, c12 CLA c9, t11 CLA
hs-CRP, mg/L Baseline 1.89 ± 0.29 2.17 ± 0.33 2.21 ± 0.45 Phase end 2.01 ± 0.50 2.35 ± 0.43 3.14 ± 0.96 3 0.12 ± 0.41 0.18 ± 0.31 0.96 ± 0.58 0.559 TNF-α, pg/mL Baseline 1.63 ± 0.19 1.38 ± 0.17 1.32 ± 0.11 Phase end 1.35 ± 0.21 1.38 ± 0.19 1.48 ± 0.19 -0.28 ± 0.19 -0.0 ± 0.14 0.16 ± 0.15 0.087 IL-6, pg/mL Baseline 1.15 ± 0.20 1.40 ± 0.25 1.32 ± 0.18 Phase end 1.29 ± 0.26 1.05 ± 0.17 1.32 ± 0.22 0.14 ± 0.13 -0.35 ± 0.15 0.00 ± 0.18 0.159 HOMA-IR Baseline 4.6 ± 0.7 4.1 ± 0.4 4.7 ± 0.8 Phase end 4.0 ± 0.5 3.8 ± 0.5 4.6 ± 0.6 -0.6 ± 0.4 -0.3 ± 0.3 -0.1 ± 0.8 0.208 Adiponectin, pg/mL Baseline 12.1 ± 1.2 12.3 ± 1.1 12.3 ±1.3 Phase end 12.1 ± 1.2 11.5 ± 1.0 11.8 ± 1.2 0.0 ± 0.5 -0.8 ± 0.7 -0.5 ± 0.3 0.840
FIGURE LEGENDS
FIGURE 1 Cumulative oxidation of 13C linoleate over 24 h following 8 wk of experimental treatments. Data represent means ± SEM, n=10. Repeated measures ANOVA was used to analyze data at the end of phases only; overall P=0.28.
FIGURE 2 Concentration of plasma oxidized-LDL following 8 wk of experimental treatments. Bars represent means ± SEM, n=27. Repeated measures ANOVA was used to compare absolute changes from baseline to end of phase elicited by the experimental treatments; overall P=0.61.