Bose-Einstein Correlations in 14.6 A. GeV/c
Si + Au - 2K
+
+ X Central Collisions
by
Vincent Cianciolo
B.S. University of Michigan, Ann Arbor (1988)
Submitted to the Department of Physics
in partial fulfillment of the requirements for the degree of
Doctor of Philosophy
at the
MASSACHUSETTS INSTITUTE OF TECHNOLOGY
May 1994
©
Vincent Cianciolo, 1994. All rights reserved.
The author hereby grants to MIT permission to reproduce and
to distribute copies of this thesis document in whole or in part.
Author
...
;
...
Department of Physics
May 9, 1994
Certified by...
George Sj F. Stephans
Principal Research Scientist, Laboratory for Nuclear Science
Thesis Supervisor
Certified by...
.. . ...Wit Busza
Professor, Department of Physics
Thesis Co-supervisor
Accepted by ...
... ...,George Koster
Chairman, Physics Graduate Committee
MASSACHSUr INSTITUT OF TFrUAr. ,n
Bose-Einstein Correlations in 14.6A. GeV/c
Si + Au
-
2K
++ X Central Collisions
by
Vincent Cianciolo
Submitted to the Department of Physics on May 10, 1994, in partial fulfillment of the
requirements for the degree of Doctor of Philosophy
Abstract
This thesis presents a comparison of the Bose-Einstein correlations of Z 50,000 K+K+ pairs and , 110,000 7r+ r+ pairs created in 14.6 A. GeV/c 28Si + 97Au central collisions.
Bose-Einstein correlations of K+K+ and wr7r+ pairs are complementary probes of the space-time size and the dynamics of the baryon-rich matter created in central heavy ion collisions at the AGS. This is the first Bose-Einstein correlation analysis of K+K+ pairs created in heavy ion collisions.
This measurement was taken by the E802 collaboration, as a part of BNL AGS experiment E859. Data were collected with a magnetic spectrometer enhanced by a second level trigger with 40/sec online particle identification capability. Spectrometer angles were chosen to optimize acceptance overlap for the two species. Centrality was determined by a hardware trigger on the total charged particle multiplicity.
Several different 1-, 2- and 3-dimensional analyses have been performed for both species. The K+ source parameters are observed to be at least 50% smaller than the xr+source
param-eters in every source parameterization tested. The duration of K+ emission may be extremely small. The K+ source parameters are consistent with the size of the 2 Si projectile. The r+
source parameters are consistent with other measurements using the same apparatus. Both the
r+ and K+ sources appear oblate with the major axis (perpendicular to the beam) - 25% larger than the minor axis (parallel to the beam). Cuts were made on the average pair momentum
((pPa is)).
With
increasing (pPGit), thereis
an observed trend towards decreasing source-size parameters, and decreasing chaoticity parameter. Cuts were also made on the single-particle rapidity for the r+'s. Results from this cut unambiguously show dynamical correlations. Many systematic errors on the extracted source parameters were examined. Systematic uncertainty on the various parameters is estimated to be 5-10%, comparable to the statistical uncertainty.The data have been compared to the RQMD model. Bose-Einstein correlations are incor-porated into the model post hoc, using a semi-classical formalism developed by Pratt. RQMD correlation functions are consistent with the data. An examination of the space-time distribu-tion of the RQMD source reveals the sensitivity of the technique to the collision dynamics.
Thesis Supervisor: George S. F. Stephans
Title: Principal Research Scientist, Laboratory for Nuclear Science
Thesis Co-supervisor: Wit Busza Title: Professor, Department of Physics
I prefer the errors of enthusiasm to the indifference of wisdom.
Contents
1 Introduction
1. 1 QCD and the Elusive QGP Phase Transition ... 1.2 Motivations for this Measurement ... 1.3 Other Kaon Correlation Measurements ...
1.3.1 Cooper et al ... 1.3.2 Akesson et al ... 1.3.3 E802 Kaon Correlations ... 1.3.4 NA44 Kaon Correlations ... 1.4 Identical Particle Interferometry Basics ...
1.5 Relative Momentum Variables ... 1.6 Source Parameterizations ...
2 Experimental Apparatus
2.1 E859 - An Overview ... 2.2 Heavy Ion Acceleration at the AGS. 2.3 Coordinate Systems ... 2.4 Target Assembly ... 2.5 Beam Counters ...
2.6 Target Multiplicity Array (TMA) ...
2.7 FO ...
2.8 Tracking Chambers (T1-4) ... 2.8.1 Design Considerations ... 2.8.2 Design Decisions ... 2.8.3 Improvements for E859 ... 2.9 Henry Higgins ... 21 22 24 28 29 29 31 34 36 42 44 51 51 55 57 59 59 61 62 62 64 64 69 72
...
...
...
...
...
...
...
...
...
...
...
...
...
...
...
...
...
...
...
...
...
...
...
...
...
...
...
...
...
...
...
...
...
...
...
...
...
...
...
...
...
...
...
...
...
...
...
...
...
...
...
...
...
...
...
...
2.10 Trigger Chambers (TR1, TR2) ... 2.11 Time-of Flight Wall (TOFW) ... 2.12 Gas Cerenkov (GASC) and BACK Counter ... 2.13 Data Acquisition System and Trigger Supervisor . 2.14 Triggering ...
2.14.1 BEAM and INT Triggers ....
2.14.2 TMA Trigger ...
2.14.3 SPEC Trigger ...
2.14.4 Second Level Trigger (LVL2).
Motivation
...
Rejection
Factors...
Design Decisions ... The Basic Idea ... The Trigger Modules ...
LVL2 Operation ...
3 Collaboration Software
3.1 LVL2 Software ... 3.1.1 INTER ... 3.1.2 LVL2 Database ... 3.1.3 Lookup Table Generation ... 3.1.4 LVL2 TOFW Calibration ... 3.1.5 BNL802 and BNL859 Communication ... 3.1.6 Trigger Control ... 3.1.7 Trigger Exercisers ... 3.1.8 LVL2 Monitor ... 3.1.9 Trigger Emulation ..
3.2 Beam Counter Calibration 3.3 TMA Calibration ...
3.4 Henry Higgins Calibration . 3.5 Drift Chamber Calibration .
3.5.1 Georgeometry ...
3.5.2 Timing...
3.6 TOFW Calibrations ...CONTENTS
72 73 74 75 79 80 82 82 83 83 84 87 88 90 96 105 106 107 107 107 110 110 111 111 112...
113
...
113
...
114
...
115
115 115 116 117...
...
...
...
...
...
...
...
...
...
...
...
...
...
...
...
...
...
...
...
...
...
...
...
...
...
...
...
...
...
...
...
...
...
...
...
...
...
...
...
...
...
...
...
...
...
...
...
...
...
...
...
...
...
...
...
...
...
...
...
...
...
...
...
...
...
...
...
...
...
...
...
...
...
...
...
.. . . .3.6.1 3.6.2
Calibration Sets ...
ADC Calibration ...
3.6.3 Timing Calibration (PIDTCAL) ... 3.6.4 The Slewing Correction ... 3.7 AUSCON ...
3.7.1 Reconstruction Basics ...
3.7.2 Data Structures ...
3.7.3 The AUSCON Algorithm ... T3T4 Reconstruction ...
Track Projection through the Magnet ...
T1T2 Reconstruction ... 3.8 PICD ...
3.8.1 Particle Identification Basics ... 3.8.2 The PICD Algorithm ...
TOF Energy Loss ...
TOF PID ...
...
GASC and BACK PID ... PICD Decisions ... 3.9 E859 Monte Carlo ...
3.9.1 GEANT ... 3.9.2 ZYBATCH ...
4 Correlation Analysis
4.1 HBT Analysis Environment ...
4.2 Actual Distributions ...
4.2.1 BTOF, INTPRE and INTFOL Cuts ... 4.2.2 TOFID ...
4.2.3 TR1.TR2 Cut ... 4.2.4 A-Slat Cut ...
4.2.5 Scale Angle Cut, Two-Particle Acceptance Correction 4.2.6 TMA Cut ... 4.2.7 GASC Cut ...
4.2.8 Rapidity Cut ...
...
4.2.9 (pPair)
Cut ...
.. .. .. . .. .. .. .... . ... .. . .. .. .. . . . . .. . . . ....
...
.. .. .. .. . .. ... . .. .(TPAC) ...
... . .. .. .. .... . . .. . .... .. ... . .. . . . . .. . . . . . . . .CONTENTS
117 119 119 120 122 122 124 128 129 133 139 140 140 141 142 142 145 147 148 152 154 157 157 159 159 163 164 164 164 170 171 171 175...
...
...
...
...
...
...
...
...
...
...
...
...
...
...
...
...
...
...
...
4.3 Background Distributions ...
4.3.1 Random vs Serial Sampling ...
4.3.2 Fluctuations ...
4.3.3 Repeating Pairs ... 4.3.4 Pair Selection ... 4.3.5 Gamow Correction ... 4.3.6 Residual Correlations ... 4.4 Relative Momentum Acceptances ...
4.5 Fitting ...
5 Results
6 Bose-Einstein Correlations in Models
6.1 The Pratt Wigner Density Function Technique. 6.1.1 Derivation and Justification ... 6.1.2 The Algorithm ... 6.1.3 Impact Parameter Selection ... 6.2 E859 Spectrometer Response Function (Rp) ....
6.2.1 Rp Monte Carlo Data Set ... 6.2.2
Rp
Parameterization ... 6.2.3 Rp Results ... 6.2.4 Spectrometer Efficiency ... 6.3 RQMD ... 6.3.1 RQMD Data Sets ... 6.3.2 RQMD Results ...7 Conclusions
A Systematic Studies
B Residual Correlations
C Lorentz Extensions in E859
D Data Structures
E E859 Detectors Not Used in this Analysis
E. 1 Zero-Degree Calorimeter (ZCAL) ...
CONTENTS
175 178 179 181 181 181 181 183 183 199 231 232 232 235 236 237 238 239 242 244 244 248 249 263 267 281 295 301 307 307...
...
...
...
...
...
...
...
...
...
...
...
...
...
...
...
...
...
...
...
...
...
...
...
CONTENTS
E.2 Lead Glass Array ... . 308 E.3 Phoswhich Array (PHOS) ... 311 E.4 erenkov Complex (CC) ... 311
List of Tables
1.1 List of long-lived resonances contributing to pion production ... 1.2 Comparison of kaon and pion source parameters in po collisions. ... 1.3 NA44 pion and kaon source parameters ...
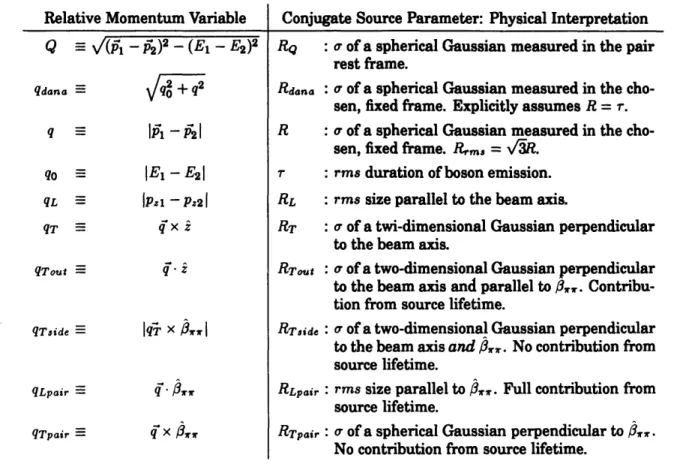
1.4 Definition of relative momentum variables and rough physical interpretations.
2.1 List of E859 drift chamber properties ...
2.2 GAS6 momentum thresholds for different mass particles ... 2.3 LVL2 rejection factors under different experimental conditions ... 2.4 LVL2 trigger signal acronyms ...
2.5 Information stored in the LVL2 diagnostic Data Stacks ...
3.1 Parameter values used for PID at B = 4 kG. ...
4.1 Names and purposes of cuts defining a good event for the standard data sets... 4.2 Names and purposes of non-standard cuts ...
4.3 Number of pairs in different r+ r+ Actual data sets. ...
4.4 4.5 4.6 4.7 4.8 4.9 28 29 34 42 65 75 86 96 103 145 160 160 161
Number of pairs in different K+K+Actual data sets ... 161
Two-Particle Acceptance Correction parameters ... 168
Minimum TMA values applied in ultra-central tests. ... 171
Number of pairs in different r+ r+ Background data sets. ... 177
Number of pairs in different K+K+ Background data sets. ... 177
Comparison of pairs used in serial and random mixing techniques ... 179
5.1 Q fit results for the standard data sets ... 200
5.2
qdanafit results for the standard data sets ...
200
5.3
qLqTfit results for the standard data sets ...
5.4 qoq fit results for the standard data sets ...
200 200
LIST OF TABLES
5.5 qLqTsideqTout fit results for the standard data sets ... 200
5.6
qLqTqofit results for the standard data sets. ...
200
5.7 Koonin fit results for the standard data sets, fit at y = 1.25 ... 200
5.8 qLpairqTpairqO fit results for the standard data sets. ... 200
5.9 Comparison of radius parameters extracted from the qoq and qLqTqo
parame-terizations ...
...
209
5.10 Rapidity dependence of fits to the Koonin parameterization. ... 217
5.11 qLqT fit results for the different r+ 7+ (pPal') data sets. ... 219
5.12
qoqfit results for the different xr++
(pair)data sets
...219
5.13
qLqTfit results for the different K+K
+ (ppair)data sets
...219
5.14 qoq fit results for the different K+K+ (ppair) data sets. ... 219
5.15 qqT fit results for different rapidity slices of the r+7r+ data set ... 222
6.1 'Rp fit parameters ... 239
6.2 Spectrometer materials list ... 243
6.3 Number of pairs in different RQMD data sets. ... 249
6.4 Number of particles in different RQMD data sets ... 249
6.5 Comparison of RQMD correlation function predictions versus E859 results... 254
A. 1 Q systematic study results for the r+ r+ data set. ... 270
A.2 Q systematic study results for the K+K+ data set ... 275
C. 1 Summary of input and output parameters for the Lorentz conversion Monte Carlo calculation ... 299
D. 1 HBT-Stream RUNKEY variables ... 302
D.2 HBT-Stream EVTKEY variables. ... 302
D.3 HBT-Stream PARKEY variables. ... 303
D.4 HBT-Stream SGLKEY variables. ... 304
List of Figures
1-1 Schematic nuclear matter phase diagram ... 23
1-2 Utot for K+p and
ir+p,
as a function of Ecm of the collision ... 261-3 K*(892) opening angle distribution as a function of momentum. ... 27
1-4 Relative momentum phase-space distributions, from [C+78] ... 30
1-5 C2 (qTpair; qLpair < 0.30 GeV/c) for charged kaons, from [A+85] ... 31
1-6 (nch) dependence of kaon and pion source radii from [A+85]. ... 32
1-7 E802 K+K+ correlation function. ... 33
1-8 NA44 K+ K + correlation function ... 35
1-9 Schematic of the particle source used to derive intensity interferometry ... 36
1-10 Comparison of the measured r+7r+ correlation function to the predictions of spherical Gaussian, spherical shell and hard sphere parameterizations ... 39
1-11 Illustration of relative momentum projections ... 45
1-12 ippair · T for 7r+'s (open symbols) and K+'s (filled symbols). ... 49
2-1 Schematic of the E859 experimental apparatus ... 53
2-2 Available E859 spectrometer coverage. ... 54
2-3 Schematic of the AGS high current heavy ion sputter source ... 55
2-4 Schematic of the pre-AGS acceleration system ... 56
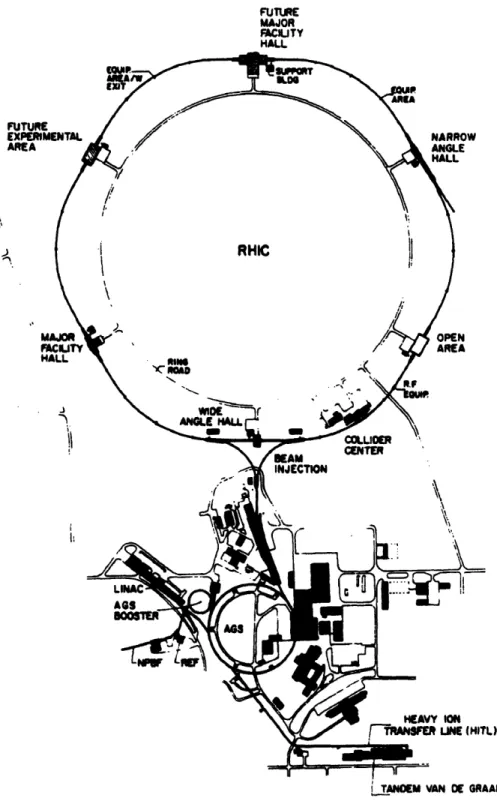
2-5 Aerial view of the BNL heavy ion acceleration facility. ... 58
2-6 Schematic of the E859 beam counter detectors ... 60
2-7 Schematic of BTOF orientation and readout ... 60
2-8 Schematic of the E859 beam counter holders. ... 61
2-9 Schematic of the TMA during a central 2 8Si + l9 7Au event ... 63
2-10 Illustration of projective geometry and the left-right ambiguity ... 66
2-11 Illustation of wire 'staggering" to resolve the left-right ambiguity. ... 66 2-12 Illustration of the crimping technique used to construct the MIT drift chambers. 67
LIST OF FIGURES
2-13 Typical pulse-width distribution for the E859 drift chambers. ... 2-14 Circuit diagrams of the MIT drift chamber electronics ...
2-15 Illustration of the machining error complicating the geometry description of
the T2 drift chamber. ...
2-16 Schematic of the E859 data acquisition system. ...
2-17 Electronic diagram of the first level trigger inputs to the E859 trigger supervisor 2-18 Beam counter trigger logic diagram ...
2-19 Timing diagram of LeCroy ECLine input and output signals ... 2-20 LVL2 trigger flow chart ...
2-21 Timing diagram of the 2738 control signals ... 2-22 LeCroy Model #4303 TFC response and dynamic range ... 2-23 LVL2 electronics diagram ...
2-24 Geographical block diagram of the LVL2 trigger electronics ...
68 70 71 76 78
...
81
...
88
...
89
...
92
...
94
...
97
...
98
3-1 Illustration of MLU interrogation ... 109
3-2 Illustration of the TOF slewing effect ... 121
3-3 A typical example of a "connect-the-dots" puzzle ... 123
3-4 Plan view of the Henry Higgins spectrometer ... 125
3-5 Gravity view of the Henry Higgins spectrometer ... 126
3-6 Beam's eye views of the four drift chambers. ... 127
3-7 First half of the AUSCON algorithmic flow chart. ...
130
3-8 Second half of the AUSCON algorithmic flow chart. ... 131
3-9 Geometry of the effective edge approximation. ... 135
3-10 Shematic of Henry Higgins' fringe fields. ... 137
3-11 Aflow chart of the PICD algorithm ... 143
3-12 Relative contributions to o (1/0f) ... 146
3-13 Plot of different particle identification regions in (1/f,) vs p. ... 149
3-14 Illustration of a Monte Carlo area calculation. ... 150
3-15 Illustration of the role of the experimental Monte Carlo simulation ... 4-1 BTOF spectrum for K+K+ events ... 4-2 Illustration of the PID decisions used in this analysis. ... 4-3 Correlation function for non-identical particles showing close pair inefficiency.. 4-4 TPAC 16xl < 0.6cm and lyl < 0.6cm slices ...6
151 162 165 167 169
LIST OF FIGURES
4-5 TMA distribution for INT triggers and TMA triggers for sample runs in the
three run periods. ...
172
4-6 TMA distributions for different pair data sets. ... 173
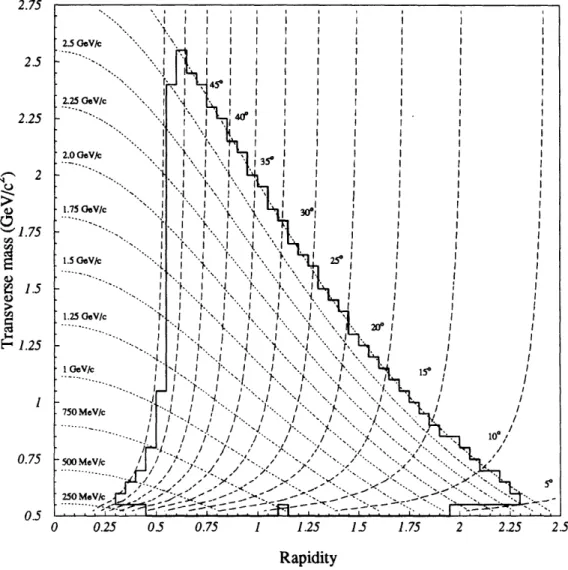
4-7 y vs p. phase space for pions and kaons in the standard data sets ... 174
4-8 Illustration of different (ppair) bins used to study (pPai)-dependence of the extracted source parameters ... 176
4-9 Illustration of the super-Poisson box model extended to a relative momentum-like geometry ... 180
4-10 Observed Background compared to Poisson and box-model predictions ... 182
4-11 Illustration of E859 1D (Q, qdana) and 2D (qo vs q, qT vs qL), phase space for pions. 184 4-12 Illustration of E859 1D (Q, qd.an) and 2D (qO vs q,qT vs qL), phase space for kaons ... 185
4-13 Illustration of E859 (qL VS qT VS qgo) phase space for pions ... 186
4-14 Illustration of E859 (qL vs qT vs qo) phase space for kaons. ... 187
4-15 Illustration of E859 (qL VS qTside VS qTout) phase space for pions ... 188
4-16 Illustration of E859 (qL VS qTside VS qTout) phase space for kaons ... 189
4-17 Illustration of E859 (qLpair VS qTpair VS qo) phase space for pions ... 190
4-18 Illustration of E859 (qLpair VS qTpair VS q) phase space for kaons ... 191
4-19 Illustration of E859 (qo vs qL VS Q) phase space for pions. ... 192
4-20 Illustration of E859 (qo vs qL vs Q) phase space for kaons ... 193
5-1 Summary of source-size fit results for all source parameterizations of the
stan-dard data sets ...
201
5-2 Summary of A fit results for all source parameterizations of the standard data sets ... 202
5-3 Plots of the 1D (Q, qd.an) parameterizations of the standard K+K+ and
r+r+
data sets ...
203
5-4 Low relative momentum slices of the qoq parameterization of the standard K+K+ and r+ r+ data sets ... 205
5-5 Low relative momentum slices of the qLqT parameterization of the standard
r+r+ data set. ...
206
5-6 Low relative momentum slices of the qLqT parameterization of the standard K+K+ data set ... 207
LIST OF FIGURES
5-7 Confidence contours for the qq and qLqT parameterizations of the standard
K
+ K +and + r
+data sets ...
208
5-8 Low relative momentum slices of the qLqTqO parameterization of the standard lr++
data set ...
210
5-9 Low relative momentum slices of the qLqTqO parameterization of the standard K+K+ data set ... 211
5-10 Low relative momentum slices of the qLqTaideqTout parameterization of the
standard r
+r+ data set ...
213
5-11 Low relative momentum slices of the qLqTsideqTout parameterization of the
standard K
+K
+data set ...
214
5-12 Low relative momentum slices of the qLpairqTpairqo parameterization of the standard 7r+ r+ data set. ... 215
5-13 Low relative momentum slices of the qLpairqTpairqO parameterization of the
standard K+K
+data set ...
216
5-14 Confidence contours for the qoq and qLqT parameterizations of the different (pPar) r+ r+
data sets
...
2...
220
5-15 Confidence contours for the qoq and qLqT parameterizations of the different (p"'ir) K+K+ data sets ... 221
5-16 Relative momentum distributions of x2for the 1D and 2D fit parameterizations of the standard 7r+ r+ data set ... 224
5-17 Relative momentum distributions of x2for the 1D and 2D fit parameterizations of the standard K+K+ data set. ... 225
5-18 Normalized binwise deviation distributions for all source parameterizations of
the standard
+
+r
data set ...
226
5-19 Normalized binwise deviation distributions for all source parameterizations of
the standard K
+K
+data set. ...
227
6-1 Rp parameterization results ... 240
6-2 Correlation function modification due to Rp ... 245
6-3 Correlation function modification due to artificially worsened Rp ... 246
6-4 Parameterized AUSCON efficiencies for pions and kaons ... 247
6-5 Comparison of E859 and RQMD correlation functions for r+r+ and K+K+ (Q
parameterization) ...
251
LIST OF FIGURES
6-6 Comparison ofE859 and RQMD correlation functions for 7r++ and K+K+ (qoq
and qLqT parameterization) ... 244
6-7 Comparison of final-state spatial distributions for 7r+'s and K+'s produced by RQMD ... 246
6-8 Correlation between the produced position and momentum directions of RQMD K+'s and 7r+'s ... 247
6-9 Schematic diagram of the origin of the observed dynamical correlations ... 248
6-10 Comparison of final-state spatial distributions for 7r+'s and K+'s produced by RQMD in the E859 acceptance. ... 249
6-11 Comparison of final-state spatial separations for 7r+and K+pairs produced by RQMD in the E859 acceptance. ... 251
6-12 Projections of the rms separation of RQMD 7r+'s and K+'s, in the E859 accep-tance, as a function of the conjugate relative momentum variable. ... 252
6-13 Projections of the rms separation of all RQMD r+'s and K+'s, as a function of the conjugate relative momentum variable ... 253
A-1 Range of source-size parameter values obtained in the different systematic
tests performed ...
260
A-2 Range of chaoticity parameter values obtained in the different systematic tests
performed
. ... ...
261
A-3 Gamow correction for the standard 7r+r+ data set, binned in different relative momentum variables ... 26... 263
A-4 Gamow correction for the standard K+K+ data set, binned in different relative momentum variables ... 264
A-5 TPAC correction for the standard 7r+ r+ data set, binned in different relative momentum variables ... 265
A-6 TPAC correction for the standard K+K+ data set, binned in different relative momentum variables ... 266
A-7 Electron contamination of pions ... 268
A-8 Contamination of K+'s by 7+'s and protons ... 269
A-9 6(1/P)/(1/f/) vs p for all particles, assuming a kaon mass hypothesis ... 270
A-10 Ratio of PICD identified K+'s to noise ... 271
B-1 Distribution of individual-pair residual correlation weights for the Q, qoq, and qLqT
parameterizations
...279
LIST OF FIGURES
B-2 Distribution of individual-pair residual correlation weight uncertainties for the
Q, q0q, and qLqT parameterizations ... 288
B-3 Distribution of residual correlation weights for arbitrary bins of the Q, q0q, and
qLqT parameterizations ... 289 B-4 Distributions of six iterations of the relative change in the residual correlation
weights for the Q-parameterization ... 290 B-5 Ratios of C2itcr=s : C2iter=O and C2iter=6 :C 2itr' = for the examined source
parameterizations ... 291 B-6 Ratios of correlation functions for the examined source parameterizations when
residual correlation function weights are calculated from different source
pa-rameterizations ... 292 B-7 Plot of the cumulative change in extracted source parameters, for the examined
source parameterizations, as a function of residual correlation iteration number. 293
C-1 Calibration of RQ Lorentz transformation properties in the E859 acceptance. .. 297 C-2 Distributions of y,,i, for pions and kaons in the E859 acceptance ... 298
E-1 ZCAL response as a function of nucleon number, A ... 308 E-2 Ekbi,, measured by the ZCAL, as a function of the instantaneous beam rate. 309 E-3 Response of TMA vs ZCAL in 28Si + 97Au collisions ... 310 E-4 Schematic of the PBGL CsI(Tl)/24'Am calibration modules ... 311
Chapter 1
Introduction
The goal of the research described in this thesis was to probe the hot, baryon-rich matter created in relativistic heavy ion collisions. The technique employed was the Bose-Einstein correlations of positive kaons (K+'s).
This Introduction chapter presents an overview of the theoretical motivations for the study
of relativistic heavy ion collisions, and briefly discusses the state of the field. The motivations
for the specific measurement made in this thesis are outlined, and the former and current
measurements of K+K+ Einstein correlations are reviewed. Finally, the basics of
Bose-Einstein correlation measurements are reviewed and their contribution to our understanding
of heavy ion collisions is discussed. Chapter 2, Experimental Apparatus, describes the battery of detectors that were needed to collect the data used in this analysis. Chapter 3, Collaboration
Software, outlines all of the standard analysis programs used to convert raw information (e.g.,
ADC and TDC channels) into interesting information (i.e., identified particles). Chapter 4,
Correlation Analysis, details all of the steps needed to extract a Bose-Einstein correlation
mea-surement from identified particles. Chapter 5, Results, summarizes all of the results of the Bose-Einstein correlation analysis of the spectrometer data. Chapter 6, Bose-Einstein
Corre-lations in Models, lists the different types of phenomenological models that are used to try to
understand complicated heavy ion collisions. The post hoc imposition of Bose-Einstein correla-tions on one particular model, RQMD, are discussed. Results are compared to data. Chapter 7,
Conclusions, will summarize the lessons learned in this analysis. Various appendices examine
CHAPTER 1. INTRODUCTION
1.1 QCD and the Elusive QGP Phase Transition
It must be acknowledged that, without hope of observing the Quark Gluon Plasma (QGP), relativistic heavy ion collision research would probably not be the burgeoning field it is today. More than 500 physicists world-wide have joined this quest in the eight years since relativistic heavy ion beams were first accelerated at the BNL AGS and the CERN SPS. But, it is this author's strongly held opinion, that if the QGP is the only discovery made in the course of relativistic heavy ion research, it will be a very sterile quest.
Using the metaphor of the quest, we need to take our eyes off the horizon, and stop and smell
the roses. After all, we are creating, in the laboratory, matter at temperatures and densities
that may not have existed since microseconds after the Big Bang. Making our immediate goal the careful characterization of this matter will have important, beneficial, psychological consequences. In addition, since nature has always been surprising, we will probably make all sorts of discoveries that we did not expect.
In the field theory of the strong force, Quantum ChromoDynamics (QCD), different values of the strong charge are known as 'color." Quarks carry color, anti-quarks carry anti-color, and gluons carry both. Despite many experimental searches, a free quark has never been found. Rather, all known objects are color-singlet combinations of a quark-anti-quark pair (mesons) or three (anti-)quarks ((anti-)baryons). This phenomenon is known as color confinement." Inside a QGP, the QCD binding potential is Debye screened, and the color-singlet restriction is removed.
The existence of the phase transition to a QGP can be motivated on very general grounds. At some temperature, the energy will be larger than the quark-quark binding energy. At some density, the color-bound objects will overlap, and the multitude of color charges will screen the long-range binding potential. If one could compress a nucleus to several times the density of an individual nucleon, then the individual nucleons would overlap. Under these conditions, it seems intuitive that the picture of nucleons as three isolated quarks would break down. Jaffe has argued that it does not really matter if the hadrons overlap, the quark-quark bonds must be broken [JafJ. He suggests that the figure of merit for a critical density is more accurately phrased in terms of the density for which the Fermi energy is great enough to drive the reaction p + p -- p + A. The minimum momentum of the two incoming protons in this reaction is p,mi. = 545MeV/c. This gives us a critical density Pc = 8.95po, where po = 0.17fm-3, is the
density of normal nuclear matter.
1.1. QCD AND THE ELUSIVE QGP PHASE TRANSITION
distances), the strong coupling constant becomes so large that perturbation theory becomes impossible. The only currently available alternative is lattice QCD. Interest in the QGP stems from the prediction by lattice QCD that a QGP is formed at a critical temperature of 200MeV and a critical density of 5-10 po [Muil85, and references therein]. In much the same way that the solution to a textbook problem often becomes clear when the answer is known, verification of the predicted transition (and any other discoveries made along the way) may provide important guidance in the construction of a calculable theory of the strong force.
Heavy ion collisions are thought to be the most promising means of producing the QGP. They are expected to produce extreme conditions of temperature and density over relatively long times and in relatively large volumes. Under these conditions, it is hoped that thermalization will occur, and that we will be able to see macroscopic evidence of the phase transition. The conditions predicted to be necessary to create the QGP are indicated on the schematic nuclear matter phase diagram, shown in figure 1-1. At the AGS, we believe we are creating nuclear matter in the lower right corner of this figure.
T
NOE)
200
ion
5
d/d
Figure 1-1: Schematic nuclear matter phase diagram [Jac89]. The density, d, is given in units of normal nuclear matter density, do.
When the results of relativistic heavy ion collisions came under theoretical scrutiny, naive hopes for easy observation of the QGP were dashed. It was discovered that many of the proposed
CHAPTER 1. INTRODUCTION
signatures for QGP production were also signatures for hot, dense nuclear matter without QGP formation. As a result, even though many of the signatures have been observed, there is no conclusive evidence for QGP formation.
Suppression of the J/'I (and other qq resonances) is one proposed signature of QGP forma-tion. The physical picture is that color screening inside the plasma will reduce the cc attractive potential, making it more likely that these quarks will combine with light quarks to form D mesons. In hot hadronic matter, the observed number of Ji/'s is reduced by absorption.
Enhanced strangeness production has been proposed as a signature of QGP formation. In a plasma, it takes 300 MeV (twice the strange quark mass) to create s pairs. In a hadronic gas, where we are forced to produce color singlets, it takes 1000MeV (twice the kaon mass) to produce an ss pair. If, as expected, the QGP is accompanied by chiral restoration, the strange quark mass is reduced to 150 MeV, and strangeness production is further enhanced. However, cascade codes, with no QGP formation, are nearly able to reproduce the observed enhancement [Mor94].
If a QGP is created, the transition into a colored state vastly increases the number of degrees of freedom (37/3) [Mi185]. Before the QGP can hadronize into color singlet states, it must expand so that hadronization does not decrease the entropy density. This expansion may be observable in Bose-Einstein correlations, which are sensitive to the space-time extent of the produced particles [Ber89, Pra86, Pra92].
I will not keep the reader in suspense - we have seen no evidence for QGP production. But, we have made a world-class measurement, and learned a lot about the richness and limits of Bose-Einstein measurements of relativistic heavy ion collisions.
1.2 Motivations for this Measurement
I would characterize the original motivation of the E802 collaboration (and of the author) for making the K+ correlation measurement as a healthy mix of adventure and ambition. There was a palpable sense of exploring uncharted territory. The few previous kaon correlation measurements, details of which are given in section 1.3, were severely limited by the paucity of kaons. At the same time, dreams of the QGP and a Nobel Prize have certainly drifted through the minds of every physicist studying relativistic heavy ion collisions. Kaon correlations were seen as a potentially important probe of the QGP if it was created. The enhanced strangeness production observed by E802 [A+90a] was a predicted signature of the QGP [RM82, Raf84] and it was hoped that a high-statistics K+ correlation measurement could expose any exotic
1.2. MOTIVATIONS FOR THIS MEASUREMENT
production mechanism. It was also hoped that the relatively small K+-baryon cross-section, see figure 1-2, would allow a K+ correlation measurement to probe an earlier and hotter source region than that probed by the more common rvr correlation measurements. Also mentioned as motivations in the experimental proposal [RLZ88] were the facts that kaons and pions have dif-ferent resonance contributions, and suffer from difdif-ferent amounts of Coulomb distortion. These
differences were hoped to be useful in a systematic understanding of correlation measurements of different species.
Experimental capabilities and theoretical desires for a given measurement often advance together. The measurement of K+ correlations nicely illustrates this hypothesis. The first suggestions to make such a measurement [GP90, GM89] were published nearly simultaneously with the E859 experimental proposal [RLZ88], of which the K+ correlation measurement was an important part. More ideas for the using kaon correlations soon followed [Gyu92, Pra92, Prab]. As discussed above, formation of the QGP is predicted to result in very long emission durations. The authors of [GP90] show that the large transverse radius, observed in NA35 pion correlation measurements [Hum88], could be explained equally well by calculations using a resonance gas model, and hydrodynamical calculations assuming QGP formation. This was described as an "accidental numerical coincidence." It was the result of long-lived resonances contributing to pion formation and mimicing the extended source predicted for QGP formation. In the models tested in [GP90], this problem was avoided in K+ interferometry by virtue of the different resonance contributions to K+ production.
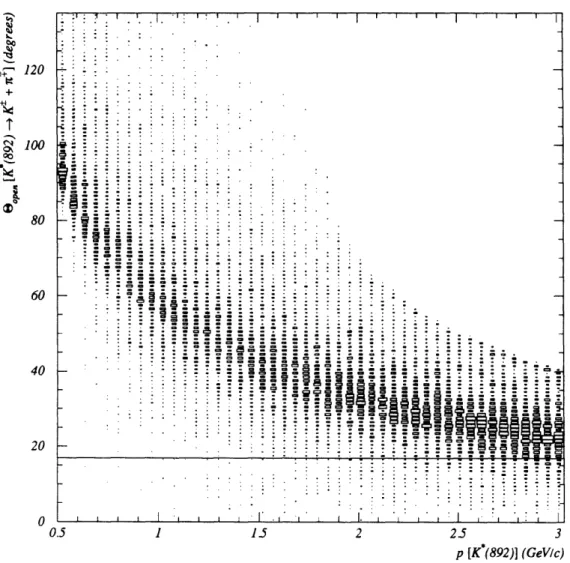
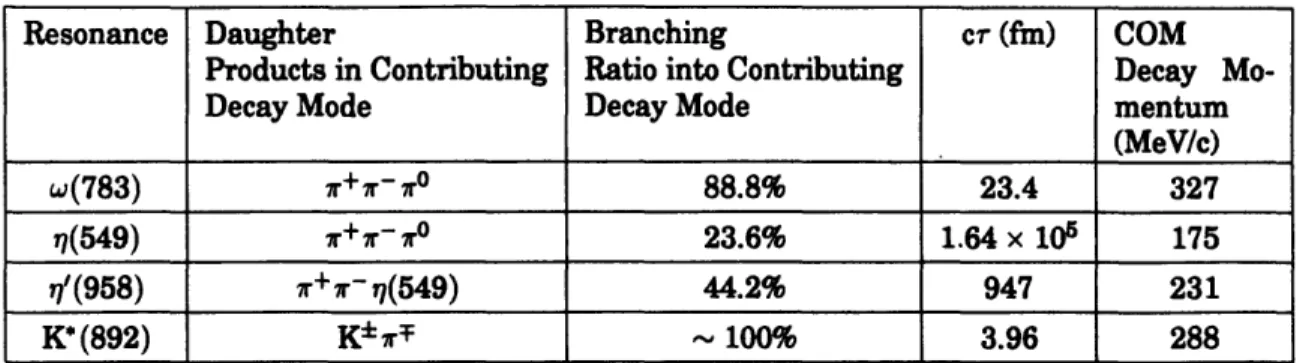
The different resonances thought to contribute to pion production are listed, along with their decay proper time, in table 1.1. The K* (892) is the only resonance thought to contribute to K± production. It should be noted that the actual resonance contributions are not known for heavy ion collisions at AGS energies. Unfortunately, none of these resonances could be directly measured by E859. Only the K*(892) has a major decay mode without any neutral particles. Unfortunately, the small solid-angle (25msr) of the Henry Higgins spectrometer made it impossible for us to measure this critical resonance. A detailed acceptance calculation has not performed, but the essential problem is illustrated in figure 1-3, which shows the opening angle distribution for the K* (892) as a function of momentum. The maximum opening angle of the Henry Higgins spectrometer is indicated by the solid line.
If the QGP is formed in a heavy ion collision, it should co-exist in a mixed phase with the hadronic gas [F+86]. It has been suggested that while in this mixed phase, the QGP should
1
Evidence for the K(892) was not seen in a sample of 261,831 7r-K+ events collected simultaneously with the K+K+ data set used in this analysis
CHAPTER 1. INTRODUCTION 100 50 .o b 10 5 1 5 10 Ecm (GeV/c) 50
Figure 1-2: ato, for K+p and 7r+p, as a function of Ec,, of the collision. From [Gro90O, data points obtained through the PDG online facility].
1.2. MOTIVATIONS FOR THIS MEASUREMENT
1 1.5 2 23 3
p [K(892)] (GeVlc)
Figure 1-3: This figure shows the opening angle of K*(892) - 7rr + KT as a function of
the K*(892) momentum. The maximum opening angle of the Henry Higgins spectrometer is indicated by the solid line. This figure represents 50,000 K*(892) with a flat momentum distribution. Courtesy of T. Sung.
1;.
~1+
+t
*ReNI 00 120 100 ' . I. I *1 . · . . ° .· . ; . .. :: : ': . . .i . i . . . . ... . . . . . .! . . . !. !:.... : L : a: Ae :r~
s *we6 D~n ai: w s:: : - * 9 * e w - B B * , . I , 80 60 40 20 0 0.5 - .. - . . . . : . . y & _ _ - - - . . . . .. . . . ... . 7L I a a : :a 1; :: : 7-. : T ,! : : . ;.i
: :: . . . . . : . ' : : : = , , I1 I'CHAPTER 1. INTRODUCTION
Resonance Daughter Branching cr (fm) COM
Products in Contributing Ratio into Contributing Decay
Mo-Decay Mode Decay Mode mentum
(MeV/c)
w(783) r+7r- r° 88.8% 23.4 327
7(549) Tr+ 7r- ° 23.6% 1.64 x 10⁵ 175
rt'(958) 7r+ 1-7(549) 44.2% 947 231
K* (892) K7r : - 100% 3.96 288
Table 1.1: List of long-lived resonances contributing to pion production.
exist as droplets [V+91]. Competing surface and shape energies result in a predicted radius distribution for the droplets, with (r) T 1 fin. Bose-Einstein correlations have been suggested as a signature for such droplet formation, since two identical particles emitted from a single droplet would result in a small radius component in the correlation function [Pra92]. K+ correlations were singled out as especially promising, because of their small meson-baryon cross-section and lack of long-lived resonances. In a more recent article [Prab], the case for K+ correlations viewing the droplets has been weakened. In this new analysis, kaon production is assumed to be equally divided between the QGP droplets and the hadron gas (as opposed to entirely from the QGP droplets) and the emission-time distribution is not a 6-function.2
1.3 Other Kaon Correlation Measurements
Only three previous kaon Bose-Einstein correlation measurements have been made [C+78, A+85, Mor90]. Extracted source parameters from each of these measurements indicated that the kaon source was smaller than the pion source. But, small kaon production cross-sections limited the significance of each of these measurements. [A+85, Mor90] were forced to combine different projectile/target combinations, and both positive and negative identical kaon pairs.
CERN experiment NA44 [B+93a] is currently collecting data. This experiment has ob-tained excellent statistics for K+K+ pairs in 200A GeV/c32S + 208Pb collisions. Smaller data samples have been collected for K+K+ pairs in 450 GeV/c p + 208Pb collisions and K-K- pairs in 200 A GeV/c32S + 208Pb collisions. Preliminary kaon source parameters are found to be
2
Pratt has interpreted this result in a very favorable light:
... since the distortion of identical particle Bose-Einstein correlations is small... it allows us to safely extract source sizes from correlation functions without considering the effects of density inhomogeneities.
1.3. OTHER KAON CORRELATION MEASUREMENTS
smaller than pion source parameters [Hum94].
1.3.1 Cooper et al.
Kaon Bose-Einstein correlations were first measured by Cooper, et al., who compared IKK, and K,,K phase space distributions in pp annihilations at 0.76 GeV/c [C+78]. The first indication of Bose-Einstein correlations in kaons was found in the asymmetry parameter,
BT =
BT- N( > z)
+
(
<
)'
(1.1)which was found to be greater for indentical kaons than for non-identical kaons. Here is defined to be the angle between the transverse momentum of the two particles. A phase-space analysis using known resonances was found to adequately describe the non-identical
kaon data, and the large relative momentum portion of the identical kaon data. This same
analysis failed to explain the low relative momentum identical kaon data. Fits to the Kopylov and Cocconi correlation functions, see equation 1.26 and equation 1.27, were performed. The
source radius obtained for kaons was found to be smaller than source radii obtained for pions at the same energy [A+77], see table 1.2. The data quality is illustrated in figure 1-4, taken from [C+78]. This figure shows the phase-space calculation results, with and without Bose-Einstein correlations, for low relative momentum slices.
Reaction Pltb (GeV/c) R (fin) c c(fm) Reference pp - 2Kr+ r- 0.76 0.9
±
0.2 2.3±
0.7 [C+78] pp -- 27r+2r-rO 0-0.70 1.8 ± 0.1 1.4 ± 0.2 [A+77]Table 1.2: Comparison of kaon and pion source parameters in pp collisions. From [C+78].
1.3.2 Akesson et al.
Akesson et al. used the Axial Field Spectrometer to measure the Bose-Einstein correlation of kaons, combining K+K+ and K-K- pairs from aa collisions at
I
= 126 GeV, pp collisions at vi/ = 63 GeV, and pp collisions at vs = 53 GeV [A+85]. Data were fit to the Kopylov correlation function, modified because data was insufficient to simultaneously determine all three fitCHAPTER 1. INTRODUCTION
U Ni
:t
6
a: a.,>
M W W U. 0 4'o
i
a
6
U'I-z
I. 0 9 q, (GeV/c) I.,t _ _ A - iJA I qo (GeV)Figure 1-4: This figure, taken from [C+78], shows the first Bose-Einstein correlation
mea-surement of kaons for pp - 2K, r+ r-. The panels show low relative momentum slices for the two variables in the chosen correlation functional forms, see equation 1.26 and 1.27. Note that the qt in the figure refers to the variable qTpair in this analysis. The A curves show the final
phase-space calculation with resonances and the Kopylov form for the correlation function. The
B curves show the same calculation using the Cocconi form of the correlation function. The C
curves show the calculation without any corrrelation function and the D curves do not include any resonances.
1.3. OTHER KAON CORRELATION MEASUREMENTS
parameters:3
C2 (qTp.i) = 1 + A' [2J1(qTpai,r)
/ (qTpir)],
(1.2a)A =
A(1.2b)
[
[+ (qLpaircr)2]
Data in the relative momentum slice, qLpair < 0.30GeV/c, are shown in figure 1-5, along with the fitted correlation function of the form given in equation 1.2. The fit parameters for pions and kaons, plotted as a function of the total charged multiplicity, (nch), are shown in figure 1-6. The kaon source radii are seen to be smaller than the pion radii at comparable values of (nch).
1 E.ao
I .
* I
Figure 1-5: This figure, taken from [A+85], shows the first Bose-Einstein correlation mea-surement of charged kaons in pp, pp, aa -- K+K+ (or K-K- ) + X collisions. Data are plotted
along with the correlation function fit to equation 1.2. Note that the qi and qt in this figure are equivalent to qLpair and qTpair respectively.
1.3.3 E802 Kaon Correlations
The last previous kaon Bose-Einstein correlations measurement was made by experiment E802 [Mor90]. The measured correlation function, C2(Qi,,), shown in figure 1-7, consisted of
1500 K+K+ pairs obtained by combining data from 28Si + 27A1 and 28Si + 197Au collisions at the 50 and 140 spectrometer settings. No source parameters were quoted, but the radius was clearly smaller than that measured by E802 for the pion source. This was a strong incentive for E859, since it proved that a solid measurement could be obtained with an improved trigger.
3
CHAPTER 1. INTRODUCTION
3
1.
I
a)
Figure 1-6: (nch) dependence of kaon (solid symbols) and pion (open symbols) source radii from [A+85]. The kaon radii are seen to be marginally smaller than the pion radii at
1.3. OTHER KAON CORRELATION MEASUREMENTS
Si+A-2K++X (E802 Very Prellm)
2.6 2.0 1.5 1).v
1-1.0 n 200 q1 1, (MeV) 400 M00Figure 1-7: E802 K+K+ correlation function. From [Mor90].
I 1 I I l I I I I I I - ct2 - + zsrp(-qw,'/2) (oid)
-II
I
I I I
I
.1
t
0 v.UCHAPTER 1. INTRODUCTION
1.3.4 NA44 Kaon Correlations
CERN experiment NA44 is a second-generation heavy ion experiment, specialized for mea-suring Bose-Einstein correlations [B+93a]. It is a focussing spectrometer, using several dipole and quadrupole magnets to maximize the acceptance for pairs with small relative momentum. NA44 is the only experiment currently capable of making a high statistics measurement of the K- source.
Two scenarios have been suggested to result in a K- source that is larger than the K+ source. For QGP formation at finite baryon densities, where the chemical potential of kaons, K+ and
K°, PK = ,Pq - p > 0, strange quarks are concentrated (distilled) in the plasma phase. Such quarks do not hadronize into anti-kaons, K- and K 0, until late in the collision process [G+87].4 This would result in very different source distributions for kaons and anti-kaons as measured by Bose-Einstein correlations [GM89, Gyu92]. Such a difference could also result from the different meson-baryon cross-sections for kaons and anti-kaons.
A three-dimensional analysis of the K+ source has been performed using the qLqTsideqTout
parameterization [Hum94], see equation 1.32. Low relative momentum slices of the various projections 5 are shown in figure 1-8. The kaon source parameters are found to be smaller than the pion source parameters extracted by the same experiment, see table 1.3. Preliminary results have been compared to RQMD predictions and will be summarized in chapter 6. A preliminary analysis has also been performed for the K- source. The source parameters for K-'s were found to be similar to those for K+'s [Hum94].
7Tr7r_ 7r+lr+ K-K- K+K+
RL 4.4 0.4 4.9 0.3 3.6 ± 0.6 2.8 0.3 RTside 3.7 ± 0.5 4.4 ± 0.2 NA 2.4 ± 0.3 RTout 3.6 ± 0.2 4.1 ± 0.1 3.2 ± 0.4 2.7 ± 0.2
Table 1.3: Comparison of NA44 source radii, RL, RTsidc, andRTou,,t, obtained in 32
S + 2Pb
collisions [Hum94].
4
They may not be released at all, if strange quark matter is indeed stable. So-called strangelets are an area of intense interest [G+94, and references therein].
5
Note that the fits are performed for these slices, not over the entire phase space. This is a result of the focussing spectrometer which limits the NA44 measurement to one transverse component at a time.
1.3. OTHER KAON CORRELATION MEASUREMENTS
5 a U 1.s t. as as I, r s to m (IMOVi) a l a t me (uev) U LII ,. I.. a as U I · I ' i - I I 0<Q H _ , , ., OL4e
) YVe
/e
-,<40Q ¥V/s orzonta . .Figure 1-8: This figure shows low relative momentum slices of the NA44 correlation function,
C2(qL, qTside) qTout),
for
32S + 208Pb-- 2K
++ X[Hum94]. Solid lines are fits to equation 1.32.
· tol 1M am
{
#
nl
i , - I I I
Oo * _.<a,<- O(q'40 MoV/
.v/, HoEzlontaI [ · I . I . I . I ! ate o0¢040 /e 4 * 4 V. rl.aI a . . I I . I
_
I dl~~~~~~~~~~~~~~~~ ICHAPTER 1. INTRODUCTION
1.4 Identical Particle Interferometry Basics
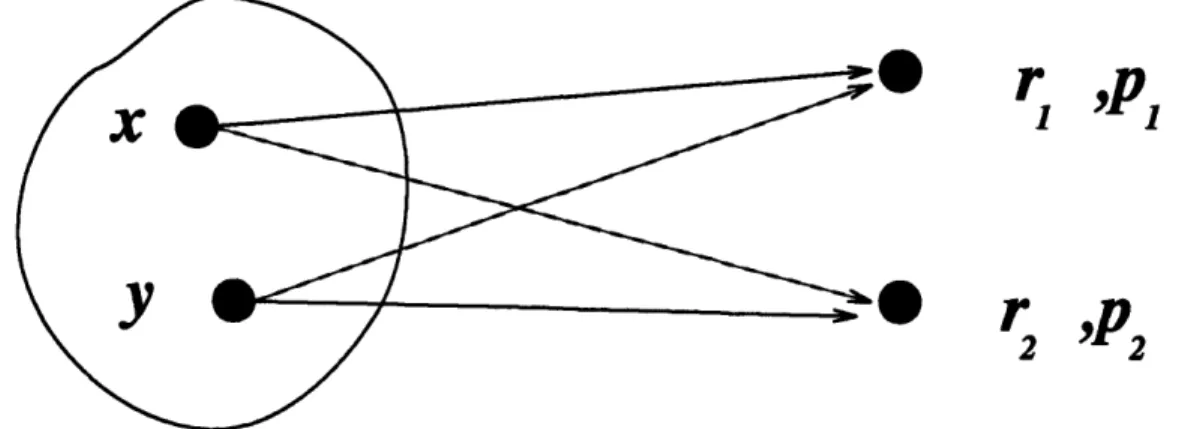
A simple derivation of the correlation function serves to illustrate many important features of intensity interferometry. Figure 1-9 shows a schematic source of identical6 particles, two of
which are detected at rl and r2, with momenta p, and P2. The particles originate at x and y and
r
* r
p
2
Figure 1-9: Schematic of the particle source used to derive intensity interferometry. See text
for details.
their paths are indistinguishable.7 We have to sum the amplitudes of the two indistinguishable processes. If we assume the particles to be Bosons, then the sum needs to be symmetrized.
Plane Waves
If we assume that the Bosons' wavefunctions are plane waves, then we can write the sym-metrized amplitude as:
1
A
12=
-(exp(ipl
.(rl- x))exp(ip
2 .(r
2- y)) + exp(ipl
.(rl- y))exp(ip
2(r
2- x))). (1.3)
But, the wavefunctions for charged particles are Coulomb waves, and there will be some contri-bution from the strong interaction. The Coulomb distortion of phase space is usually corrected for with the standard Gamow factor:
) exp(27r7) - 1' (1.4a)
6
Bowler [Bow921 derives the unexpected result that intensity interferometry signals are, in principle, observable from particle/anti-particle pairs. For this to occur, the pair needs to be emitted from the same space-time point, so the effect is likely to be small.
7Indistinguishability is simply an experimental reality. Detectors located 1 m from two sources 100 fm apart would need a momentum resolution, 6p/p = 10- 1 3 to distinguish the sources of the individual sources. Thanks to Mark Baker for making this point clear.
1.4. IDENTICAL PARTICLE INTERFEROMETRY BASICS
= am
(1.4b)
Here a is the fine-structure constant, and m is the mass of the particle of interest. This Gamow factor assumes a point source, and so overestimates the true correction due to the screening in a finite-sized source. This overestimate is discussed in section 4.3.5 and is found to be small. Systematic studies indicate that any reasonable error in the Coulomb correction will have little effect on the results.
The strong interaction is short-range, and the large size of the sources created in heavy ion collisions greatly reduces its effect on correlation measurements [Bow88].
No Dynamical Correlations
The next step in the derivation is to obtain the probability for emission of two particles at momenta Pl, P2. We integrate the complex square of the amplitude over an emission function,
g(p, r). The assumption of no dynamical correlations is equivalent to the assumption that the emission function factorizes: g(p, r) = f(p) p(r). With this assumption, the integral becomes a simple Fourier transform:
pl (p)Pl, (P2)
f
dx
d4y
A
1212
g(x)g(y),
(1.5a)
P1(P1)P1(P2) I
= 1 + Ip(p1 - p2)12 (1.5b)
The basic result of this assumption is that intensity interferometry of Bosons (hereafter re-ferred to as Bose-Einstein correlations) leads to an enhancement in the probability for observing two identical particles at low relative momentum. The range of this enhancement in relative momentum will be q - A/r. The enhancement in a certain relative momentum projection will be sensitive to the source size in the conjugate spatial variable. However, this geometrical interpretation comes at a price: if the factorization assumption is valid, then Bose-Einstein correlations can tell us nothing about the phase space evolution of the source. Regardless of the validity of the factorization assumption, we can make the following statement:
Bose-Einstein correlations measure the separation of those particles that are ac-cepted by the measuring apparatus, at a small enough relative momentum to be subject to Bose-Einstein enhancement.
No Coherence
CHAPTER 1. INTRODUCTION
the source is coherent, then we cannot, even in principle, distinguish two separate emission points. Under these conditions, IAl212 = 1, and the correlation function is flat.8
An observed deviation of the correlation function intercept from its predicted value of one has resulted in an almost universal adoption of the "chaoticity" parameter A [D+82]. With this
parameter, the correlation function becomes:
C2 = 1 + A Ip(pi - P2)12 (1.6)
A can arise from other processes besides coherence, and very likely the observed values of A < 1 arise from long-lived resonance production. The relative momentum extent of the Bose-Einstein enhancement for particles emitted from such resonances is too small to be resolved by current detectors.
Insensitivity to Parameterization
The insensitivity of the Fourier transform to details of shape was first pointed out in [G+60]. Zajc has emphasized this point, and makes it clear that it is a result of the fact that separation distributions generated from very different position distributions all "look" Gaussian. Figure
1-10 demonstrates this point with data. The r+ 1D correlation function data is plotted along with correlation functions from a spherical shell, a solid sphere, and a spherical Gaussian. The radius parameter of the Gaussian parameterization was fit to the data. The size parameters of the different parameterizations are selected to give similar values of the rms separation.
Applications of Bose-Einstein Correlations
Intensity interferometry was pioneered by Hanbury-Brown and Twiss (HBT) who used the technique to measure the size of stellar radio sources [HB74, and references therein]. The first application of the technique to particle physics was made by Goldhaber, Goldhaber, Lee, and Pais (GGLP) who used the technique to explain the observed difference between opening angle distributions of like and unlike sign pion pairs created in pp collisions [G+60].9
Some very interesting atomic physics experiments are currently being performed that use identical particle interferometry to elucidate interesting quantum mechanical effects [G+93] and to test the validity of special relativity [C+93a]. Time considerations do not allow detailed descriptions of these experiments here, but interested readers are encouraged to read these very approachable articles.
8
Note that this does not mean that the interference pattern, which is due to amplitude interferometry, is flat!
1.4. IDENTICAL PARTICLE INTERFEROMETRY BASICS
1.8 1.7 1.6 1.5 1.4 1.3 1.2 1.1 1 0.9 0 50 100 150 200 250 300 q (MeVic)Figure 1-10. Comparison of the measured 7r+r+ correlation function to the predictions of spherical Gaussian, spherical shell and hard sphere parameterizations. The upper left panel shows the fractional difference between the parameterizations, seen to be everywhere less than 5%. The upper right panel vividly illustrates the reason for this insensitivity of the Bose-Einstein correlation technique: the separation distributions for these parameterizations, and in fact any distribution with a comparable rms value, are very similar.
CHAPTER 1. INTRODUCTION
Interest in using this technique to examine heavy ion collisions was motivated by the geometrical information thought to be obtainable. As emphasized throughout this thesis, this naive view is no longer held. We now have a better understanding of the sensitivity of Bose-Einstein correlations to collision dynamics. This sensitivity makes Bose-Bose-Einstein correlations a more powerful probe than previously realized. At the same time, any simple geometrical interpretations are compromised. Reviews of Bose-Einstein correlations in nuclear and particle physics can be found in [BGJ90, Lor89, Sol94].
The first formulation of intensity interferometry in terms of a correlation function was given by Kopylov [KP74]. The following, rigorous, formulation of the correlation function in terms of the inclusive single-particle and two-particle cross-sections was given by Gyulassy [GKW79]:
du
(n)2P a~P n (1.7)
C2 P- (n(n- 1))2 d3 d (1.7)
The factors in the first fraction are the average first and second binomial moments of the multiplicity distribution, introduced to enforce C2 = 1 for an uncorrelated source, regardless
of the multiplicity distribution. This correlation function can be written in a more intuitive manner in terms of properly normalized probability distributions:
2(Pi, P2) (1.8)
C2(p1,p2) = 'I(PO)p 2) (1.8)
Unfortunately, this formulation is not experimentally feasible. Current state of the art corre-lation analyses can only analyze three dimensions of this six dimensional quantity.
In the discussion on page 29, we obtained a form for the correlation function in terms of the relative momentum, q P2 - Pl. Guided by this, we operationally define the correlation function as:
Actual(q)
C2(q)- Background(q)' (1.9)
Here, the Actual distribution is simply the measured relative momentum distribution in whichever parameterization is being examined. The ideal Background distribution contains all effects that enter into the Actual distribution except the Bose-Einstein symmetrization, i.e., Coulomb repulsion, event class (centrality), kinematic correlations, etc. The standard tech-nique used to generate Background distributions in relativistic heavy ion collisions is known as event-mixing. This was the technique chosen for this analysis.
There are several reasons to be cautious with an event-mixed Background. First, energy and momentum are not explicitly conserved. This should not be a concern for a relativistic
1.5. RELATIVE MOMENTUM VARIABLES
heavy ion collision since no single particle represents a large fraction of the system's total energy. If an experiment is analyzing correlation functions as a function of reaction-plane (the
azimuthal orientation of the target and projectile) then event-mixing must be performed with
the coordinates defined relative to the measured reaction plane. As first noted by Zajc [Zaj82, Z+84], the errors associated with an event-mixed Background are not Poisson. This is was found to be a negligible problem with the data sets used in this analysis, as discussed in section 4.3.1. Zajc was also the first to note [Zaj82, Z+84], that the event-mixed background retains some degree of the correlation. This occurs because the event-mixing procedure integrates over the observed, correlation function-distorted, two-particle momentum distribution. This effect was found to be small (2-5%) for the data sets used in this analysis. More detailed discussion can be found in appendix B.
The event-mixing algorithm has two advantages. First, the centrality distribution is made explicitly the same in the numerator and denominator. Second, complicated questions of single-particle acceptance drop out. To see this, one simply needs to realize that with the event-mixing technique, the spectrometer efficiency and acceptance can be factorized into single-particle and two-particle components [Mor90]:
P2°'(pI, P2) = P2(Pl, P22)(Pl)1(P(P2)2(Pl, P2),
(1.10a)
Plob(P1) = PI(Pl) 1(P1), (1.10b)
plb (P2) = P(P 2)X (P2). (1.10C)
When we take the division according to equation 1.10, we see that the (l terms cancel. The remaining two-particle acceptance (TPAC) effects, 2, must be accounted for. Examination of the effects of the TPAC on this analysis can be found in section 4.2.5, and appendix A.
1.5 Relative Momentum Variables
In this section I will define all of the relative momentum projections used in this analysis for source parameterization. Throughout this discussion 4-vectors will be indicated with boldface type (e.g., Q), 3-vectors will have an arrow superscript (e.g., q), and scalers will be plain text (e.g., q). Table 1.4 summarizes each relative momentum variable used in this analysis, the source parameter which it measures, and gives a rough physical interpretation. The different projections are illustrated in figure 1-11. Note that throughout this analysis, the beam axis is defined to be the z-axis.
CHAPTER 1. INTRODUCTION
1.5 Relative Momentum Variables
In this section I will define all of the relative momentum projections used in this analysis for source parameterization. Throughout this discussion 4-vectors will be indicated with boldface type (e.g., Q), 3-vectors will have an arrow superscript (e.g., q), and scalers will be plain text (e.g., q). Table 1.4 summarizes each relative momentum variable used in this analysis, the source parameter which it measures, and gives a rough physical interpretation. The different projections are illustrated in figure 1-11. Note that throughout this analysis, the beam axis is defined to be the z-axis.
Relative Momentum Variable
Q =--'f
qdana q-_
f)2_ (E - E)2
I - 21 qo - IE -E 21 qL IPZl - P2 qT - XqTout
-qTside = IqT X 3r-I
qLpair - q r
qTpair q X rr
Conjugate Source Parameter: Physical Interpretation
RQ : a of a spherical Gaussian measured in the pair
rest frame.
Rdna
:
of a spherical Gaussian measured in the cho-sen, fixed frame. Explicitly assumes R = r.R : of a spherical Gaussian measured in the
cho-sen, fixed frame. Rm,, =
V3R.
T : rms duration of boson emission.
RL : rms size parallel to the beam axis.
RT : a of a twi-dimensional Gaussian perpendicular
to the beam axis.
RTot : a of a two-dimensional Gaussian perpendicular
to the beam axis and parallel to n,,. Contribu-tion from source lifetime.
RTside
:
a of a two-dimensional Gaussian perpendicularto the beam axis and /,. No contribution from source lifetime.
RLpair: rms size parallel
to C,,.
Full contribution from source lifetime.RTpair: a of a spherical Gaussian perpendicular to Oi.
No contribution from source lifetime.
Table 1.4: Definition of relative momentum variables and rough physical interpretations.
The first variables of interest are the 3-vector and scaler components of the relative momen-tum:
q p, - po (1.11)
![Figure 1-1: Schematic nuclear matter phase diagram [Jac89]. The density, d, is given in units of normal nuclear matter density, do.](https://thumb-eu.123doks.com/thumbv2/123doknet/14180353.476141/23.918.195.726.549.928/figure-schematic-nuclear-matter-diagram-density-nuclear-density.webp)
![Figure 1-2: ato, for K+p and 7r+p, as a function of Ec,, of the collision. From [Gro90O, data points obtained through the PDG online facility].](https://thumb-eu.123doks.com/thumbv2/123doknet/14180353.476141/26.918.235.670.334.840/figure-function-collision-gro-points-obtained-online-facility.webp)
![Figure 1-6: (nch) dependence of kaon (solid symbols) and pion (open symbols) source radii from [A+85]](https://thumb-eu.123doks.com/thumbv2/123doknet/14180353.476141/32.918.302.646.378.802/figure-dependence-kaon-solid-symbols-symbols-source-radii.webp)
![Figure 1-8: This figure shows low relative momentum slices of the NA44 correlation function, C 2 (qL, qTside) qTout), for 32 S + 208Pb -- 2K + + X[Hum94]](https://thumb-eu.123doks.com/thumbv2/123doknet/14180353.476141/35.918.174.711.398.791/figure-figure-relative-momentum-slices-correlation-function-qtside.webp)