Applications of Deep Learning and Computer Vision
in Large Scale Quantification of Tree Canopy Cover
and Real-time Estimation of Street Parking
Utilization
by
Bill Yang Cai
A.B., University of Chicago (2017)
Submitted to the Center for Computational Engineering in partial fulfillment of the requirements for the degree of Master of Science in Computation for Design and Optimization
at the
MASSACHUSETTS INSTITUTE OF TECHNOLOGY
September 2018
@
Massachusetts Institute of Technology 2018. All rights reserved.Signature redacted
A uthor ...Center for Com ti a eering
Certified by...
Certified by...
Accepted by ...
Signature redacted
Carlo Ratti
Professor of Urban Technologies an Planning, MIT
r MIT
seable City Lab
Supervisor
.Signature
redacted ...
.
Fabio Duar
Professor, Pontificia Universidade Cat6lica do Parani
Research Scientist, MIT Senseable City Lab
Signature redacted
Thetis Reader
...
Youssef Marzouk
Associate Professor of Aeronautics and Astronautics
Co-Director, Computation for Design and Optimization Program
MASSACHUSMS INSITUTE
OF TECHNOLOGY
w
Applications of Deep Learning and Computer Vision in Large
Scale Quantification of Tree Canopy Cover and Real-time
Estimation of Street Parking Utilization
by
Bill Yang Cai
Submitted to the Center for Computational Engineering on Aug 16, 2018, in partial fulfillment of the
requirements for the degree of
Master of Science in Computation for Design and Optimization
Abstract
A modern city generates a large volume of digital information, especially in the form of
unstructured image and video data. Recent advancements in deep learning techniques have enabled effective learning and estimation of high-level attributes and meaningful features from large digital datasets of images and videos. In my thesis, I explore the potential of applying deep learning to image and video data to quantify urban tree cover and street parking utilization.
Large-scale and accurate quantification of urban tree cover is important towards informing government agencies in their public greenery efforts, and useful for mod-elling and analyzing city ecology and urban heat island effects. We apply state-of-the-art deep learning models, and compare their performance to a previously established benchmark of an unsupervised method. Our training procedure for deep learning models is novel; we utilize the abundance of openly available and similarly labelled street-level image datasets to pre-train our model. We then perform additional train-ing on a small traintrain-ing dataset consisttrain-ing of GSV images. We also employ a recently developed method called gradient-weighted class activation map (Grad-CAM) to in-terpret the features learned by the end-to-end model. The results demonstrate that deep learning models are highly accurate, can be interpretable, and can also be effi-cient in terms of data-labelling effort and computational resources.
Accurate parking quantification would inform developers and municipalities in space allocation and design, while real-time measurements would provide drivers and parking enforcement with information that saves time and resources. We propose an accurate and real-time video system for future Internet of Things (IoT) and smart cities applications. Using recent developments in deep convolutional neural networks (DCNNs) and a novel intelligent vehicle tracking filter, the proposed system combines information across multiple image frames in a video sequence to remove noise intro-duced by occlusions and detection failures. We demonstrate that the proposed system achieves higher accuracy than pure image-based instance segmentation, and is
com-parable in performance to industry benchmark systems that utilize more expensive sensors such as radar. Furthermore, the proposed system can be easily configured for deployment in different parking scenarios, and can provide spatial information beyond traditional binary occupancy statistics.
Thesis Supervisor: Carlo Ratti
Title: Professor of Urban Technologies and Planning, MIT Director, MIT Senseable City Lab
Acknowledgments
I am grateful to the advice from my thesis supervisor, Carlo, and the guidance from
my thesis reader, Fdbio. Your patience and generosity with your time and energy have allowed me to explore research ideas, while your insights and ideas have helped me to focus on high impact topics.
I am thankful for friends, colleagues and collaborators that I have met in my time
at the Senseable City Lab. I have had the pleasure of working and learning from many in the lab, including Xiaojiang, Ricardo, Yuji, Longxu, Banti, and Louis. Your creativity has stimulated my own, and your drive and passion for what you do are inspiring. I hope that the lab will continue to be a vibrant space for inter-disciplinary, collaborative and meaningful research, and that I will carry the spirit of helpfulness and generosity with me.
I could not be where I am today, a soon-to-be MIT graduate, without the immense and constant support of my family and friends. My parents, Cai Mao and Sheng Mei, have given me wise counsel and advice throughout my life while respecting and supporting my decisions. My siblings, Michael, John, and Grace, have always been a tremendous source of encouragement. I will always remember my helper and grandmother, Miati and Laolao, for the values of diligence and love that they have instilled in me.
I am grateful for the scholarship provided by the Singapore government, and, in
particular, for the support that I have received from the scholarship officers of the PSC Secretariat. Your patience and understanding have made my time as a scholarship holder significantly more pleasant.
Last, I fully acknowledge the work and hand of God in my life, including my academic work. I hope that I will continue to draw inspiration and direction from His Word, and that my work can glorify His Name and benefit people.
Contents
1 Introduction
1.1 Motivation for using deep learning . . . .
1.2 Approach and outline . . . .
2 Quantifying Canopy Cover: Introduction and Literature Review 2.1 Traditional approaches to quantify canopy cover . . . . 2.2 Deep learning in quantifying urban canopy cover . . . .
3 Quantifying Canopy Cover: Methodology
3.1 Obtaining GSV training-validation-test dataset . . . .
3.2 Augmenting training data . . . . 3.3 Evaluation metrics . . . . 3.3.1 M ean IoU . . . .
3.3.2 Mean Absolute Error . . . . 3.4 M odels . . . . 3.4.1 Benchmark Treepedia unsupervised segmentation . 3.4.2 DCNN semantic segmentation . . . .
3.4.3 DCNN end-to-end learning . . . . 3.5 Using Grad-CAM to visualize the DCNN end-to-end model
4 Quantifying Canopy Cover: Results and Discussion
4.1 M odel Perform ance . . . . 4.2 Interpretability of DCNN end-to-end model . . . .
13 13 15 17 17 20 23 . . . . 23 . . . . 24 . . . . 25 . . . . 25 . . . . 26 . . . . 26 . . . . 26 . . . . 27 . . . . 27 . . . . 28 33 33 34
4.3 Running time and scalability . . . .
4.4 D iscussion . . . .
5 Street Parking Estimation: Introduction and Literature Review 5.1 Introduction . . . .
5.2 Existing quantification methods . . . .
6 Street Parking Estimation: Experiment and 6.1 Experiment and Data Collection . . . .
6.2 Methodology . . . . 6.2.1 Instance Segmentation . . . .
6.2.2 Parking Identification . . . .
6.2.3 Implementation Challenges . . . .
Methodology
7 Street Parking Estimation: Validation and Discussion 7.1 Validation Data and Metrics . . . .
7.1.1 Detection Accuracy . . . .
7.1.2 Spatial Accuracy . . . .
7.1.3 Time Accuracy . . . . 7.1.4 Processing Efficiency . . . .
7.2 Validation Results . . . .
7.2.1 Accuracy Results: Pure Detection
7.2.2 Accuracy Results: Comparison to
7.2.3 Accuracy: Sampling Rates . . . .
7.2.4 Processing Speed . . . .
7.3 Discussion . . . . 7.3.1 Generalizability to other sites . .
and Memory Filter . Industry Benchmarks
. . . . . . . . . . . .
7.3.2 Information beyond binary occupancy
A Figures 34 35 39 39 41 45 45 46 46 48 50 59 59 60 60 61 63 63 63 64 65 65 66 67 67 69
List of Figures
1-1 Price per megabyte of hard disk storage . . . . 13
1-2 ImageNet classification challenge error over time . . . . 15
2-1 Sample satellite image . . . . 18
2-2 Google Street View sample images . . . . 18
3-1 Sample GSV images and vegetation labels . . . . 24
3-2 Sample images and vegetation labels from Cityscapes dataset . . . . . 24
3-3 Sample results from benchmark unsupervised segmentation results . . 30
3-4 Sample results from PSPNet semantic segmentation . . . . 31
3-5 Sample results for Grad-CAM . . . . 32
4-1 Sample results from large-scale urban greenery quantification for Boston 37 4-2 Sample results from large-scale urban greenery quantification for London 37 5-1 Sample images from PKLot dataset and Common Objects in Context dataset . . . . 42
5-2 Features learned by trained DCNN model in [1] . . . . 43
6-1 Experim ent sites . . . . 45
6-2 Object detection, semantic segmentation, and instance segmentation . 47 6-3 Experiment sites with drawn parking lots and surrounding road areas 49 6-4 Sample of noisy raw utilization measurements from Museum site . . . 50
6-6 Comparison of lighting conditions at street parking lots studied at the
M useum Site . . . . 52
6-7 Mode filter applied to sample of utilization measurements from Mu-seum site . . . . 52
6-8 Diagram of intelligent car tracking filter . . . . 54
6-9 Maximum occlusion that can be handled by filter . . . . 56
6-10 Single detection at frame round(n) . . . . 56
6-11 Typical scenario for matching cars . . . . 57
6-12 Intelligent filter applied to sample of utilization measurements from M useum site . . . . 57
7-1 Vehicle location information generated from intelligent filter . . . . . 68
A-1 Grad-cam sample results . . . . 70
A-2 Screenshot of MATLAB app Ground Truth Labeler used to label ve-hicle locations for validation . . . . 71
List of Tables
3.1 Summary of models . . . . 26
3.2 Accuracy comparison between models . . . . 29
4.1 Running time comparison between models . . . . 35
6.1 Summary of experiment sites . . . . 46
7.1 Summary of validation datasets . . . . 59
7.2 Accuracy results from validation datasets sampled from full timeframe 63 7.3 Accuracy results from validation datasets sampled from 07:00:00 to 18:59:59 . . . . 63
7.4 Occupancy accuracy comparison with industry standards . . . . 64
7.5 Accuracy results from different sampling rates with full timeframe . . 65
Chapter 1
Introduction
1.1
Motivation for using deep
learning
Price per megabyte of cheapest magnetic storage ('hard disk storage')
0 11 e, 0 0 , z 0 a, 0 .4 a, 'U 0' 'U U, me e "e0%esm== 1999 2003 2007 2011 Year 1995 S 0 I.-0 'U .0 I.-2015
Figure 1-1: Price per megabyte of cheapest available indicates year of 1995, and green line indicates year of
hard
2015.
1
disk storage
Cities already generate and will continue generating massive volumes of digital in-formation in the form of unstructured and rich image data. The foundation of such a trend is the progress made in digital storage during the last 2 decades. Cheaper digital storage have enabled cost-effective collection of digital photos and videos that have almost completely replaced traditional film-based recordings. In 1995, the cost
2.00 L75-1.50 1.25 o.75 0.50-0.25 0 .00. . 9k 0.50 Red line r 1
per megabyte of magnetic disk storage was approximately 0.267 USD on a then state-of-the-art Seagate ST410800N. In 2015, the same cost per megabyte has plummeted to 0.0000333 USD on a Toshiba 3TB DT01ACA300, less than 0.013% of the cost per metabyte in 1995. With cheap and readily available digital storage, private companies and public agencies are able to collect and store large quantities of digital information. At the same time, popular digital products and services produce large image datasets that contain rich spatio-temporal information, often as by-products of user interactions. Many digital services and products such as Flickr and Instagram of-ten promote user generation and peer-to-peer sharing of image and videos. The vast collection of these data often come with metadata information such as user-provided tags that contain semantic meaning and GPS location that can be correlated with urban phenomena. Digital giants like Google and Baidu have also intentionally col-lected large datasets of street-level images. These datasets represent a rich source of urban information that is more scalable than survey and census collection, and remains a relatively unexplored datasets for social scientists and urban studies re-search. The few recent studies that have utilized Google Street View (GSV) images include Naik et al's [2] study that crowdsourced labels of perceived safety and trained a deep learning-based model to predict perceived safety for GSV images. Zhou et al
13] also used geo-tagged images to map and understand visual attributes of cities such
as types of human activity and architectural similarity. Li et al [4] also utilized GSV images to quantify and map the spatio-temporal distribution of urban canopy cover. The collection of these large datasets have enabled the academic community to use and improve on long-existing fundamental artificial intelligence methods in the computer vision field. Simple neural networks, called then as "perceptron" [51, were introduced for simple linear classification in 1958. Backpropagation or adjoint state methods was proposed in the early 1960s [6,7] and were applied to neural networks in 1974
18].
Neural networks were used to classify handwritten digits that were digitally collected, and their combination with convolutional layers achieved human-level per-formance in 2003[9].
An important development is the launch of large-scale image(and later video) classification, detection and segmentation competitions, beginning with the Pascal VOC competition in 2005
110].
These competitions provide bench-mark datasets and evaluation criteria for researchers to standardize and compare performance across different models. Deep convolutional neural networks (DCNNs) have demonstrated performance superior to almost all other methods beginning from the 2012 ImageNet challenge [11].ImageNet Classification Accuracy Over Time
35% Traditional CAnxter Vison Traditional 226% 25% 0 'U16 22420% 'U12 W 15% Z 0 GDOgLeNet: 0l 7% E 10% ResNeL 4% ISNet 3% SENet: 2% 5% 0%10 2011 2012 2013 2014 2015 2016 2017 Year
Figure 1-2: Plot of lowest ImageNet classification challenge error over time'. Winning models are named in the text above, with DCNN models written in maroon and traditional computer vision methods written in black.
Since then, DCNN based models have become a popular topic of research for computer scientists in the field of computer vision, and have also achieved remarkable results for more complex tasks. My thesis draws upon the success of these models for three tasks: classification, semantic segmentation and instance segmentation.
1.2
Approach and outline
My thesis focus on two important topics in the smart cities and urban planning
liter-ature: urban greenery and city parking. I introduce existing challenges and solutions
2
Data source is from ImageNet website accessible at www.image-net.org/
in these two areas, and also explain my design and implementation of computer vi-sion and deep learning solutions to quantify urban canopy cover and to measure street parking utilization in real-time. Lastly, I discuss the evaluation of these solutions and their potential application in real-world and practical systems.
In Chapter 2, I introduce and describe the state of past and current research in quantifying canopy cover, especially in existing applications of deep learning to understand similar problems. In Chapter 3, I discuss the methodological choices for the urban canopy cover problem, including the data collection, data labelling, evaluation metrics and model architecture choices. In Chapter 4, I discuss the results and findings for the canopy cover quantification problem. This section of my thesis is published as a conference paper in the IEEE BigData Congress 2018 [12].
Chapter 5 introduces benefits of and challenges in quantifying parking spaces, es-pecially on a large and cost-effective scale. Chapter 6 discusses the detailed techniques and system design used to accurately and efficiently quantify street-parking. Chapter
7 evaluates the methods in Chapter 6 and briefly explores possible applications. This
section of my thesis will be submitted for publication in a journal that has a technical focus. Additionally, the urban studies implications of this section of my thesis will also be submitted to an academic journal in the urban studies domain.
Chapter 2
Quantifying Canopy Cover:
Introduction and Literature Review
2.1
Traditional approaches to quantify canopy cover
Researchers and urban planners are interested in large scale analysis of urban greenery, and, in particular trees, because urban greenery provides wide-ranging services in cities such as carbon sequestration and oxygen production
1131,
and heat island effect mitigation [14]. Furthermore, the perception of urban greenery has a significant influence on the visual appeal of streets115],
such that urban greenery programs have generally received support from local residents [161.Traditional approaches to map vegetation cover mapping have relied on either overhead view remote sensing images or photographs, and surveyed data obtained via on-ground fieldwork. Yang et al
117]
argues that methods based on overhead view images are limited in their ability to represent the profile view of street vegetation that people experience on the streets. In addition, fieldwork images are limited in their coverage and are costly to acquire at citywide scales.The advent of large-scale and open-source street-level image datasets such as Google Street View (GSV) and Baidu Maps street view service provide researchers a new tool for assessing urban vegetation cover [4]. In addition to their extensive coverage across most of North America, Europe and East Asia excluding China, GSV
Figure 2-1: Satellite image of junction between Portland and Washington St in Cam-bridge, MA.
~1Jj~I
~IJ
q
Figure 2-2: Google Street View images of identical Portland and Washington St junction taken at different headings.
images are collected and processed to obtain high-resolution, precisely standardized and located images of streetscapes [18]. Furthermore, the recent explosion of research in autonomous vehicle technology has resulted in an abundance of large-scale labelled street-level image datasets such as the Cityscapes dataset
[191
and Mapillary Vistas. Thus, GSV images represent a comprehensive image dataset of the urban landscape that meets the training requirements of deep learning models.To quantify urban tree cover, Yang et al [17] and Li. et al
141
utilize the Green View Index (GVI) metric. The GVI metric measures street-level urban tree cover cover by averaging the percentage of identified tree canopy pixels in street-level images taken at different headings and pitches from the same geographical location. To identify tree canopy cover in these images, Li. et al[4]
uses an unsupervised mean shift image segmentation algorithm120]
to measure the number of green pixels as a percentage of total pixels in a GSV image. While this benchmark unsupervised method does not require training data, segmentation results from this method are influenced by the presence of shadows and the illumination condition in the GSV images. Green features other than vegetation are also misidentified as urban tree canopies with this method. Seiferling et al. [211 first applied supervised learning to quantify vegetation cover inGSV images, but their method involved pre-computing image features. To address
these shortcomings, we make use of recent advances in supervised DCNN methods by training and testing two models. We train a DCNN semantic segmentation model to produce a densely segmented image, and also train a DCNN end-to-end model that directly estimates GVI in GSV images.
To validate accuracy in estimating GVI, Li. et al [41 used 33 labelled GSV images and calculated the Pearson's correlation coefficient between GVI from labelled images and model estimates. We use a larger test set of 100 GSV images randomly selected across cities in our study area. We propose two additional metrics to validate predic-tion accuracy of our models: (1) Mean Intersecpredic-tion-over-Union (IoU) is a standard metric used in the computer vision field and captures the accuracy of the location of assigned "green vegetation" pixel labels. (2) Mean Absolute Error calculates the mean of absolute differences in labelled GVI and estimated GVI across images in the
test GSV dataset. These two metrics provide a direct measure of accuracy in locating urban tree cover and measuring GVI respectively, while Pearson's correlation coef-ficient only provides information on the strength of co-movement between labelled
GVI and estimated GVI.
2.2
Deep learning in quantifying urban canopy cover
The use of DCNN in urban ecology and geographic information science (GIS) is in its early stages and relies mostly on overhead, often satellite, imagery. A survey by Cheng et al.'s of the use of DCNN in recent remote sensing literature
122]
concluded that datasets of non-overhead images, especially of geo-tagged and profile-perspective social media photos provide a larger-scale and more visually diverse collection of images for deep learning algorithms as compared to imagery collected from satellitesand airborne surveys.
Wegner et al
123]
is an example of recent work that employed DCNN models to street-level images in the urban ecology field. The authors developed a sophisticated method that uses DCNN models on street-level and overhead images to accurately locate and classify tree species. While the information obtained about urban trees from Wegner et al's method is rich in terms of mapping individual trees [231, ourDCNN method of estimating the GVI metric produces a much faster aggregate
mea-sure of tree cover without extensive training data. Therefore, our method is more easily applied at the city-scale with limited computational resources. Moreover, ag-gregate measure of tree cover along streets, in and of itself, provides rich and useful information to a variety of stakeholders.
Early applications of DCNN in urban ecology and geospatial sciences have mainly focused on the accuracy of DCNN models. To date, there has been little to no DCNN and computer vision applications in urban ecology or GIS that have sought to under-stand the features learned and identified by DCNN models. As an active and impor-tant area of research amongst computer vision scientists, tools to interpret "black-box" DCNN models are important to visually validate trained models, ascertain that
trained models do not contain significant biases, and convince researchers from fields outside of computer vision about the decision process of "black-box" DCNN models. Therefore, for DCNN models that we employ, we use a visually interpretable method called gradient-weighted class activation map (Grad-CAM) [24] to understand the learned features extracted by our trained DCNN models.
Chapter 3
Quantifying Canopy Cover:
Methodology
3.1
Obtaining GSV training-validation-test dataset
We choose Cambridge (Massachusetts, USA), Johannesburg (South Africa), Oslo (Norway), Sio Paulo (Brazil), and Singapore (Singapore) as cities included in our training and test sets. The 5 cities chosen to for this paper are located in differing climatic regions, have various tree species assemblages and forms, and have varying levels of green cover according to the GVI scores estimated by the benchmark Treepe-dia unsupervised segmentation method. This diversity amongst cities should imply model generalization if strong predictive results are found. We use OpenStreetMap street network extracts of the 5 sample cities, and sample points 1 km apart on road networks. We then query the Google Maps API to determine the availability of GSV taken at sampled points. From each of the 5 cities, we randomly select 100 available
GSV images each to form a training-validation-test set. We then divide the 500 image
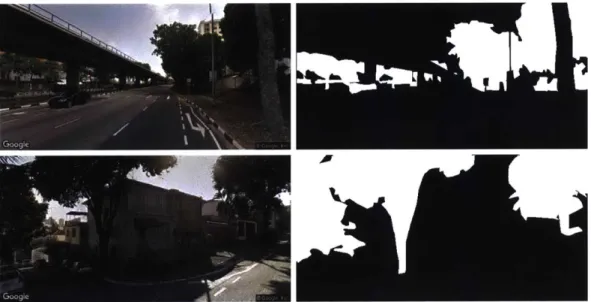
dataset into a 100 image test set, 320 image training set and a 80 image validation set. We produce manual labels by carefully tracing all vertical vegetation in the images for all 500 images (Figure 3-1).
-I
Figure 3-1: Top: GSV image in Singapore and associated vegetation labels. Bottom:
GSV image in Sio Paulo and associated vegetation labels.
Figure 3-2: Two sample images from Cityscapes dataset and their associated vegeta-tion labels
3.2
Augmenting training data
We augment our model training by first using the high-quality, pixel-labelled Cityscapes dataset to initially train our DCNN model. The Cityscapes dataset is currently one of the largest, most extensive and most richly annotated image dataset of city streetscapes to date [19]. The finely labelled subset of the Cityscapes dataset
con-tains over 5000 images taken from vehicle-mounted cameras placed in vehicles and sampled across numerous German cities. We also utilize the class labels for the Cityscapes dataset, which contain a class label for vertical vegetation. We convert the Cityscapes dataset by collapsing the original multi-class labels into binary labels for vegetation and non-vegetation (Figure 3-2). By first training our models on the larger Cityscapes dataset, we increase our training dataset with the aim of increasing our model performance.
3.3
Evaluation metrics
We propose two evaluation metrics to compare tree cover estimation:
for measuring the accuracy of the location of labelled vegetation labels, Absolute Error for measuring the accuracy in estimating overall GVI. The
of the two metrics are provided:
mean IoU and Mean definitions
3.3.1
Mean IoU
n = number of images in test set
TP = true positive predicted vegetation labels for image i FP = false positive predicted vegetation labels for image i
FN = false negative predicted vegetation labels for image i
TP n
-TPt + FP + FNt' IO =n
3.3.2
Mean Absolute Error
n = number of images in test set M = number of pixels in a single image
Vi = binary variable for pixel i, 1 indicates actual vegetation,
0 indicates actual non-vegetation
i = binary variable for pixel i, 1 indicates predicted vegetation,
0 indicates predicted non-vegetation
M n
1 -1
6i = I(Z/i -- 1) - I(Vi 1), = -Z 16. j=1
3.4
Models
Model Method Training and Calibration Prediction Output Benchmark Treepedia Mean shift unsupervised No training, calibrated by Fully pixel-segmented unsupervised segmentation segmentation 1201 Li. et al 14] on other GSV images GSV image
DCNN semantic Pyramid scene parsing Pre-trained on full Cityscapes dataset, Fully pixel-segmented segmentation network (PSPNet) [25] then trained on modified Cityscapes dataset, GSV image
with 65,818,363 parameters and finally on our labelled GSV dataset
DCNN end-to-end Deep residual Pre-trained on ImageNet dataset, Single real-valued GVI network (ResNet) [26] then trained on modified Cityscapes dataset, number between 0 and 1 with 28,138,601 parameters and finally on our labelled GSV dataset
Table 3.1: Summary of methods, training and calibration techniques and prediction output of models
3.4.1
Benchmark Treepedia unsupervised segmentation
We use Li. et al's original method as a benchmark metric to compare our performance against. Li. et al uses a mean shift segmentation algorithm that identifies "patches" in images with similar color characteristics 1201. Following the same calibrated threshold that the original Treepedia project used, the benchmark unsupervised segmentation method identifies "green" patches and labels them as vegetation pixels. Using this method, we can see that green but non-tree objects, such as grass or green-colored
objects like green shipping containers, can be misclassified (top image of Figure
3-3) as vegetation or trees. While the benchmark Treepedia approach has value in
approximating the visual perception of people on the street of the "green" attributes of the streetscape, there is potential for significant improvements through supervised learning of tree or vegetation visual features.
3.4.2
DCNN semantic segmentation
Semantic segmentation is a supervised learning problem. Therefore, unlike Li. et al's unsupervised approach, each pixel or patch of pixels is assigned a label of semantic meaning learned by the DCNN from prior training. We adopt Zhao. et al's
125]
Pyramid Scene Parsing Network (PSPNet)'s architecture for this purpose. PSPNet won the 2016 ImageNet Scene Parsing Challenge and is currently regarded as state-of-the-art for semantic segmentation. We first use pre-trained weights from the original PSPNet trained on the original Cityscapes datasets with its 19 class labels. We then remove the 19 sigmoid units in the last layer and replaced them with 2 sigmoid units. We then pre-train the network again on the aforementioned transformed Cityscapes dataset with only binary labels for vegetation a and non-vegetation. Finally, we train the network on the small labelled GSV dataset itself. Qualitatively, we see that the
DCNN semantic segmentation model avoids misclassifying objects as vegetation (top
image of Figure 3-4).
3.4.3
DCNN end-to-end learning
As an alternative approach to the pixel-wise segmentation of vegetation as described above to ultimately compute GVI, we directly estimate GVI with a DCNN model. To conduct end-to-end direct learning of a single GVI value for each image, we adapt He et al's [261 deep residual network (ResNet) architecture. Since He et al [26], other network architectures including PSPNet have widely adopted residual connections to allow for effective feature learning through a high number of convolutional layers. Using a 50 layered ResNet as the base architecture, we add 3 more layers of dense
connections at the end, with a final layer consisting of a single sigmoid unit. We first initialize the network with weights that have been pretrained on the ImageNet dataset. We then pre-train the modified ResNet with the transformed Cityscapes dataset and associated true GVI labels, before training on the small labelled GSV dataset. It is worth noting that our DCNN end-to-end model has 28,138,601 parame-ters, as compared to our DCNN semantic segmentation model, which has 65,818,363 parameters. At testing time, this difference implies that DCNN end-to-end model would outperform DCNN semantic segmentation as the reduced model complexity translates to an increased number of GSV images per evaluation batch.
3.5
Using Grad-CAM to visualize the DCNN
end-to-end model
The lack of an intermediate image segmentation mask makes it difficult to interpret the learning process of the DCNN end-to-end model. It becomes particularly diffi-cult to confirm or communicate the features that the DCNN end-to-end model has learned in order to estimate GVI. Selvaraju et al [24] developed Grad-CAM in order to produce visual explanations for features learned in particular convolutional layers. Through partial linearization and taking the rectified linear function of linear com-bination of feature maps and neural importance weights, we can visualize areas of the original input image that contribute positively to the prediction of a particular class. Selvaraju et al found that DCNN models may learn biases that may not be completely generalizable and may introduce unwanted prejudice, thus visualizing the active features can help identify those biases. Hence, we apply Grad-CAM to our
DCNN end-to-end model to understand whether our model has learned generalizable
Accuracy comparison between models. DCNN end-to-does not provide an intermediate image segmentation, possible to directly evaluate its mean IoU performance.
Model Mean IoU Mean Absolute Pearson's Correlation 5%-95% of GVI (%) Error (%) Coefficient Estimation Error (%) Benchmark Treepedia 44.7 10.1 0.708 -26.6, 18.7 unsupervised segmentation DCNN semantic 61.3 7.83 0.830 -20.0, 12,37 segmentation DCNN end-to-end NA 4.67 0.939 -10.9, 7.97 Table end hence 3.2: model it is not
Actual GVI: 21.9%, Estimated GVI: 40.6%
Absolute Error: 18.7%, IoU: 32.4%
Actual GVI: 25.0%, Estimated GVI: 3.07%
Absolute Error: 21.9%, IoU: 7.36%
Figure 3-3: Example results from segmentation algorithm from benchmark unsuper-vised segmentation method. Highlighted areas are patches labelled as vegetation with this method.
Actual GVI: 21.9%, Estimated GVI: 22.1%,
Absolute Error: 0.20%, IoU: 89.8%
Actual GVI: 25.0%, Estimated GVI: 5.22%,
Absolute Error: 19.78%, IoU: 20.4%
Figure 3-4: Example results from DCNN semantic segmentation algorithm adapted from PSPNet. Highlighted areas are patches labelled as vegetation with this method.
-. 1
Actual GVI: 21.9%, Estimated GVI: 27.5%,
Absolute Error: 5.55%
Actual GVI: 25.0%, Estimated GVI: 21.63%, Absolute Error: 3.37%
Figure 3-5: Example results from applying Grad-CAM on our trained DCNN end-to-end models. Areas closer to red have a more positive contribution to a higher prediction of GVI than the contribution of areas closer to blue.
Chapter 4
Quantifying Canopy Cover: Results
and Discussion
4.1
Model Performance
We find that DCNN models outperform the original Treepedia unsupervised segmen-tation model significantly (Table 3.2). DCNN semantic segmensegmen-tation achieve a higher Mean IoU and a lower Mean Absolute Error, while DCNN end-to-end achieve the low-est Mean Absolute Error out of all three models. Comparing the model results using the correlation coefficient between model predicted values and the labelled test set values, we find that the DCNN models significantly outperform the original unsuper-vised segmentation model (Table 3.2). Furthermore, we report the 5%-95% of the GVI estimation error to indicate the spread and centrality of the estimation errors. For this metric, we want the spread to be centered on 0 and we want the spread to be small. In this regard, we see that DCNN models outperform the original unsupervised model significantly in prediction accuracy.
An important clarification that we make is the generalizability of our validation results. We argue that our results are generalizable and can be applied broadly, as we utilized GSV images from a variety of climatic regions, levels of green cover, and geographic regions. Future studies in this area may want to expand the training and validation dataset used, so as to validate the generalizability of our results.
4.2
Interpretability of DCNN end-to-end model
The Grad-CAM method applied to our trained DCNN end-to-end model and test im-ages suggests that the DCNN end-to-end model learned to identify vertical vegetation in GSV images, without any noticeable systematic biases (Figure A-1).
4.3
Running time and scalability
Training and testing of the DCNN semantic segmentation and DCNN end-to-end learning models were conducted on a system equipped with a single NVIDIA 108OTi
GPU with 11GB of memory. The training of both models took about 48 hours of
training time each.
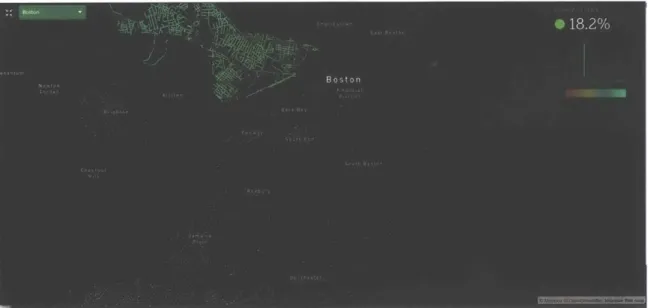
A critical issue that affects the quantification of urban tree cover is the scalability
of our GVI algorithm. Cities with complex and large street networks such as Boston and London can have up to 1 million GSV images (see Figure 4-1 and 4-1 for a sample visualization of trees in Boston and London). Therefore, fast evaluation time is essential towards the feasibility of large-scale quantification of a city's tree cover.
As a test of scalability, we tested the speed of our models in processing 100, 1000 and 10000 GSV images, and report the running time in terms of wall-clock time. To speed up computation, we parallelize the Python-based code for the benchmark Treepedia unsupervised segmentation, and we increase the evaluation batch size to the maximum that our single GPU system can handle. The ResNet-based DCNN end-to-end model evaluates 10000 GSV images under 40 seconds, which is a 0.1% of the evaluation time needed for the benchmark Treepedia unsupervised segmentation (Table 4.1). The DCNN end-to-end model is also significantly faster than the DCNN semantic segmentation model, due to the difference in model complexity resulting in a larger evaluation batches for the DCNN end-to-end model. Using linear extrapolation, our fastest model, the DCNN end-to-end model, can calculate the GVI of street-level images in a large city like London with 1 million images in slightly over one hour of processing time.
Model Running Time for Running Time for Running Time for
100 images (seconds) 1000 images (seconds) 10000 images (seconds)
Benchmark Treepedia 39.6 381 3665
unsupervised segmentation
DCNN semantic 20.2 207 2064
segmentation
DCNN end-to-end 1.81 4.06 38.9
Table 4.1: Running time of models in computing GVI
4.4
Discussion
We demonstrate the potential of deep learning in achieving better performance as measured by GVI correlation, Mean IoU and Mean Absolute Error, as compared to the original unsupervised segmentation models used in the Treepedia
[27]
project and website. Notably, our DCNN end-to-end model achieves both significantly better model performance and evaluation speed.Besides accuracy, we also introduce the use of Grad-CAM to inspect features learned by our DCNN end-to-end model. We find that our trained DCNN end-to-end model accurately learned to pick out vertical vegetation from GSV images without any noticeable biases.
By using street-level GSV images, we are able to utilize the abundance of
open-source manually labelled street-level image datasets to heavily pre-train our DCNN models. After pre-training, we tune our DCNN models to GSV images by training on a small-scale dataset. This saves significant resources that would normally be associated with building a large custom training dataset. Nonetheless, we produced a carefully curated and labelled training set specific to GSV images and vertical vegetation which will be released and hopefully built upon. It provides future researchers a benchmark validation set that they could use to compare their model performance with our models.
With an accurate, interpretable and efficient GVI estimation technique, city plan-ners can apply our models to understand the spatial distribution of urban greenery, and prioritize public tree maintenance and planting efforts. Our technique can also be confidently used by researchers for a wide variety of research topics that relies on
ac-curate estimations of urban greenery or tree cover including environmental inequality
[28]
and urban heat island models[29].
The collection of street-level images from Google, Baidu and Tencent represent one of the few geographically extensive, and informationally rich datasets available to researchers. By using DCNN models, researchers can utilize vast street-level image datasets to learn and understand complex environmental and socio-economic phenom-ena, in addition to urban tree cover. From setting metrics to measuring evaluation time, we demonstrate the process of rigorously applying deep learning to street-level images. Especially for researchers from fields including GIS and urban studies who lack computational resources, this section of my thesis serves as an example of an effective application of deep learning tools in a computationally efficient manner.
Figure 4-1: Visualization of large-scale quantification of urban greenery in Boston
Figure 4-2: Visualization of large-scale quantification of urban greenery in London
Chapter 5
Street Parking Estimation:
Introduction and Literature Review
5.1
Introduction
In cities, parking lots are costly in terms of space, construction and maintenance costs. Parking lots take up 6.57% of urban land use [30] and collectively make up nearly
7000 km2 of land use in the United States [31]. In U.S. cities, the area of parking lots
take up more than 3 times the area of urban parks
1301.
Government-set requirements for private developers' often require developers to provide parking lots to meet peak parking demand, resulting in an excessive number of parking lots with low utilization[30]. Construction costs (excluding land acquisition) of an average parking lot costs
nearly $20,000 in the United States, while the annual cost of maintaining a single parking lot ranges from $461 in Fort Collins, CO
132]
to $729 in San Francisco, CA[33].
Drivers also spend a significant amount of time looking for parking, overpay for what they use, and pay a high amount of parking fines. A recent study extrapolates 'These requirements can be seen in the municipal code of Placer County, CA: https: //qcode .us/ codes/placercounty/view.php?topic=17-2-vii-17_54-17_54_060. For example, the municipal code of Placer County states that restaurants are required to have 1 parking spot per 100 square feet of floor area, and shopping centers are required to have 1 parking spot per 200 square feet of floor area.
from surveys taken in 10 American cities, 10 British cities, and 10 German cities, and found that drivers in the United States, United Kingdom, and Germany spend averages of 17, 44 and 41 hours annually respectively to find parking 21341. In larger US cities, the search cost is significantly higher, with an estimated 107 hours annually in New York City and 85 hours in Los Angeles. This additional search time also contributes to congestion and air pollution in cities [351. The same survey found that drivers overpay fees for 13 to 45 hours of parking per annum, and also pay
$2.6b, 1.2b, and 6380m worth of parking fees annually in the United States, United
Kingdom and Germany[341.
Cities can benefit tremendously from a large-scale and accurate study of parking behavior. Especially with the possible transformation in land transportation brought on by autonomous vehicles, policymakers and urban planners would benefit from a scalable and accurate measurement and analysis of parking trends and activities. Additionally, real-time parking quantification method can also provide human or computer drivers with relevant parking information to reduce search time and allow for efficient route planning. In addition, a real-time parking measurement system can also enhance parking enforcement in cities, which cities are currently heavily investing in. Using May 2017 estimates by the Bureau of Labor Statistics, the labor costs in terms of just salary paid to parking enforcement officers amount to more than $350 million annually
136].
The City of New York is projected to spend $23.5 million in 2018 on paying for maintenance and enforcement of its parking meters and collections program [37]. The use of such a technical solution will allow these officers to have "eyes" on the ground, cover more parking lots with less physical effort, and increase municipal revenues from parking fines. A real-time, scalable and accurate parking measurement method is also a critical capability required by future parking system features, such as demand-based pricing138]
and reservation for street parking[391, that have the potential to make parking more convenient for drivers, and to
incentivize socially beneficial behavior.
2The parking search time in the United States, United Kingdom, and Germany translates to an
5.2
Existing quantification methods
Existing parking utilization methods can be divided into three types: counter-based, sensor-based and image-based
1401.
Counter-based methods are restricted to deploy-ment in gated parking facilities, and they work by counting the number of vehicles that enter and exit the parking facility. Sensor-based methods rely on physical de-tection sensors that are placed above or below parking lots, but are constrained by the significant capital costs of the large number of physical sensors required to cover large parking facilities140].
Image-based methods rely on camera systems and are able to cover large outdoor or indoor parking lots when there are suitably high and unobstructed vantage points. Image-based methods also contain richer but less struc-tured information than counter-based and sensor-based methods; for example, it is possible to identify specific vehicle characteristics from image-based methods but it is difficult to do so using counter-based or sensor-based methods.Huang et al
141]
further divide image-based methods into car-driven and space-driven methods. Car-space-driven methods primarily detects and tracks cars, and use car-detection results to quantify parking usage. Traditional object car-detection methods such as Viola et al [42] that rely on "simple" image representations and learning from training examples have been applied to identify vehicles in videos taken of parking lots by Lee et al143]
and Huang et al1411.
Space-driven methods
However, due to potential occlusions and perspective distortions of camera systems
144],
existing studies have instead focused on space-driven methods. Space-drivenmethods primarily observe changes in highlighted parking lots in an image frame. Past studies have used methods ranging from texture classifiers [40], support vector machines [451 and even recent deep learning-based methods
144,461
to classify whether a parking space is occupied. These methods however rely on extensive, manual and relatively niche task labelling of the occupancy status of parking spots. For example, de Almeida et al [40] manually labelled 12,417 images of parking lots across multipleparking lots on the campus of Federal University of Parana (UFPR) and the Pontifical Catholic University of Parana (PUCPR) located in Curitiba, Brazil. Besides the extensive effort required in obtaining image datasets and labelling them, the data collection process of parking spaces requires individual parking facilities to agree to data sharing and distribution. Fundamentally, space-based methods are not highly scalable, as they require extensive labelling and re-training of models for every distinct parking facility.
Figure 5-1: Top 3 images show the 3 different perspectives that the PKLot dataset by Almeida et al
140]
is obtained from. Bottom 3 images show 3 sample images that is in the COCO dataset, reflecting the diverse contexts that object instances are identified in.Car-driven methods
On the other hand, recent advancement in generic object detection through large-scale community projects led by organizations such as Microsoft [47] have allowed for access to large open datasets with more than 200,000 labelled images with more than
1.5 million object instances
1481.
The labelled instances include labels for different motor vehicles, including trucks, buses, cars, and motorcycles, and are taken in a variety of contexts and image quality. We provide samples of 3 images from the popular and open Common Objects in Context (COCO) dataset at the bottom of Figure 5-1. On the other hand, at the top three pictures in Figure 5-1, we see that the extensive dataset labelled by de Almeida et al [40] consists of images taken fromonly 3 spots.
Past work in car-based parking quantification relies on traditional object detection
141].
An example of such a method is proposed by Tsai et al [49 that uses color to identify vehicle candidates, and trains a model that uses corners, edge maps and wavelet transform coefficients to verify candidates. While traditional computer vision techniques are able to achieve good levels of accuracy, they rely heavily on feature selection by researchers and hence may be sub-optimal. On the contrary, deep learning based computer vision techniques are able to automatically select and identify features in a hierarchical manner1l, 501.Figure 5-2: Zhou et al [1] visualizes features automatically learned by a DCNN model trained to distinguish scenes. Lower level features such as edges are learned in earlier layers of DCNN models, as shown on the left. These lower level features are combined to higher level abstractions like shapes in later layers of DCNN models, as shown on the right.
Figure 5-2 from Zhou et al [11 shows the hierarchy of features learned by a DCNN method to classify different scenes. The trained DCNN model first learns to combine different lower-level features such as edges from raw pixels to form higher-level features like shapes, and classify scenes based on higher-level abstractions. Hence, a key contribution of this paper is to adapt and apply recent developments in deep learning based computer vision models to quantify parking.
Chapter 6
Street Parking Estimation:
Experiment and Methodology
6.1
Experiment and Data Collection
E S DE Landmarks Kendall CAM RID
SRIE I ,k Square cinema G
~il.4
9 Shanghai Fresh T H P R T N9MK Roya Sonesta Bot
H ar udio RO Tos Hmai Cambridges
/
I ~~Washnton El:d Middle East 9 r s Broad Instld/m
i %%/-- BostdnMarriottfU'
/'S~MIT
Musqa man SMus SOs -i /1'-LKendall
arket
9ISO
4~,~
MIT SloanShoIarketn
44Y V -a of4
CAMBRIDGEPORT
Trader 's 19
Micro Cek9 C Dimhtrios Cuisine Hatch Memor
9mrBrig
Magazine \ o
c Hyatt Reqncy10 g
9
Figure 6-1: Locations of street parking where video data was collected
As part of Senseable City Lab's sponsored project with Phillips, we collected 3 days of video footage of street parking around the MIT campus area in the City of Cambridge. The locations of the studied parking lots can be seen in Figure 6-1. A summary of the sites is provided in Table 6.1.
Site Name Footage Length Site Description (minutes)
Facilities 1696.5 Four parking lots without lot boundaries.
Camera mounted across street with small chance of occlusions.
IDC 3622.5 Four parking lots with clear lot boundaries.
Camera mounted at a high vantage point with no chance of occlusion.
Museum 3140.5 Four parking lots with clear lot boundaries. Camera mounted at a low vantage point and across the street with high chance of occlusions.
Table 6.1: Descriptive summary of experiment sites
The video footages were taken in the summer of 2017. The footage was collected from the duration of 04:00:00 to 23:59:59 therefore include footages when lighting conditions are not ideal. This is explained further later in the implementation chal-lenges, and our validation results in Section V differentiates the complete results from results taken during visible and peak hours. We define visible and peak hours as the duration from 07:00:00 to 18:59:59, which overlaps with most durations when street parking requires payment, and when natural lighting is substantial.
6.2
Methodology
6.2.1
Instance Segmentation
We use the car-based method on images obtained. Unlike the space-based method, the car-based method depends on having an accurate and generalizable vehicle detec-tor. The space-based method relies on classifying whether a specific parking space is occupied or not; this requires hand-labelling a specific parking facility and training a model that may not be generalizable to parking facilities other than the one that has been labelled.
For the task of accurately quantifying parking space utilization, we utilize recently developed and state-of-the-art instance segmentation computer vision algorithms. In-stance segmentation can be seen as a combination of two other well-established tasks in computer vision: object detection and semantic segmentation. Object detection is the task of identifying individual instances of particular object classes and locating these instances with bounding boxes. Semantic segmentation is the task of
classi-IJ
fruc1'
rsowc car per nn person
io
personperson person P
sn person
W
..
Mt"
Figure 6-2: Top left image shows the results of the object detection algorithm, which detects object classes and localizes them with a rectangular bounding box. Top right image shows the result of semantic segmentation algorithm, which labels every pixel in an image with an object class. Bottom image shows the result of the instance segmentation algorithm used in this study, which detects object classes of interests, localizes them with a bounding box, and also provides a pixel-level localization or mask of identified objects.
fying individual pixels into object classes without distinguishing between separate instances. Therefore, instance segmentation allows us to simultaneously identify in-dividual instances of vehicles and precisely locate the boundaries of identified vehicle instances.
There has been significant progress in the deep learning-based object detection and semantic segmentation literature that have enabled real-time and accurate per-formance. In the area of object detection, Ren et al [51] overcame a significant bottleneck in past object detection algorithms by replacing time-consuming tradi-tional region proposal methods such as Selective Search [52] and EdgeBoxes [531 with a learnable and fast Region Proposal Network (RPN). Redmon et al [54] added new and effective features such as RPN and also introduced a novel multi-scale training method in the YOLOv2 algorithm. For semantic segmentation, Long et al [551 demon-strated that fully convolutional neural networks perform better than past neural net architectures with downsampling and upsampling. Yu et al
156,571
introduced dilated convolutions that widen receptive fields of convolutional units, while Zhao et al [251 added multi-scale training and evaluation that significantly improved performance.The algorithm that we employ for our purposes is based a Tensorflow implemen-tation of He et al's [58] Mask Region-based Convolutional Neural Network
(Mask-RCNN). Based on Ren et al's [51J Faster-RCNN algorithm, Mask-RCNN adds a
branch that predicts a mask or region-of-interest that serves as the pixel segmenta-tion within the bounding boxes of each identified object instance. The simultaneous training and evaluation processes allow for fast training and real-time evaluation. Our Mask-RCNN implementation is trained on the COCO dataset, which has over
330 thousand training images, 1.5 million object instances and 80 distinct object
categories, including cars, trucks, motorcycles and other motor vehicles.
6.2.2
Parking Identification
Parking lots are identified and surrounding road-areas are identified via hand-drawn labels. Using a simple area-based threshold, vehicles with a significant proportion of its area located in road-areas are determined to be either not parked or obstructions.
200 400 ___ -fif F 1W- - - -- -10001 1200 0 200 400 WO0 1000 120C 0-400 600 1000 1200
Figure 6-3: Experiment sites with drawn parking lots and surrounding road areas. Top left image shows the Facilities site, top right image shows the IDC site, and bottom image shows the Museum site.
Figure 6-3 shows the identified parking lots in red and the surrounding road-areas in blue for all 3 studied sites.
6.2.3
Implementation Challenges
We quantify parking utilization of lot i and time t as the ratio of the space utilization in the horizontal or x dimension and the horizontal space of lot i:
Occupied horizontal space g Horizontal spacei UtiCzation
Car 1
Car2 Car34-+
.-07-10 13 07-10 14 07-10 15 07-10 16
6-4: Sample of noisy raw utilization measurements car stay durations are drawn on top.
07-10 17 07-10 18
from lot 3 of Museum site.
Using this measure, we find that a straightforward application of Mask-RCNN resulted in a noisy measurement of lot utilization. We directly applied Mask-RCNN to the recorded footages sampled at every 15 seconds, used the method described in
6.2.2 to identify vehicles that are parked, and applied the above definition to obtain
parking utilization. For illustrative purposes, we focus on a particular duration of time at the Museum site, and provide the utilization measurements and actual car
0 40 20 01 07-10 12 Figure Actual
Ai
/ V
k r
/
-d ' I LAJstays during this duration for a single lot in Figure 6-4.
There are three factors that contribute to the noise seen in the utilization mea-surements:
1. Occlusion: As mentioned in the literature review, a significant challenge for
car-based methods is possible occlusion [441 of parking spots and observed ve-hicles. In the data collected by the Senseable City Lab, the occlusion problem is particularly severe for the Museum site. Data at the Museum site was col-lected via a camera mounted in the building across from the parking lots. This vantage point however is at a relatively low angle relative to the parking lots, hence data collected from this site is often obstructed by vehicles in the street between the camera and the parking lots of interest. Figure 6-5 provides a side-by-side example of an unobstructed and occluded view of street parking lots at the Museum site.
2. Weather and lighting conditions: Weather and lighting conditions can
cause significant problems to detection. Figure 6-6 provides a side-by-side example of the Museum site that illustrates the effect of changes in lighting conditions
N1
W--Figure 6-5: Unobstructed and occluded view of street parking lots at the Museum Site


![Figure 5-1: Top 3 images show the 3 different perspectives that the PKLot dataset by Almeida et al 140] is obtained from](https://thumb-eu.123doks.com/thumbv2/123doknet/14050423.460105/42.917.133.776.352.618/figure-images-different-perspectives-pklot-dataset-almeida-obtained.webp)
![Figure 5-2: Zhou et al [1] visualizes features automatically learned by a DCNN model trained to distinguish scenes](https://thumb-eu.123doks.com/thumbv2/123doknet/14050423.460105/43.917.135.778.425.652/figure-visualizes-features-automatically-learned-trained-distinguish-scenes.webp)
