HAL Id: hal-03206163
https://hal.archives-ouvertes.fr/hal-03206163
Submitted on 24 Apr 2021
HAL is a multi-disciplinary open access
archive for the deposit and dissemination of
sci-entific research documents, whether they are
pub-lished or not. The documents may come from
teaching and research institutions in France or
abroad, or from public or private research centers.
L’archive ouverte pluridisciplinaire HAL, est
destinée au dépôt et à la diffusion de documents
scientifiques de niveau recherche, publiés ou non,
émanant des établissements d’enseignement et de
recherche français ou étrangers, des laboratoires
publics ou privés.
An assessment of the carbon balance of Arctic tundra:
comparisons among observations, process models, and
atmospheric inversions
A. Mcguire, T. Christensen, D. Hayes, A. Heroult, E. Euskirchen, J. Kimball,
C. Koven, P. Lafleur, P. Miller, W. Oechel, et al.
To cite this version:
A. Mcguire, T. Christensen, D. Hayes, A. Heroult, E. Euskirchen, et al.. An assessment of the
carbon balance of Arctic tundra: comparisons among observations, process models, and atmospheric
inversions. Biogeosciences, European Geosciences Union, 2012, 9 (8), pp.3185-3204.
�10.5194/bg-9-3185-2012�. �hal-03206163�
www.biogeosciences.net/9/3185/2012/ doi:10.5194/bg-9-3185-2012
© Author(s) 2012. CC Attribution 3.0 License.
Biogeosciences
An assessment of the carbon balance of Arctic tundra: comparisons
among observations, process models, and atmospheric inversions
A. D. McGuire1, T. R. Christensen2,3, D. Hayes4, A. Heroult2, E. Euskirchen5, J. S. Kimball6, C. Koven7, P. Lafleur8, P. A. Miller2, W. Oechel9, P. Peylin10, M. Williams11, and Y. Yi61U.S. Geological Survey, Alaska Cooperative Fish and Wildlife Research Unit, University of Alaska Fairbanks, Fairbanks,
AK, USA
2Department of Earth and Ecosystem Science, Lund University, Lund, Sweden 3Greenland Climate Research Centre, Nuuk, Greenland
4Oak Ridge National Laboratory, Oak Ridge, TN, USA
5Institute of Arctic Biology, University of Alaska Fairbanks, Fairbanks, AK, USA
6Flathead lake Biological Station, Division of Biological Sciences, the University of Montana, Missoula, MT, USA 7Lawrence Berkeley National Laboratory, Berkeley, CA, USA
8Department of Geography, Trent University, Peterborough, ON, Canada 9Department of Biology, San Diego State University, San Diego, CA, USA
10Laboratoire Sciences Climat Environnement, Institut Pierre Simon Laplace, Paris, France 11School of GeoSciences, University of Edinburgh, Edinburgh, UK
Correspondence to: A. D. McGuire (admcguire@alaska.edu)
Received: 23 January 2012 – Published in Biogeosciences Discuss.: 17 April 2012 Revised: 8 July 2012 – Accepted: 23 July 2012 – Published: 17 August 2012
Abstract. Although Arctic tundra has been estimated to
cover only 8 % of the global land surface, the large and po-tentially labile carbon pools currently stored in tundra soils have the potential for large emissions of carbon (C) under a warming climate. These emissions as radiatively active greenhouse gases in the form of both CO2and CH4 could
amplify global warming. Given the potential sensitivity of these ecosystems to climate change and the expectation that the Arctic will experience appreciable warming over the next century, it is important to assess whether responses of C ex-change in tundra regions are likely to enhance or mitigate warming. In this study we compared analyses of C exchange of Arctic tundra between 1990 and 2006 among observa-tions, regional and global applications of process-based ter-restrial biosphere models, and atmospheric inversion mod-els. Syntheses of flux observations and inversion models in-dicate that the annual exchange of CO2between Arctic
tun-dra and the atmosphere has large uncertainties that cannot be distinguished from neutral balance. The mean estimate from an ensemble of process-based model simulations sug-gests that Arctic tundra has acted as a sink for atmospheric
CO2 in recent decades, but based on the uncertainty
esti-mates it cannot be determined with confidence whether these ecosystems represent a weak or a strong sink. Tundra was 0.6◦C warmer in the 2000s compared to the 1990s. The
cen-tral estimates of the observations, process-based models, and inversion models each identify stronger sinks in the 2000s compared with the 1990s. Some of the process models dicate that this occurred because net primary production in-creased more in response to warming than heterotrophic res-piration. Similarly, the observations and the applications of regional process-based models suggest that CH4emissions
from Arctic tundra have increased from the 1990s to 2000s because of the sensitivity of CH4emissions to warmer
tem-peratures. Based on our analyses of the estimates from ob-servations, process-based models, and inversion models, we estimate that Arctic tundra was a sink for atmospheric CO2of
110 Tg C yr−1(uncertainty between a sink of 291 Tg C yr−1
and a source of 80 Tg C yr−1) and a source of CH 4 to the
atmosphere of 19 Tg C yr−1(uncertainty between sources of
8 and 29 Tg C yr−1). The suite of analyses conducted in this study indicate that it is important to reduce uncertainties in
3186 A. D. McGuire et al.: Assessment of the carbon balance of Arctic tundra
the observations, process-based models, and inversions in order to better understand the degree to which Arctic tun-dra is influencing atmospheric CO2and CH4concentrations.
The reduction of uncertainties can be accomplished through (1) the strategic placement of more CO2and CH4monitoring
stations to reduce uncertainties in inversions, (2) improved observation networks of ground-based measurements of CO2
and CH4 exchange to understand exchange in response to
disturbance and across gradients of climatic and hydrological variability, and (3) the effective transfer of information from enhanced observation networks into process-based models to improve the simulation of CO2and CH4exchange from
Arc-tic tundra to the atmosphere.
1 Introduction
The distribution of the Arctic tundra biome covers approx-imately 8 % of the global land surface, largely north of the boreal forest treeline (McGuire et al., 1997). The exact lo-cation of the biome’s southern border is subjective, with the transition between closed boreal forest and treeless tundra up to several hundred kilometers wide in regions of low to-pographic relief (Vlassova, 2002; Callaghan et al., 2005). Climate in the Arctic is harsh, characterized by cold win-ters and cool summers, with mean July temperatures below
∼12◦C (Callaghan et al., 2005) and annual mean temper-atures typically below −10◦C (New et al., 1999). Conse-quently, plant growth is restricted to a relatively short grow-ing season on the order of three months or less durgrow-ing the boreal summer. The tundra biome is home to approximately 1800 species of vascular plants and has less species diversity than more temperate biomes (Asner et al., 2003; Callaghan et al., 2005). The stature of vascular plant species is lim-ited by environmental conditions, with trees almost entirely absent and woody plant species restricted largely to shrubs and dwarf shrubs. In addition to vascular plant species, non-vascular mosses and lichens play a very important role in the structure and function of tundra ecosystems. Frozen soils are prevalent in northern high latitudes and there is a gra-dient of continuous to discontinuous permafrost from north to south. Most of the tundra biome is underlain by continu-ous permafrost. The spatial and temporal dynamics of per-mafrost and periodic disturbance are crucial in shaping the arctic landscape and its heterogeneity, with important conse-quences for the areal extent of wetlands and the exchange of carbon dioxide (CO2) and methane (CH4).
Future climate warming is predicted to be pronounced over the Arctic, especially during winter and spring. The arctic autumn and winter are expected to warm between 3 and 6◦C by 2080 (SWIPA Assessment Executive Summary, 2011), which is expected to lead to longer growing seasons, thawing of permafrost, warming and deepening of the soil active layer, and large changes in hydrology. These changes
are likely to substantially affect tundra ecosystem structure and function. In fact, there is increasing evidence that physi-cal and ecologiphysi-cal changes are already occurring throughout the tundra biome (Serreze et al., 2003, Hinzman et al., 2005; McDonald et al., 2004; Piao et al., 2008, 2011; Post et al., 2009; Rawlins et al., 2010; Rowland et al., 2010; Beck and Goetz, 2011; Kim et al., 2012).
The large and potentially labile carbon (C) pools currently stored in Arctic soils (Ping et al., 2008; Tarnocai et al., 2009) have the potential to be emitted as radiatively active green-house gases in the form of both CO2and CH4under warmer
conditions (Schuur et al., 2008, 2011; Chapin et al., 2008; McGuire et al., 2009; Schaefer et al., 2011; Koven et al., 2011). Whether the emissions of CO2from tundra soils tends
to amplify or mitigate global warming depends on the degree to which C accumulation in tundra plants responds to warm-ing (Sitch et al., 2007). This balance determines whether the tundra is a source or sink of CO2. Changes in the emissions
of CH4may also affect the degree to which tundra amplifies
or mitigates global warming. While CH4 has only a small
role on the mass balance of C between the atmosphere and tundra, it is a highly potent greenhouse gas. Changes in CH4
emissions are likely to be strongly linked to changes in hy-drology (Merbold et al., 2009). Current emissions of CH4are
difficult to quantify due to substantial variability in time and space due to variations in the environment associated with topography, hydrology, and soil chemistry.
Because of the substantial changes that are already affect-ing the structure and function of Arctic tundra, it is impor-tant to assess how C exchange of Arctic tundra has been changing in recent decades. The response of C dynamics of Arctic tundra to environmental change can be evaluated through a synthesis of (1) observations of C exchange with the atmosphere, (2) the application of process-based mod-els, and (3) the analysis of atmospheric inversion models of C exchange with the atmosphere. Each of these scaling ap-proaches has it strengths, weaknesses, and limitations in as-sessing the carbon dynamics of Arctic tundra. In this paper we compare analyses of C dynamics of Arctic tundra in the two most recent decades among the three scaling approaches to gain insight on how C exchange of Arctic tundra may be responding to ongoing environmental changes. The analysis in this paper represents the Arctic tundra contribution to the Global Carbon Project’s REgional Carbon Cycle and Assess-ment Processes (RECCAP) synthesis (Canadell et al., 2011).
2 Methods
2.1 Estimates from flux observations
Methods for ground-based observation of the exchange of C between land and atmosphere face great challenges in Arc-tic environments. The challenges include (1) comprehensive spatial coverage in the face of a heterogeneous landscape
mosaic that is often characterized by “hot spots”; (2) contin-uous sampling to achieve full year-round estimates of carbon dynamics; (3) high temporal resolution to sample episodic exchanges of CO2and CH4; and (4) collection of C exchange
data without line power in remote conditions.
A single technique is not available that meets all of these challenges. Currently, manual chambers, automatic cham-bers, and eddy covariance towers are the primary techniques being used to measure C exchange between tundra with the atmosphere. For CO2 flux measurements, these sampling
techniques are linked to infrared gas analyzers that measure CO2 concentrations. For CH4, the field technology is less
developed, and has relied on gas sample collection in the field, with laboratory estimates of CH4concentrations using
gas chromatographs. Eddy covariance measurement systems have recently been developed that allow continuous direct CH4concentration estimates in the field, and these are
start-ing to be more commonly used to measure CH4 exchange
(e.g., Rinne et al., 2007; Jackowicz-Korczynski et al., 2010). In Table 1 we compare the relative performance of these methods for a number of requirements and considerations. Because typical tundra areas are heterogeneous, it is often necessary to employ chamber methods of measurement to differentiate the C exchange for the individual components (e.g., soil, moss, and vascular plants) and to better under-stand the underlying processes of land–atmosphere C ex-change. Chamber-based measurements complement tower-based measurements that more effectively integrate across a heterogeneous landscape. In Supplement 1 we have compiled approximately 250 estimates from 120 published papers of the mean exchange of CO2and CH4between Arctic tundra
and the atmosphere at growing season, winter season, and annual time scales based on published observational studies. The exchange of CO2with the atmosphere is reported as net
ecosystem exchange (NEE), i.e., net land–atmosphere CO2
flux, in which a positive NEE represents a loss of CO2from
tundra to the atmosphere. Similarly, the exchange of CH4is
reported as a positive flux when the net exchange is to the atmosphere and as a negative flux when the net exchange is into the ecosystem. Both CO2 and CH4estimates are
re-ported in units of C. In this study we used only estimates of CO2and CH4exchange from Supplement 1 for the time
period between 1990 and 2009 unless stated otherwise.
2.2 Estimates from process-based models
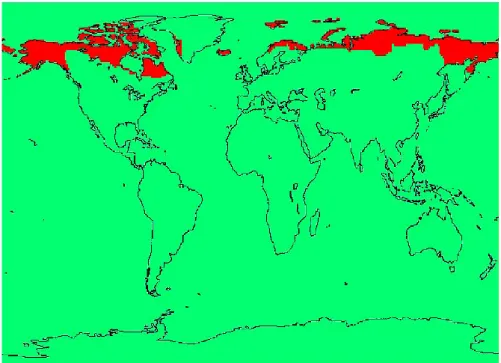
The spatial domain of Arctic tundra we considered in this study (Fig. 1) was defined by the Regional Carbon Cycle As-sessment and Processes (RECCAP) Activity. It is important to note that the spatial domain of Arctic tundra was defined from an atmospheric perspective as a region that could po-tentially be resolved by the applications of inversion mod-els. The region extends into boreal forest in some areas (for example in western North America). In this study we com-pare the carbon dynamics of Arctic tundra between 1990
Table 1. A summary of the technical performance different flux
measurement techniques. ++ means high performance, + means ad-equate performance, − means less than adad-equate performance, and
−−means poor performance.
Eddy covariance Automatic chambers Manual chambers Steady state, undisturbed measurement ++ +/− − Integration over spatial variability ++ −(quantity of chambers vs. mosaic) −(quantity of chambers vs. mosaic) Direct measure-ment of small scale spatial variability −− + ++ Tracking tempo-ral variability ++ ++ −(campaigns as basis for modeling) Costs −− −− ++ Workload ++ + – Performance under all climate conditions
+/− +/− ++
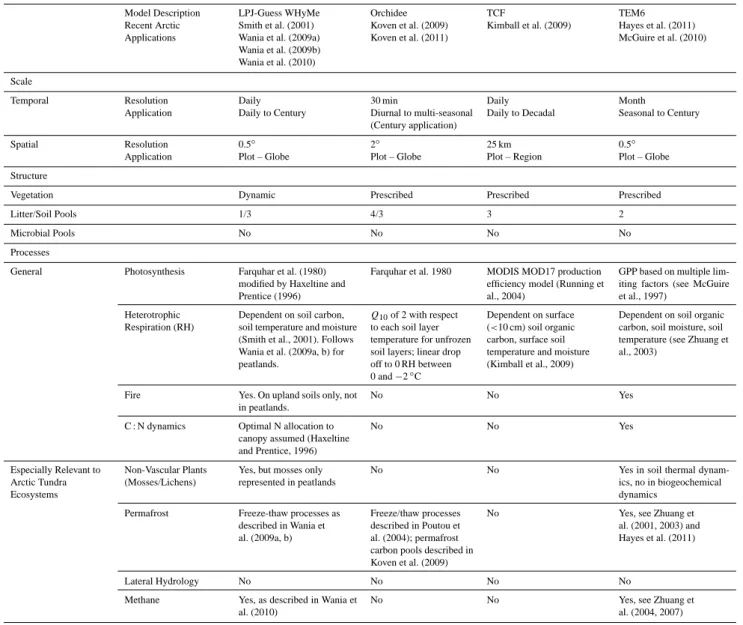
and 2006 estimated by regional applications of three mod-els that have focused on representing processes in ecosys-tems underlain by permafrost: LPJ-Guess WHyMe (Smith et al., 2001; Wania et al., 2009a, b, 2010; Hickler et al., 2012), Orchidee (Koven et al., 2009, 2011), and version 6 of the Terrestrial Ecosystem Model (TEM6; McGuire et al., 2010; Hayes et al., 2011). For evaluating the production estimates of the three regional process-based models, we have also in-cluded the Terrestrial Carbon Flux (TCF) model (Kimball et al., 2009) in the regional process-based model analysis. The general features of the models are compared in Table 2 (see Supplement 2 for more details).
The TCF is unique among the models in that it is partially driven by satellite-based vegetation gross primary production (GPP) estimates from the NASA Moderate Resolution Imag-ing Spectroradiometer (MODIS) for the period between 2000 and 2009 (Zhao and Running, 2010). The MODIS (MOD17) GPP estimates are used to derive vegetation net primary pro-duction (NPP), while heterotrophic respiration (RH) is de-termined from a simulated surface (< 10 cm depth) soil or-ganic carbon pool and dynamic soil moisture and temper-ature constraints to litter decomposition. The TCF does not account for other carbon emission sources, including fire dis-turbance, so NEE is derived as the residual difference be-tween NPP and RH, and assumed equivalent to net ecosystem production (NEP). The TCF calculations assume dynamic
3188 A. D. McGuire et al.: Assessment of the carbon balance of Arctic tundra
Fig. 1. The Arctic Tundra RECCAP Region.
steady-state conditions between NPP and RH so that esti-mated NEE / NEP has no trend over the decade from 2000 to 2009. The other three models were driven in a prognos-tic fashion by atmospheric CO2 and climate data of their
own choosing over the simulation period. Because of each model’s choice of climate data, both LPJ-Guess WHyMe and TEM6 produced estimates for only the 1990–2006 time period. Therefore, we only compare 2000–2006 among the models in the most recent decade. See Supplement 2 for more details on the application of the regional models in this study. All models estimate GPP, NPP, RH, and NEP. Both LPJ-Guess and TEM6 make estimates of losses of carbon to the atmosphere associated with fire and biogenic CH4emissions.
In addition, TEM6 also calculates ecosystem losses of car-bon from the export of harvested products and dissolved or-ganic carbon. For each of the models we also calculate the net ecosystem carbon balance (NCB) as the sum of NPP and the atmospheric and export losses. The sign conventions for NEP and NCB are positive for a net flux of carbon into the ecosystem. We also report net CO2-C exchange with a sign
convention of positive representing a source to the atmo-sphere and negative representing a sink into tundra ecosys-tems. In this study, we compare the mean C budget estimated from 1990–1999 and 2000–2006 among simulations of LPJ-Guess WHyMe, Orchidee, and TEM6. We also report net CO2-C exchange for each of the models as previously
de-fined. We also provide mean GPP and NPP estimates sim-ulated by TCF for 2000–2006. To explore issues involving the mean seasonal cycle of CO2exchange, we compare the
mean monthly flux estimates for GPP, NPP, RH, and NEP for 1990–2006 simulated by LPJ-Guess, Orchidee, and TEM6, and for 2000–2006 simulated by TCF. We also compare in-terannual variability for estimates of GPP, NPP, RH, NEP, other atmospheric losses, export losses, and NCB among the models. To explore the importance of changing climate on the regional applications of the process-based models, we conducted additional simulations that were driven by stant climate keeping all other drivers unchanged. The con-stant climate for the three models was based on the 1901– 1930 climate used to drive their transient simulations. We estimate the effect of a changing climate on NPP, RH, and NEP between 1990 and 2006 by subtracting the estimates of the constant climate simulation of each model from that of the corresponding transient climate simulation.
The RECCAP activity is also comparing the mean C bud-gets for the 1990s and 2000s estimated by a suite of global applications of dynamic global vegetation models (DGVMs). These DGVM applications were conducted as part of the Trendy project (http://dgvm.ceh.ac.uk) to examine trends in the net land C exchange over the period 1980–2009. In this study we compare the mean C budget of these global ap-plications for the Arctic tundra region of this study for the time periods 1990–1999 and 2000–2006. The DGVM ap-plications compared in this study include contributions from CLM4C (Lawrence et al., 2011), CLM4CN (Thornton et al., 2007, 2009; Bonan and Levis 2010; Lawrence et al., 2011), Hyland (Levy et al., 2004), LPJ (Sitch et al., 2003), LPJ-Guess (Smith et al., 2001), O-CN (v0.74; Zaehle and Friend,
Table 2. Description of process-based models compared in this study. See Supplement 2 for additional details. Model Description Recent Arctic Applications LPJ-Guess WHyMe Smith et al. (2001) Wania et al. (2009a) Wania et al. (2009b) Wania et al. (2010) Orchidee Koven et al. (2009) Koven et al. (2011) TCF Kimball et al. (2009) TEM6 Hayes et al. (2011) McGuire et al. (2010) Scale
Temporal Resolution Daily 30 min Daily Month
Application Daily to Century Diurnal to multi-seasonal (Century application)
Daily to Decadal Seasonal to Century
Spatial Resolution 0.5◦ 2◦ 25 km 0.5◦
Application Plot – Globe Plot – Globe Plot – Region Plot – Globe Structure
Vegetation Dynamic Prescribed Prescribed Prescribed
Litter/Soil Pools 1/3 4/3 3 2
Microbial Pools No No No No
Processes
General Photosynthesis Farquhar et al. (1980) modified by Haxeltine and Prentice (1996)
Farquhar et al. 1980 MODIS MOD17 production efficiency model (Running et al., 2004)
GPP based on multiple lim-iting factors (see McGuire et al., 1997)
Heterotrophic Respiration (RH)
Dependent on soil carbon, soil temperature and moisture (Smith et al., 2001). Follows Wania et al. (2009a, b) for peatlands.
Q10of 2 with respect
to each soil layer temperature for unfrozen soil layers; linear drop off to 0 RH between 0 and −2◦C
Dependent on surface (<10 cm) soil organic carbon, surface soil temperature and moisture (Kimball et al., 2009)
Dependent on soil organic carbon, soil moisture, soil temperature (see Zhuang et al., 2003)
Fire Yes. On upland soils only, not in peatlands.
No No Yes
C : N dynamics Optimal N allocation to canopy assumed (Haxeltine and Prentice, 1996) No No Yes Especially Relevant to Arctic Tundra Ecosystems Non-Vascular Plants (Mosses/Lichens)
Yes, but mosses only represented in peatlands
No No Yes in soil thermal
dynam-ics, no in biogeochemical dynamics
Permafrost Freeze-thaw processes as described in Wania et al. (2009a, b)
Freeze/thaw processes described in Poutou et al. (2004); permafrost carbon pools described in Koven et al. (2009)
No Yes, see Zhuang et
al. (2001, 2003) and Hayes et al. (2011)
Lateral Hydrology No No No No
Methane Yes, as described in Wania et al. (2010)
No No Yes, see Zhuang et
al. (2004, 2007)
2010), SDGVM (Woodward et al., 1995; Woodward and Lo-mas, 2004), and TRIFFID (Cox, 2001). The models used a common protocol (http://dgvm.ceh.ac.uk) applying CRU-NCEP climatology over the period 1901–2009. Note that the global application of LPJ-Guess is quite different from the re-gional application of LPJ-Guess WHyMe, which represents processes relevant to Arctic tundra function and structure in-cluding (1) soil water freezing; (2) Arctic shrub and open ground plant functional types (e.g., Sphagnum mosses and tundra graminoids); (3) peatland hydrology, decomposition, and plant functional types; (4) a methane module for peat-lands; and (5) root exudates (see Supplement 2 for details).
2.3 Estimates from inversion-based models
We also analyzed the mean land–atmosphere CO2-C
ex-change for the Arctic tundra domain from a set of ten
inversion models that were applied in support of RECCAP analyses (Gurney, 2012). The inversion models include C13 CCAM law, C13 MATCH rayner, CTRACKER EU, CTRACKER US, JENA s96 v3.3, JMA 2010, LSCE an v2.1, LSCE var v1.0, NICAM niwa woaia, and rigc patra. Among these inversion models, the applica-tions span the time period from 1985–2009. However, the period of application is highly variable among the models. We report the mean NEE estimate for Arctic tundra from 1990–1999 and 2000–2006 for eight of the applications of these inversion models; we do not report the results from CTRACKER EU or CTRACKER US as these models did not start making estimates until 2001. We report the mean season cycle of CO2-C exchange estimates based on the time
period of application of each of the ten models. Similarly, we report the interannual variability of NEE anomalies across
3190 A. D. McGuire et al.: Assessment of the carbon balance of Arctic tundra
the time period of application of each of the ten models. We include CTRACKER EU and CTRACKER US in the seasonal cycle and interannual variability analyses.
3 Results
3.1 Estimates based on flux observations 3.1.1 CO2exchange
Most direct observational studies of the exchange of CO2
be-tween tundra and the atmosphere have been conducted dur-ing the summer growdur-ing season. These studies generally in-dicate that Arctic tundra has been a sink for atmospheric CO2
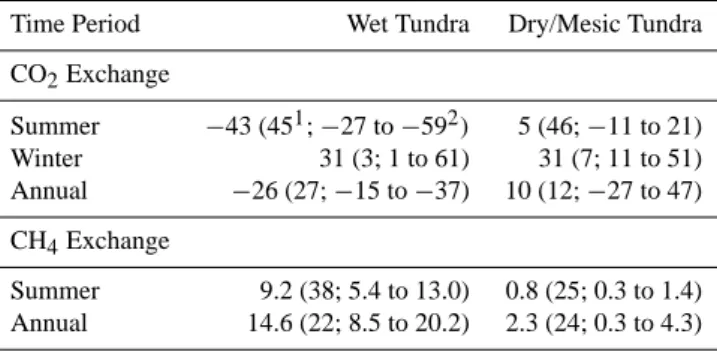
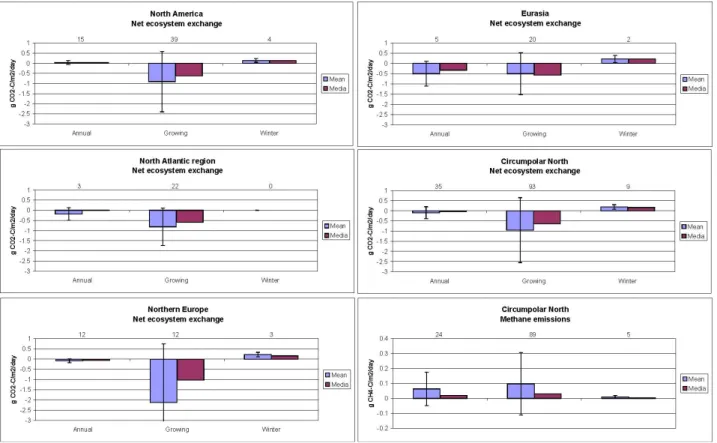
during the summer in all subregions of the Arctic (i.e., NEE is largely negative; Fig. 2) and that there has not been a sub-stantial change in the sink strength between the 1990s and 2000s (Table 3). While it appears from Table 3 that the sum-mer sink strength in Eurasia has more than doubled since 2000 (from −25 to −73 g C m−2summer−1), the mean esti-mates are not significantly different as the 95 % confidence limits, since 2000 overlap the 95 % confidence limits for the 1990s. The existing observations suggest that wet (low-land) tundra is a sink for CO2 during the growing season
(−43 g C m−2summer−1), while dry/mesic (upland) tundra tends to be a growing season source of CO2 to the
atmo-sphere with a confidence interval that overlaps neutral bal-ance (Table 4).
Only a handful of studies have estimated the exchange of CO2in winter, as there are considerable challenges in
main-taining accurate flux measurements outside the growing sea-son. The available estimates indicate that tundra ecosystems are wintertime sources of CO2to the atmosphere (Fig. 2,
Ta-ble 3). Given that few studies have been conducted, it does not appear that the strength of sources differs among subre-gions (29 to 41 g C m−2winter−1; Table 3). Also, the scarcity of winter exchange data does not allow us to evaluate if there are differences in source strength between the 1990s and 2000s. The existing observations suggest that there is little difference in the source strength of CO2 during the winter
between wet and dry/mesic tundra (31 g C m−2winter−1, Ta-ble 4).
There are a growing number of observationally based stud-ies that estimate annual CO2exchange between tundra and
the atmosphere. In general, the range of variability among estimates is scattered around neutral annual CO2 exchange
in all subregions (Fig. 2). In North America, the data sug-gest that tundra ecosystems tended to be annual sources of CO2to the atmosphere prior to 2000 (29 g C m−2yr−1), but
have been weak sinks since 2000 (−3 g C m−2yr−1; Table 3). The existing observations suggest that wet tundra is a strong sink for CO2annually, while dry/mesic tundra tends to be an
annual source of CO2 to the atmosphere with a confidence
interval that overlaps neutral balance (Table 4).
Based on the mean and range of NEE observations re-ported in Table 3 for the different geographical regions of the Arctic, we developed first order estimates of NEE and ranges in uncertainty in those estimates for Arctic tundra be-tween 1990 and 2009 (see Supplement 3 for details). This analysis suggests that tundra was source of 138 Tg C yr−1as CO2to the atmosphere in the 1990s, with a range of
uncer-tainty between a −102 Tg C yr−1 sink and a 378 Tg C yr−1 source. In contrast, the analysis suggests that tundra was a −202 Tg C yr−1 sink in the 2000s with an uncertainty range between a −628 Tg C yr−1 sink and 224 Tg C yr−1 source. Across the two decades, we estimate that tundra was a sink of −103 Tg C yr−1with an uncertainty between a −297 Tg C yr−1sink and 89 Tg C yr−1source.
3.1.2 CH4exchange
Similar to data on CO2exchange, most of the studies of the
exchange of CH4between tundra and the atmosphere have
been conducted during the summer growing season. These studies generally indicate that Arctic tundra is a substan-tial source of CH4 to the atmosphere during the summer
(Fig. 2) and that there has not been a substantial change in the strength of the source between the 1990s (3.0 to 7.8 g CH4-C m−2summer−1 across regions) and 2000s (1.4
to 12.5 g CH4-C m−2summer−1 across regions; Table 3).
However, the existing observations suggest that there are dif-ferences among different tundra types as mean summer emis-sions of CH4for wet tundra are 9.2 g C m−2compared with
0.8 g C m−2for dry/mesic tundra with no overlap in the con-fidence intervals (Table 4). There are only two studies that have estimated the exchange of CH4 in winter, and these
studies indicate that tundra ecosystems are a weak source of around 3.0 (range 0.1 to 6.0) g CH4-C m−2winter−1 to
the atmosphere. The comparison of tundra CH4 emissions
between summer and annual estimates suggests that CH4
emissions in winter supports this range, as annual fluxes are 5.4 g CH4-C m−2higher than summer fluxes in wet
tun-dra vs. 1.5 g CH4-C m−2higher in dry tundra (Table 4).
Based on the mean and range of CH4 observations
re-ported in Table 3 for the different geographical regions of the Arctic, we developed estimates of CH4 emissions and
ranges in uncertainty in those estimates for Arctic tundra be-fore and since 2000 (see Supplement 3 for details). This anal-ysis suggests that tundra emitted 10 Tg C yr−1as CH4to the
atmosphere in the 1990s, with a range of uncertainty between
−1 and 22 Tg C yr−1. The analysis suggests that tundra was
stronger emitter of CH4during the 2000s (20 Tg C yr−1), but
the uncertainties since 2000 are much larger than in the 1990s (between a sink of 11 and a source of 51 Tg C yr−1). We sus-pect that the larger uncertainty in the 2000s is associated with more measurements of CH4across a greater diversity of
tun-dra vegetation types. Across the two decades, our analysis in-dicates that tundra emitted 11 Tg C yr−1as CH4with a range
Table 3. Summary of observationally based estimates of mean net CO2-C and CH4-C exchange from Arctic tundra to the atmosphere (g C m−2season−1) for different subregions.
Time Period North America North Atlantic Northern Europe Eurasia
CO2Exchange Summer 1990–1999 −7 (521; −22 to 72) −32 (9; −58 to −5) −98 (4; −127 to −68) −25 (18; −50 to −1) 2000–2009 −18 (28; −39 to 3) −53 (12; −90 to −16) −92 (5; −220 to 36) −73 (12; −141 to −4) 1990–2009 −11 (80; −23 to 1) −44 (21; −66 to −21) −94 (9; −151 to −38) −44 (30; −74 to −14) Winter 1990–2009 31 (9;15 to 47) – 41 (3; 11 to 71) 29 (2; −13 to 73) Annual 1990–1999 29 (9; 2 to 57) – −25 (6; −63 to −14) − 2000–2009 −3 (14; −28 to 21) – −19 (33; −30 to −8) − 1990–2009 10 (23; −10 to 28) −68 (4; −213 to 78) −20 (39; −30 to −10) −82 (6; −134 to −30) CH4Exchange Summer 1990–1999 2.4 (10; 0.7 to 4.2) – 7.8 (13; 1.4 to 14.2) 3.0 (15; −0.4 to 6.5) 2000–2009 1.4 (9; −0.2 to 2.9) – 12.5 (10; 1.9 to 23.0) 5.1 (29; 1.6 to 8.6) 1990–2009 1.9 (19; 0.8 to 3.0) 3.1 (3; 2.3 to 3.8) 9.9 (23; 4.5 to 15.2) 4.4 (44; 1.9 to 6.9) Annual 1990–1999 4.4 (24; 1.4 to 7.4) – 15.0 (3; −18.3 to 48.3) − 2000–2009 16.9 (2; −12.0 to 45.7) – 11.3 (27; 6.6 to 16.0) 8.2 (7, −1.8 to 18.1) 1990–2009 5.4 (26; 1.9 to 8.9) – 11.7 (30; 7.2 to 16.1) 8.2 (7; −1.8 to 18.1)
1Number of site-year estimates. 295 % confidence interval.
Table 4. Summary of observationally based estimates of mean net
CO2-C and CH4-C exchange from Arctic tundra to the atmosphere (g C m−2season−1) for different tundra types.
Time Period Wet Tundra Dry/Mesic Tundra
CO2Exchange Summer −43 (451; −27 to −592) 5 (46; −11 to 21) Winter 31 (3; 1 to 61) 31 (7; 11 to 51) Annual −26 (27; −15 to −37) 10 (12; −27 to 47) CH4Exchange Summer 9.2 (38; 5.4 to 13.0) 0.8 (25; 0.3 to 1.4) Annual 14.6 (22; 8.5 to 20.2) 2.3 (24; 0.3 to 4.3)
1Number of site-year estimates. 295 % confidence interval.
3.2 Process-based model estimates
3.2.1 Mean C budgets for 1990–1999 and 2000–2006
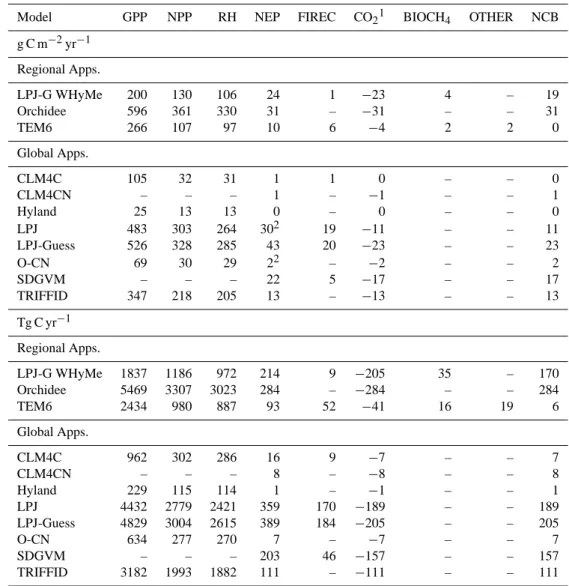
GPP estimated by the regional applications of process-based models over the Arctic tundra region from 1990 through 1999 varies from 1755 Tg C yr−1 (191 g C m−2yr−1) for LPJ-Guess WHyMe to 5295 Tg C yr−1 (577 g C m−2yr−1) for Orchidee (Table 5). NPP is estimated to be approx-imately 65 %, 61 %, and 40 % of GPP by LPJ-Guess WHyMe, Orchidee, and TEM6, respectively. TEM6 esti-mates a higher proportion of GPP allocated to autotrophic respiration because the temperature sensitivity of autotrophic respiration in the model increases with decreasing mean annual temperature (McGuire et al., 1992). RH estimates vary from 875 Tg C yr−1 (95 g C m−2yr−1) for TEM6 to 2954 Tg C yr−1(322 g C m−2yr−1) for Orchidee, and RH is estimated to be less than NPP by each model. NEP esti-mates vary from 85 Tg C yr−1 (10 g C m−2yr−1) for TEM6 to 255 Tg C yr−1(28 g C m − 2 yr−1) for Orchidee. TEM es-timates 30 Tg C yr−1in fire emissions, which is 20 Tg C yr−1 more than is estimated by LPJ-Guess WHyMe. After
3192 A. D. McGuire et al.: Assessment of the carbon balance of Arctic tundra
Fig. 2. A summary of the data presented in Supplement 1; the summary includes observations prior to 1990. The synthesis of observed NEE
for different geographical regions is shown in the first five panels. The mean (g C m−2day−1) +/− standard deviation and the median are shown for summer, winter, and annual analyses. The number of studies used from Supplement 1 to estimate each mean/median is shown above the bars. Methane emissions for the circumpolar North are shown in the sixth panel in a similar fashion.
accounting for fire emissions of CO2, the estimates of the
net exchange of CO2vary from 55 Tg C yr−1taken up from
the atmosphere by TEM6 to 255 Tg C yr−1taken up by
Or-chidee, which is a higher range of uptake than is estimated by the global applications of process models (from neutral balance estimated by Hyland to an uptake of 188 Tg C yr−1 by LPJ-Guess). Approximately 80 % of the NEP estimated by TEM6 is lost to fire emissions, biogenic CH4emissions,
and the export of harvested products and DOC. Approxi-mately 20 % of NEP estimated by LPJ-Guess WHyMe is lost to fire and CH4emissions. Thus, NCB estimated by the
models varies from approximately 20 Tg C yr−1 (TEM6) to 255 Tg C yr−1(Orchidee).
In comparison to the 1990s, GPP estimated by the re-gional applications of process-based models over the Arc-tic tundra region from 2000 through 2006 is higher (from an increase of 9 g C m−2yr−1 by TEM to an increase of
38 g C m−2yr−1by Orchidee; compare Table 6 to Table 5).
The satellite-based estimate of GPP by TCF from 2000– 2006 is 307 g C m−2yr−1, which is 47 % and 14 % higher than the estimates by LPJ-Guess WHyMe and TEM6, re-spectively, and 50 % of the estimate by Orchidee. Similar to GPP, both NPP and RH estimates of the regional applications
are higher in the 2000s compared to the 1990s. Although NEP estimates increase by 1 to 6 g C m−2yr−1between the
two decades across the models, the increase from 1990 to 2006 is significant only for the LPJ-Guess WHyMe simu-lation (0.57 g C m−2yr−1; P = 0.001). The TEM6 simula-tion estimates that fire emissions doubled in the 2000s com-pared to the 1990s. Estimates of the net uptake of CO2
in-crease (lower or more negative net CO2-C exchange) for both
LPJ-Guess WHyMe and Orchidee in the 2000s compared to the 1990s, but decrease for TEM6. Between 1990 and 2006 both Orchidee and LPJ-Guess WHyMe estimate sub-stantially greater net uptake of CO2(31 and 4 g C m−2yr−1,
respectively; Table 7) than TEM6 (4 g C m−2yr−1). Among the global models, only LPJ and SDGVM estimate less net uptake of CO2 (less negative net CO2-C exchange) in the
2000s (Table 6) compared to the 1990s (Table 5). The great-est uptake between 1990 and 2006 among the global models is simulated by LPJ-Guess (23 g C m−2yr−1), which is
simi-lar to the uptake estimated by LPJ-Guess WHyMe (Table 7) To explore the importance of changing climate on the re-gional applications of the process-based models, we con-ducted additional simulations that were driven by constant climate. We estimated the effect of a changing climate on
Table 5. Mean C budget of Arctic tundra simulated by process models for 1990–1999.
Model GPP NPP RH NEP FIREC CO2∗ BIOCH4 OTHER NCB
g C m−2yr−1 Regional Apps. LPJ-G WHyMe 191 124 102 22 1 −21 4 – 17 Orchidee 577 350 322 28 – −28 – – 28 TEM6 261 105 95 10 4 −6 2 2 2 Global Apps. CLM4C 101 31 30 1 1 0 – – 0 CLM4CN – – – 1 – −1 – – 1 Hyland 23 11 11 0 – 0 – – 0 LPJ 464 291 253 38 18 −20 – – 20 LPJ-Guess 490 306 265 41 20 −21 – – 21 O-CN 64 28 27 1 – −1 – – 1 SDGVM – – – 23 5 −18 – – 18 TRIFFID 332 208 200 8 – −8 – – −8 Tg C yr−1 Regional Apps. LPJ-G WHyMe 1755 1133 934 199 10 −189 34 – 155 Orchidee 5295 3209 2954 255 – −255 – – 255 TEM6 2391 960 875 85 30 −55 15 20 20 Global Apps. CLM4C 929 289 275 14 8 −6 – – 6 CLM4CN – – – 5 – −5 – – 5 Hyland 210 105 105 0 – 0 – – 0 LPJ 4255 2671 2323 348 169 −179 – – 179 LPJ-Guess 4497 2804 2433 371 183 −188 – – 188 O-CN 585 256 252 4 – −4 – – 4 SDGVM – – – 212 44 −168 – – 168 TRIFFID 3053 1907 1837 70 – −70 – – 70 ∗Net CO
2-C exchange, positive sign indicates source to the atmosphere and negative sign indicates tundra sink.
NPP, RH, and NEP between 1990 and 2006 by subtract-ing the estimates of the constant climate simulation of each model from that of the corresponding transient climate simu-lation. This analysis indicated that climate change between 1990 and 2006 caused NPP and RH of all three models to increase (Table 8). In comparison to TEM6, NPP was 69 % and 106 % more sensitive in the LPJ-Guess WHyMe and Orchidee simulations, respectively. In contrast, the RH sensitivity of LPJ-Guess WHyMe was similar to that of TEM6, while the RH sensitivity of Orchidee was 146 % more sensitive than TEM6. The different sensitivities of NPP and RH caused quite different sensitivities in NEP. Climate change between 1990 and 2006 caused LPJ-Guess WHyMe NEP to increase by 8 g C m−2yr−1, TEM6 NEP to increase by 1 g C m−2yr−1, and Orchidee NEP to decrease by 4 g C m−2yr−1.
3.2.2 Seasonal cycle and changes in the seasonal cycle
While the shape of the seasonal cycle of NPP, RH, and NEP is similar among the regional applications of the process-based models, the amplitude of the fluxes are different (Fig. 3). All models estimate that the month of maximum production and decomposition is July, but the timing of the transition to positive NEP in the spring and to negative NEP in the autumn varies among the models. Both LPJ-Guess WHyMe and Orchidee have the same pattern of differences in monthly NEP between the 2000s and 1990s (Fig. 4), with the largest increases in July. LPJ-Guess WHyMe has rela-tively larger increases in May, while Orchidee has relarela-tively larger increases in August. The summer increases of LPJ-Guess WHyMe and Orchidee are driven by increases in NPP that are greater than increases in RH. In contrast, TEM6 has the largest increases in September, followed by August as NPP increases in August and September are greater than
3194 A. D. McGuire et al.: Assessment of the carbon balance of Arctic tundra
Table 6. Mean C budget of Arctic tundra simulated by process models for 2000–2006.
Model GPP NPP RH NEP FIREC CO21 BIOCH4 OTHER NCB
g C m−2yr−1 Regional Apps. LPJ-G WHyMe 209 135 110 25 1 −24 4 – 20 Orchidee 615 371 337 34 – −34 – – 34 TEM6 270 109 98 11 8 −3 2 2 −1 TCF 307 181 183 2 – – – – − Global Apps. CLM4C 108 34 32 02 1 −1 – – 1 CLM4CN – – – 1 – −1 – – 1 Hyland 27 14 14 0 – 0 – – 0 LPJ 502 315 274 222 19 −3 – – 3 LPJ-Guess 562 349 305 44 20 −24 – – 24 O-CN 74 32 31 32 – −3 – – 3 SDGVM – – – 21 5 −16 – – 16 TRIFFID 361 227 210 17 – −17 – – 17 Tg C yr−1 Regional Apps. LPJ-G WHyMe 1918 1239 1009 230 9 −221 37 – 184 Orchidee 5643 3404 3092 312 – −312 – – 312 TEM6 2476 1000 899 101 73 −28 18 18 −8 TCF 2817 1661 – – – – – – − Global Apps. CLM4C 994 314 296 18 9 −9 – – 9 CLM4CN – – – 8 – −8 – – 8 Hyland 248 124 123 1 – −1 – – 1 LPJ 4608 2887 2518 369 171 −198 – – 198 LPJ-Guess 5160 3204 2797 407 185 −222 – – 222 O-CN 682 298 287 11 – −11 – – 11 SDGVM – – – 193 47 −146 – – 146 TRIFFID 3310 2079 1927 152 – −152 – – 152 1Net CO
2-C exchange, positive sign indicates source to the atmosphere and negative sign indicates tundra sink. 2Reported NEP does not equal reported NPP – reported RH.
increases in RH; in June and July there are similar increases in both NPP and RH. All three models indicate substantially lower NEP in October because of increases in RH when NPP is close to zero in both decades.
3.2.3 Interannual variability
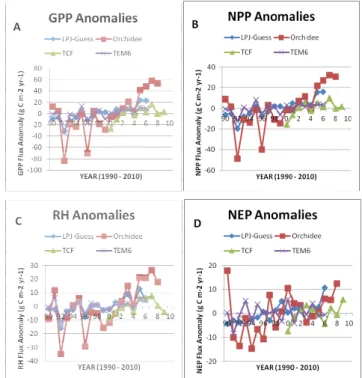
Among the regional applications of the process-based mod-els, Orchidee stands out as having the highest range of in-terannual variability in GPP, NPP, RH, and NEP (Fig. 5). Correlations are high among the models for interannual vari-ability in the anomalies of GPP (R = 0.73 to 0.88; Fig. 5a) and RH (R = 0.81 to 0.97; Fig. 5c). The correlations for NPP anomalies (Fig. 5b) are slightly lower (R = 0.66 to
0.80), except for a low correlation between TCF and TEM6 (R = 0.23). In contrast, correlations among the anomalies of NEP (Fig. 5d) are poor and range from negative correlations (R = −0.64 between Orchidee and TCF) to low positive cor-relations (R = 0.30 between Orchidee and TEM6).
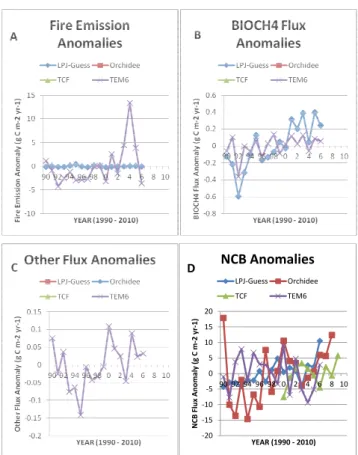
TEM6 estimates of fire emissions are characterized by substantial interannual variability in comparison to LPJ-Guess WHyMe, which has little interannual variability in fire emissions (Fig. 6a); the variability is uncorrelated be-tween the models (R = 0.07). LPJ-Guess estimates of bio-genic CH4 emissions are correlated with those of TEM6
(R = 0.69; Fig. 6b), but are characterized by more interan-nual variability than those of TEM6. The other flux anoma-lies estimated by TEM6 have less interannual variability
Table 7. Mean C budget of Arctic tundra simulated by process models for 1990–2006.
Model GPP NPP RH NEP FIREC CO21 BIOCH4 OTHER NCB
g C m−2yr−1 Regional Apps. LPJ-G WHyMe 200 130 106 24 1 −23 4 – 19 Orchidee 596 361 330 31 – −31 – – 31 TEM6 266 107 97 10 6 −4 2 2 0 Global Apps. CLM4C 105 32 31 1 1 0 – – 0 CLM4CN – – – 1 – −1 – – 1 Hyland 25 13 13 0 – 0 – – 0 LPJ 483 303 264 302 19 −11 – – 11 LPJ-Guess 526 328 285 43 20 −23 – – 23 O-CN 69 30 29 22 – −2 – – 2 SDGVM – – – 22 5 −17 – – 17 TRIFFID 347 218 205 13 – −13 – – 13 Tg C yr−1 Regional Apps. LPJ-G WHyMe 1837 1186 972 214 9 −205 35 – 170 Orchidee 5469 3307 3023 284 – −284 – – 284 TEM6 2434 980 887 93 52 −41 16 19 6 Global Apps. CLM4C 962 302 286 16 9 −7 – – 7 CLM4CN – – – 8 – −8 – – 8 Hyland 229 115 114 1 – −1 – – 1 LPJ 4432 2779 2421 359 170 −189 – – 189 LPJ-Guess 4829 3004 2615 389 184 −205 – – 205 O-CN 634 277 270 7 – −7 – – 7 SDGVM – – – 203 46 −157 – – 157 TRIFFID 3182 1993 1882 111 – −111 – – 111 1Net CO
2-C exchange, positive sign indicates source to the atmosphere and negative sign indicates tundra sink. 2Reported NEP does not equal reported NPP – reported RH.
(∼ 0.25 g C m−2; Fig. 6c) than fire emissions (∼ 16 g C m−2; Fig. 6a) and bioigenic CH4 emissions (∼ 0.5 g C m−2;
Fig. 6b). In general, the correlations among the models for in-terannual variability in NCB (Fig. 6d) are similar to those for NEP (Fig. 6d), except that all of the correlations are weaker between TEM6 and the other models. This suggests that fire emissions, biogenic CH4emissions, and other export fluxes
are important to consider in evaluating interannual variability in carbon storage of Arctic tundra.
3.3 Atmospheric inversion estimates
We analyzed the net exchange of CO2 (i.e., NEE)
be-tween Arctic tundra and the atmosphere estimated by in-versions for 1990–1999 and 2000–2006 (Table 9). Among the three models that made estimates between 1990 and 1999, the mean annual exchange ranged from a source of
140 Tg C yr−1(15 g C m−2yr−1) to a sink of 321 Tg C yr−1 (35 g C m−2yr−1). In comparison to the 1990–1999 time period, the range among the eight models that made esti-mates for 2000–2006 is wider and ranges from a source of 206 Tg C yr−1(22 g C m−2yr−1) to a sink of 439 Tg C yr−1
(48 g C m−2yr−1).
The shape of the mean seasonal cycle of NEE be-tween 2000 and 2006 is generally similar among the inversions (Fig. 7). All models indicate that the maxi-mum NEE occurs in July, but the number of months with negative NEE varies among the models between two (C13 MATCH rayner) and four (LSCE an v2.1). Among the inversion models, the NEE estimates of individual months are generally within 10 g C m−2 except for LSCE an v2.1, which estimates higher releases of CO2 to the atmosphere
3196 A. D. McGuire et al.: Assessment of the carbon balance of Arctic tundra
Table 8. Inferred climate effect of NPP, RH, and NEP for 1990–
2006 as the difference between simulations of the regional appli-cations of process models driven by transient climate and constant climate.
Inferred
Model Transient Constant Climate
Climate Climate Effect
NPP (g C m−2yr−1) LPJ-Guess WHyMe 128 101 27 Orchidee 359 326 33 TEM6 106 90 16 RH (g C m−2yr−1) LPJ-Guess WHyMe 105 86 19 Orchidee 328 291 37 TEM6 96 81 15 NEP (g C m−2yr−1) LPJ-Guess WHyMe 23 15 8 Orchidee 31 35 −4 TEM6 10 9 1
Fig. 3. Mean monthly fluxes of gross primary production (GPP),
net primary production (NPP), heterotrophic respiration (RH), and net ecosystem production (NEP) simulated by LPJ-Guess WHyMe (Panel A), Orchidee (Panel B), and TEM6 (Panel D) between 1990 and 2006 and by TCF (Panel C) between 2000 and 2009.
than the other models in April and May and higher uptake of CO2in July, August, and September.
Among the inversion models, interannual variability is smallest for LSCE an v2.1 (standard deviation of NEE anomalies = 2.1 g C m−2yr−1) and largest for rigc patra
Fig. 4. Difference in mean monthly NEP between the 2000s (2000–
2006) and the 1990s (1990–1999) for LPJ-Guess WHyMe, Or-chidee, and TEM6.
Fig. 5. Comparisons among LPJ-Guess WHyMe, Orchidee, TCF,
and TEM of inter-annual variability between 1990 and 2010 for anomalies of gross primary production (GPP, Panel A), net primary production (NPP, Panel B), heterotrophic respiration (NPP, Panel
C), and net ecosystem production (NEP, Panel D).
(standard deviation = 13.1 g C m−2yr−1) (Fig. 8). Similar to
the correlations of interannual variability in NEP anomalies among the process-based models, the correlations of inter-annual variability in NEE anomalies among the inversion models is poor with a mean correlation of 0.03; correla-tions range between −0.38 (between CTRACKER EU and C13 CCAM law) to +0.99 (between CTRACKER US and LSCE an v2.1).
Table 9. Mean annual net CO2-C exchange estimates of inversion models of Arctic tundra for the time periods 1990–1999 and 2000–2006. Model 1990–1999 2000–2006 1990–2006 1990–1999 2000–2006 1990–2006 Tg C yr−1 Tg C yr−1 Tg C yr−1 gC m−2yr−1 g C m−2yr−1 g C m−2yr−1 C13 CCAM law – 243 – 26 C13 MATCH rayner – −283 – −31 JENA s96 v3.3 – −117 – −13 JMA 2010 −321 −341 −331 −35 −37 −36 LSCE an v2.1 – −124 – −14 LSCE var v1.0 140 206 173 15 22 19
NICAM niwa woaia −178 −80 −129 −19 −9
rigc Patra – −439 – −48 −14 ‐20 ‐15 ‐10 ‐5 0 5 10 15 20 90 92 94 96 98 0 2 4 6 8 10 NCB Flux Anomaly (g C m ‐2 yr ‐1) YEAR (1990 ‐ 2010) NCB Anomalies LPJ‐Guess Orchidee TCF TEM6 D
Fig. 6. Comparisons among LPJ-Guess WHyMe, Orchidee, TCF,
and TEM of inter-annual variability between 1990 and 2010 for anomalies of fire emissions (Panel A), biogenic CH4 emissions (Panel B), Other fluxes (harvest and DOC exports, Panel C), and net carbon balance (NCB, Panel D).
4 Discussion
The changing C balance of Arctic tundra has been an issue of concern for several decades (Billings et al., 1983; Oechel et al., 1993; McGuire et al., 2000, 2009, 2010; Chapin et al., 2000; Sitch et al., 2007; Hayes et al., 2011). It has been hy-pothesized that tundra will become a source of C to the atmo-sphere because of C emissions associated with the warming
‐80.0 ‐60.0 ‐40.0 ‐20.0 0.0 20.0 40.0
Jan Feb Mar Apr May Jun Jul Aug Sep Oct Nov Dec
Flux (g C m ‐2mon th ‐1) Month Mean Seasonal CO2Exchange C13_CCAM_law C13_MATCH_rayner CTRACKER_EU CTRACKER_US JENA_s96_v3.3 JMA_2010 LSCE_an_v2.1 LSCE_var_v1.0 NICAM_niwa_woaia rigc_patra
Fig. 7. Comparison among inversion model estimates of the mean
net monthly exchange of CO2between Arctic tundra and the atmo-sphere.
Fig. 8. Comparison among inversion model estimates of the
inter-annual variability between 1985 and 2009 for anomalies of the net annual exchange of CO2between arctic tundra and the atmosphere.
of soil organic matter in the active layer as well as the ex-posure of previously frozen C to decomposition as the active layer deepens. Some recent model applications that consider
3198 A. D. McGuire et al.: Assessment of the carbon balance of Arctic tundra
soil C stocks at depth in high latitudes and the exposure of those stocks to decomposition upon permafrost thaw indi-cate that northern terrestrial ecosystems will release soil C to the atmosphere (Koven et al., 2011; Schaefer et al., 2011; Schneider von Deimling et al., 2012). It has also been hy-pothesized that tundra could become a sink for atmospheric CO2if N-limited plants in tundra regions take up a
substan-tial proportion of N that is released by enhanced decompo-sition (Shaver et al., 1992). Some coupled climate–carbon model simulations predict that the northern high latitudes will serve as a substantial land carbon sink during the 21st century because both climate warming and elevated global [CO2] favor increased productivity and CO2 uptake in the
region (Friedlingstein et al., 2006; Qian et al., 2010; Sitch et al., 2008). Whether tundra becomes a source or a sink of at-mospheric CO2in response to warming is an important
sci-entific issue to resolve, as substantial source activity could compromise efforts to mitigate the increase of greenhouse gases in the atmosphere. Changes in CH4emissions are also
important, because of the high global warming potential of CH4. In terms of climate forcing, increasing CH4emissions
could offset the effects of a CO2sink, or enhance the effects
of a CO2source. In this study, we attempt to shed some light
on these issues by analyzing the C balance of Arctic tundra through a synthetic comparison among estimates of CO2and
CH4fluxes based on observations, regional and global
appli-cations of process-based models, and inversion models. We focused our comparison on the mean CO2and CH4budgets
for the time periods 1990–1999 and 2000–2006, on aspects of the seasonal cycle of CO2exchange, and on interannual
variability of CO2exchange.
4.1 Mean C budgets for the 1990s and 2000s
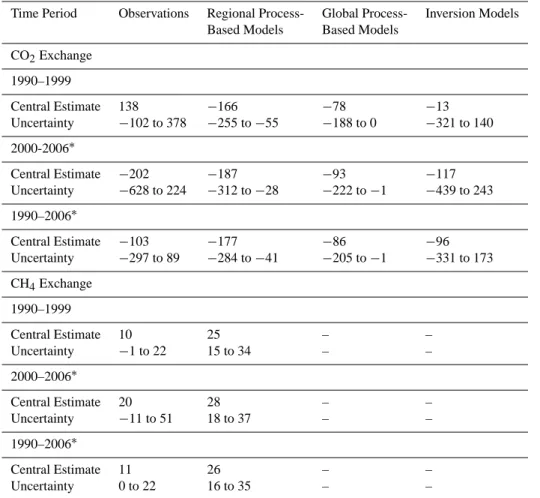
Table 10 compares the mean net exchanges of CO2-C and
CH4-C from Arctic tundra to the atmosphere among
obser-vations, process-based models, and inversion models (see Supplement 3 for documentation of the estimates reported in Table 10). Syntheses of the compilation of flux observa-tions and of inversion model results for Arctic tundra indicate that the annual exchange of CO2between Arctic tundra and
the atmosphere has large uncertainties that cannot be distin-guished from neutral balance. The synthesis of process-based model simulations indicate that Arctic tundra has been acting as a sink for atmospheric CO2, but based on the uncertainty
estimates it is not clear if Arctic tundra acted as a weak or a strong sink. In comparison to the global process-based mod-els, the regional process-based models indicate that Arctic tundra acted as a stronger sink.
Analysis of the CRU-NCEP data sets indicates that the re-gion was 0.6◦C warmer in the 2000s compared to the 1990s. Most of the warming was in the autumn and winter (1.1◦C warmer) followed by summer (0.3◦C warmer), and little dif-ference in the spring. The pattern of warmer autumns, win-ters, and summers in the 2000s occurred in all of the
subre-gions except North America in which the mean summer tem-perature was not different between the two decades. It is no-table that the central estimates of the observations, process-based models, and inversion models each identify stronger CO2sinks in the warmer 2000s compared with the 1990s. A
stronger sink in the 2000s compared to the 1990s suggests that the efficiency of the tundra CO2 sink is not currently
weakening; a common response of process-based models to warming in this region is that NPP increases faster in re-sponse to warming than RH (Sitch et al., 2007).
The largest changes in central estimates between the 1990s and 2000s are for those of the observations and the inversion models, and there is more convergence among the central es-timates in the 2000s than in the 1990s. The large changes between decades for the observations and inversion models might reflect biases in the 1990s since the diversity of flux observations, and the number of CO2 concentration
mea-suring stations and inversion model applications were fewer than in the 2000s. The only mean source activity is that sug-gested by the observations in the 1990s. In particular, the source strength of the observations in North America in the 1990s is driving the overall source estimate for Arctic tundra in the 1990s. It is possible that sampling of observations in the 1990s was biased toward dry tundra, which tends to act as a source for C in the observations in both the 1990s and 2000s.
In general, the regional process-based model applications predict stronger sinks than the suite of global applications of DGVMs. This is primarily due to the response of Orchidee, which has the highest NPP and NEE among the 11 models. It is notable that NPP and the sink strength of O-CN is much less than that of Orchidee, which might reflect the role of N in limiting productivity in O-CN. Although the sink strength of the central estimates of both regional and global process-based model applications increase from the 1990s and 2000s, 5 of the 11 process-based models show either no change or a weaker sink between decades (TEM6, CLM4CN, Hyland, LPJ, and SDGVM). Detailed analysis of one of the model applications (TEM6) suggests that tundra became a weaker sink from the 1970s through the 2000s because of the ef-fects of climate on net ecosystem carbon balance (McGuire et al., 2010). The constant climate experiments we conducted with the regional model applications suggests that warming increases both NPP and RH in all three models, but that the relative responses of NPP and RH to warming are different among the models. This analysis indicates that the process-based models do not agree on the relative responses of NPP and RH to climate change, and that this uncertainty in the responses of NPP and RH in these models is the major lim-itation in the application of process-based models to assess whether Arctic tundra will act as a positive or negative feed-back to climate change.
Our analysis of CH4 responses between decades is
lim-ited to comparison between the observations and the re-gional model applications (Table 10). There is substantial
Table 10. Comparison of estimates of mean net CO2-C and CH4-C exchange from arctic tundra to the atmosphere (Tg C yr−1) among observations, process-based models, and inversion models.
Time Period Observations Regional Process- Global Process- Inversion Models
Based Models Based Models
CO2Exchange 1990–1999 Central Estimate 138 −166 −78 −13 Uncertainty −102 to 378 −255 to −55 −188 to 0 −321 to 140 2000-2006∗ Central Estimate −202 −187 −93 −117 Uncertainty −628 to 224 −312 to −28 −222 to −1 −439 to 243 1990–2006∗ Central Estimate −103 −177 −86 −96 Uncertainty −297 to 89 −284 to −41 −205 to −1 −331 to 173 CH4Exchange 1990–1999 Central Estimate 10 25 – – Uncertainty −1 to 22 15 to 34 – – 2000–2006∗ Central Estimate 20 28 – – Uncertainty −11 to 51 18 to 37 – – 1990–2006∗ Central Estimate 11 26 – – Uncertainty 0 to 22 16 to 35 – –
∗The estimates for the observations reported for the 2000–2006 and the 1990–2006 periods may include information after 2006.
uncertainty in the 2000s CH4 flux observation-based
esti-mate. Because of big differences in estimates of CH4fluxes
between wet and dry/mesic tundra (Table 4), uncertainties could be reduced by adequately sampling CH4exchange
be-tween these two types of tundra within each of the subregions that we considered in scaling the CH4observations. The
syn-thesis of observations produces central estimates in the 1990s (10 Tg CH4-C yr−1) and 2000s (20 Tg CH4-C yr−1) that are
consistent with the range of uncertainty (23 to 75 Tg CH4
-C yr−1) among observation-based and process-model esti-mates (McGuire et al., 2009) for northern high latitude terres-trial regions that include boreal forest in addition to tundra. The central estimates in Table 10 are also consistent with the range of uncertainty (11 to 38 Tg CH4-C yr−1) among CH4
inversion models for northern high latitudes (McGuire et al., 2009). Similarly, the range of uncertainty of CH4exchange
estimated by LPJ-Guess WHyMe and TEM6 are within the ranges of uncertainty for both the bottom-up (based on ob-servations and process-based models) and top-down (based on inversion models) reported by McGuire et al. (2009).
The central estimates of the observations suggest that CH4
emissions have increased more than 100 % from the 1990s to the 2000s, while the applications of LPJ-Guess WHyMe and TEM6 suggest that CH4emissions have only increased
∼10–20 % from the 1990s to the 2000s. Previous analy-ses with TEM6 suggest that increasing temperature is the most important climate variable in the response of CH4
emis-sions to climate change (Zhuang et al., 2007; McGuire et al., 2010). However, it is important to recognize that there are substantial uncertainties and challenges in accurately model-ing the response of CH4emissions to climate change in the
Arctic (Ringeval et al., 2010; Petrescu et al., 2010).
4.2 Seasonal cycle and changes in the seasonal cycle
The sink strength of Arctic tundra for CO2 could increase
between decades because of more net CO2uptake during the
middle of the growing season or because of greater net up-take of CO2at either the start or end of the growing season.
In general, the pattern of mean seasonal cycle NEP of the regional model applications is consistent with the pattern of
3200 A. D. McGuire et al.: Assessment of the carbon balance of Arctic tundra
mean seasonal cycle NEE of the inversion models. All appli-cations identify that the greatest CO2uptake occurs in July,
but there are differences among both the regional model ap-plications and inversions about the length of the net uptake period. Our analysis of the seasonal exchange of CO2of the
regional model applications indicates that NPP of LPJ-Guess WHyMe, Orchidee, and TEM6 increased during the growing season in the 2000s compared to the 1990s. This is consistent with a number of remote sensing studies that have concluded that the Arctic tundra has become more productive during the last several decades (Nemani et al., 2003; Zhang et al., 2008; Beck and Goetz, 2011; Goetz et al., 2011) in asso-ciation with warmer summers (Piao et al., 2011). However, the models show different patterns in the response of NEP between decades. Both LPJ-Guess WHyMe and Orchidee show strong patterns of mid-growing season because NPP is more responsive than RH to the higher growing season tem-peratures of the 2000s. In contrast, TEM6 has stronger NEP increases late in the growing season. A number of studies have concluded that the growing season in northern high lat-itude regions has increased in recent decades (McDonald et al., 2004; Euskirchen et al., 2006; Parmesan, 2007; Karlsen et al., 2009; Piao et al., 2011), although the increase varies both spatially and temporally. The TEM6 late season NEP response is consistent with a recent analysis for boreal Eura-sia that suggests that the springtime extension of the growing season has stalled from 1997–2006 while the fall season has continued to lengthen and warm (Piao et al., 2011). The pat-tern of lower October NEP between decades among all three models is consistent with the analysis of Piao et al. (2008), which concludes that warmer and longer falls lead to greater CO2release in northern terrestrial ecosystems (see also
Par-mentier et al., 2011).
4.3 Interannual variability
Our analysis of inter-annual NEP anomalies among the re-gional model applications and of inter-annual NEE anoma-lies among the inversion models indicates that there is lit-tle agreement among the models on the pattern of inter-annual exchanges of CO2between Arctic tundra and the
at-mosphere. Although different inversions generally agree on the pattern inter-annual variability of regional NEE (Gurney et al., 2008), this is not the case for the Arctic tundra region and suggests that the inversions are not well constrained in this region. The regional applications of the process-models generally agree on patterns of inter-annual variability for GPP, NPP, and RH. The interannual patterns of GPP for LPJ-Guess WhyMe, Orchidee, and TEM6 are consistent with the satellite-based annual variability of TCF, but the inter-annual variability of TEM6 NPP is not well correlated with that of TCF. Clearly, differences between GPP / NPP and RH need to be better constrained for the models to improve esti-mates of inter-annual variability.
4.4 Best estimates of carbon balance from 1990–2009
For the arctic tundra region, the use of observations, process-based models, and inversion models each have shortcomings with respect to estimating the net exchanges of CO2 and
CH4with the atmosphere in the 1990s and 2000s. Problems
with observations include small sample size in comparison to the area being considered, biases in tundra types sampled in both space and time, different sampling technologies among the samples, and changes in sampling technology through time. Process-models have uncertainties with respect to con-ceptualization, formulation, and parameterization issues. In-version models are not well constrained for the tundra re-gions. Given the shortcomings of these approaches, we de-cided to weight them equally in making estimates of net CO2
and CH4exchange with the atmosphere for the time period
from 1990–2009. For estimating CO2exchange, we first
av-eraged the regional and global process-based model central estimates and high and low estimates of uncertainty for the 1990–2006 period in Table 10 and then average those esti-mates with the corresponding estiesti-mates for the observations and inversion models. This procedure results in an estimate of the net CO2-C exchange of CO2between the atmosphere
and tundra ecosystems of a 110 Tg C yr−1sink with an uncer-tainty range between a sink of 291 Tg C yr−1and a source of 80 Tg C yr−1. For estimating CH
4exchange, we averaged the
central and the high and low estimates of uncertainty for the 1990–2006 period in Table 10 between the observations and the regional process-based models. This procedure results in an estimate of net CH4-C exchange between the atmosphere
and tundra ecosystems of a source of 19 Tg C yr−1 with an uncertainty range between sources of 8 and 29 Tg C yr−1.
5 Conclusions
The syntheses of the compilation of flux observations and of inversion model results for Arctic tundra in this study indi-cate that the annual exchange of CO2between Arctic tundra
and the atmosphere has large uncertainties that cannot be dis-tinguished from neutral balance in the 1990s and 2000s. In contrast, the synthesis of process-based model simulations indicate that Arctic tundra acted as a sink for atmospheric CO2in recent decades, but based on the uncertainty estimates
it is not clear if Arctic tundra acted as a weak or a strong sink. Our analyses suggest that both the CO2 sink strength
and the CH4emissions of Arctic tundra have increased in
re-cent decades. However, the analyses we conducted in this study indicate that responses of the seasonal exchange of CO2between decades and the interannual variability in CO2
exchange of process-based models are not consistent. Al-though the regional models generally agree on patterns of inter-annual variability in production and decomposition, the constant climate experiments we conducted with the regional models indicates that the relative sensitivity of production and decomposition to climate change are different among
the models. Thus, it is clearly important to reduce uncer-tainties in the observations, process-based models, and inver-sions in order to better understand the degree to which Arctic tundra is influencing atmospheric CO2 and CH4
concentra-tions. As inversion models are currently poorly constrained for making estimates of CO2 exchange for Arctic tundra,
there is a need to identify and place additional atmospheric CO2monitoring stations in a strategic fashion for better
con-straining inversion models. The availability and technology of ground-based observations in Arctic tundra are improving, particularly through the implementation of the Arctic Ob-serving Network that has been ongoing since the beginning of the International Polar Year in 2007 (S¨orlin and Danell, 2008). However, it is important to improve the network so that observations can be effectively stratified into those for dry/mesic tundra vs. wet tundra so that regional estimates based on ground-based observations can be improved and un-certainties reduced. More importantly, observation networks need to be designed so that the observations can ultimately be synthesized to understand how and why the net annual and seasonal exchanges of CO2and CH4are changing in
re-sponse to climate variability and change in different tundra types that span hydrological variability. Also, the effects of disturbances such as fire and thermokarst on the exchange of CO2 and CH4 are not well represented in observation
networks. Information from enhanced observation networks needs to be effectively transferred into process-based mod-els to improve the simulation of CO2and CH4exchange so
that process-based models can more reliably assess whether Arctic tundra will act as to amplify or mitigate global cli-mate change. The effective transfer of this information re-quires better coordination, integration, and synthesis among measurement groups and between measurement and model-ing groups.
Supplementary material related to this article is available online at: http://www.biogeosciences.net/9/ 3185/2012/bg-9-3185-2012-supplement.pdf.
Acknowledgements. Support for this study was provided by the
National Science Foundation, the US Geological Survey, the US Fish and Wildlife Service, the US Department of Energy Office of Science (Biological and Environmental Research), the US Na-tional Aeronautics and Space Administration Terrestrial Ecology program, the European Union RTN GREENCYCLES II network, the Swedish Research Council VR and FORMAS, the Greenland Climate Research Center, the Mistra Swedish Research Programme for Climate, Impacts and Adaptation, the Lund University research programme Modelling the Regional and Global Earth System, the European Union 6th Framework CARBO-North project, and the Lund University Centre for Studies of Carbon Cycle and Climate Interactions. The data for the global process-model simulations was provided by the Trendy multi-model evaluation project (http://dgvm.ceh.ac.uk), as part of the Global Carbon Project. Edited by: J. Canadell
References
Asner, G. P., Scurlock, M. O., and Hicke, J. A.: Global synthesis of leaf area index observations: Implications for ecological and remote sensing studies, Global Ecol. Biogeogr., 12, 191–205, 2003.
Beck, P. S. A. and Goetz, S. J.: Satellite observations of high north-ern latitude vegetation productivity changes between 1982 and 2008: ecological variability and regional differences, Environ. Res. Lett., 6, 045501, doi:10.1088/1748-9326/6/4/045501, 2011. Billings, W. D., Loken, J. O., Mortensen, D. A., and Peterson, K. M.: Increasing atmospheric carbon dioxide: possible effects on arctic tundra, Oecologia, 58, 286–289, 1983.
Bonan, G. B. and Levis, S.: Quantifying carbon-nitrogen feedbacks in the Community Land Model (CLM4), Geophys. Res. Lett., 37, L07401, doi:10.1029/2010GL042430, 2010.
Callaghan, T. V., Bj¨orn, L. O., Chapin, F. S. III, Chernov, Y., Chris-tensen, T. R., Huntley, B., Ims, R. A., Johansson, M., Jolly, D., Jonasson, S., Matveyeva, N., Oechel, W. C., Panikov, N., Shaver, G. R., Elster, J., Henttonen, H., J´onsd´ottir, I. S., Laine, K., Schaphoff, S., Sitch, S., Taulavuori, E., Taulavuori, K., and Z¨ockler, C.: Arctic tundra and polar desert ecosystems, in: Arctic climate impact assessment (ACIA), 243–352, Cambridge Uni-versity Press, Cambridge, UK, 2005.
Canadell, J. G., Ciais, P., Gurney, K., Le Quere, C., Piao, S., Rau-pach, M. R., and Sabine, C. L.: An international effort to quantify regional carbon fluxes, Eos, 92, 81–82, 2011.
Chapin III, F. S., McGuire, A. D., Randerson, J., Pielke Sr., R., Bal-docchi, D., Hobbie, S. E., Roulet, N., Eugster, W., Kasischke, E., Rastetter, E. B., Zimov, S. A., Oechel, W. C., and Running, S. W.: Feedbacks from arctic and boreal ecosystems to climate, Global Change Biol., 6, S211–S223, 2000.
Chapin III, F. S., Randerson, J. T., McGuire, A. D., Foley, J. A., and Field, C. B.: Changing feedbacks in the climate-biosphere system, Front. Ecol. Environ., 6, 313–320, doi:10.1890/080005, 2008.
Cox, P. M.: Description of the “TRIFFID” dynamic global vegeta-tion model, Hadley Centre Technical Note 24, 2001.
Euskirchen, E. S., McGuire, A. D., Kicklighter, D. W., Zhuang, Q., Clein, J. S., Dargaville, R. J., Dye, D. G., Kimball, J. S., McDon-ald, K. C., Melillo, J. M., Romanovsky, V. E., and Smith, N. V.: Importance of recent shifts in soil thermal dynamics on grow-ing season length, productivity, and carbon sequestration in ter-restrial high-latitude ecosystems, Global Change Biol., 12, 731– 750, 2006.
Farquhar, G. D., von Caemmerer, S., and Berry, J. A.: A biochem-ical model of photosynthetic CO2assimilation in leaves of C3 species, Planta, 149, 78–90, 1980.
Friedlingstein, P., Cox, P., Betts, R., Bopp, L., von Bloh, W., Brovkin, V., Cadule, P., Doney, S., Eby, M., Fung, I., Bala, G., John, J., Jones, C., Joos, F., Kato, T., Kawamiya, M., Knorr, W., Lindsay, K., Matthews, H. D., Raddatz, T., Rayner, P., Reick, C., Roeckner, E., Schnitzler, K. G., Schnur, R., Strassmann, K., Weaver, A. J., Yoshikawa, C., and Zeng, N.: Climate-carbon cy-cle feedback analysis: Results from the C4MIP model intercom-parison, J. Climate, 19, 3337–3353, 2006.
Goetz, S. J., Epstein, H. E., Alcaraz, D., Beck, P., Bhatt, U., Bunn, A. G., Comiso, J., Jia, G. J., Kaplan, J. O., Lischke, H., Lloyd, A. H., Yu, Q., Walker, D. A.: Recent changes in arctic vegeta-tion: satellite observations and simulation model predictions, in: