HAL Id: hal-01806240
https://hal.archives-ouvertes.fr/hal-01806240
Submitted on 27 Oct 2020
HAL is a multi-disciplinary open access
archive for the deposit and dissemination of
sci-entific research documents, whether they are
pub-lished or not. The documents may come from
teaching and research institutions in France or
abroad, or from public or private research centers.
L’archive ouverte pluridisciplinaire HAL, est
destinée au dépôt et à la diffusion de documents
scientifiques de niveau recherche, publiés ou non,
émanant des établissements d’enseignement et de
recherche français ou étrangers, des laboratoires
publics ou privés.
vapor over western Africa and its relationship to ENSO
A. Okazaki, Y. Satoh, G. Tremoy, F. Vimeux, R. Scheepmaker, K. Yoshimura
To cite this version:
A. Okazaki, Y. Satoh, G. Tremoy, F. Vimeux, R. Scheepmaker, et al.. Interannual variability of
isotopic composition in water vapor over western Africa and its relationship to ENSO. Atmospheric
Chemistry and Physics, European Geosciences Union, 2015, 15 (6), pp.3193 - 3204.
�10.5194/acp-15-3193-2015�. �hal-01806240�
www.atmos-chem-phys.net/15/3193/2015/ doi:10.5194/acp-15-3193-2015
© Author(s) 2015. CC Attribution 3.0 License.
Interannual variability of isotopic composition in water vapor over
western Africa and its relationship to ENSO
A. Okazaki1, Y. Satoh1, G. Tremoy2, F. Vimeux2,3, R. Scheepmaker4, and K. Yoshimura1,5 1Institute of Industrial Science, University of Tokyo, Tokyo, Japan
2Laboratoire des Sciences du Climat et de l’Environnement, UMR8212, Institut Pierre Simon Laplace,
CEA-CNRS-UVSQ, Gif-sur-Yvette, France
3Laboratoire HydroSciences Montpellier, UMR 5569, Institut de Recherche pour le Développement,
CNRS-IRD-UM1-UM2, Montpellier, France
4SRON Netherlands Institute for Space Research, Utrecht, the Netherlands 5Atmosphere and Ocean Research Institute, University of Tokyo, Kashiwa, Japan
Correspondence to: A. Okazaki (okazaki@rainbow.iis.u-tokyo.ac.jp)
Received: 27 May 2014 – Published in Atmos. Chem. Phys. Discuss.: 22 September 2014 Revised: 27 January 2015 – Accepted: 6 February 2015 – Published: 20 March 2015
Abstract. This study was performed to examine the
rela-tionship between isotopic composition in near-surface va-por (δ18Ov) over western Africa during the monsoon
sea-son and El Niño–Southern Oscillation (ENSO) activity using the Isotope-incorporated Global Spectral Model. The model was evaluated using a satellite and in situ observations at daily to interannual timescales. The model provided an ac-curate simulation of the spatial pattern and seasonal and in-terannual variations of isotopic composition in column and surface vapor and precipitation over western Africa. Encour-aged by this result, we conducted a simulation stretching 34 years (1979–2012) to investigate the relationship between at-mospheric environment and isotopic signature on an interan-nual timescale. The simulation indicated that the depletion in the monsoon season does not appear every year at Niamey. The major difference between the composite fields with and without depletion was in the amount of precipitation in the upstream area of Niamey. As the interannual variation of the precipitation amount is influenced by the ENSO, we re-gressed the monsoon season averaged δ18Ovfrom the model
and annually averaged NINO3 index and found a statistically significant correlation (R = 0.56, P < 0.01) at Niamey. This relationship suggests that there is a possibility of reconstruct-ing past western African monsoon activity and ENSO usreconstruct-ing climate proxies.
1 Introduction
The El Niño–Southern Oscillation (ENSO) is the strongest mode of interannual variability in the tropics (Dai et al., 1997) and plays an important role in the variability of precipitation, temperature, and circulation patterns on this timescale. El Niño can cause catastrophic floods and droughts (Philander, 1983) and damage to ecosystems (Aron-son et al., 2000). A recent study projected an increase in the frequency of extreme El Niño events due to global warm-ing (Cai et al., 2014). Therefore, it is essential to understand the natural variability of ENSO. Stable water isotopes (D,
18O) have been used to infer past and present climate since
the work of Dansgaard (1964). Several studies have linked ENSO with isotopic variation in precipitation or in seawa-ter under the present climate (e.g., Schmidt et al., 2007; Yoshimura et al., 2008; Tindall et al., 2009). For example, tropical South America (Vuille and Werner, 2005), the west-ern and central Pacific (Brown et al., 2006), and the Asian monsoon region (Ishizaki et al., 2012) are identified as hav-ing a connection with ENSO, basically through changes in local rainfall or integrated rainfall along the trajectory. How-ever, other regions, such as western Africa, have not yet been investigated in detail.
Western Africa receives most precipitation in the mon-soon season (July–September; JAS) and is known for its high variability on interannual or longer timescales. The severe
drought that hit western Africa during the 1970s and 1980s prompted researchers to study the factors controlling west-ern African rainfall variability on interannual to multidecadal timescales (e.g., Folland et al., 1986; Palmer, 1986; Janicot et al., 1996; Giannini et al., 2003; Shanahan et al., 2009; Mohino et al., 2011a, b). At present, the major role of sea surface temperatures (SST) in driving the variability, with land–atmosphere interactions as an amplifier (Giannini et al., 2003), is widely recognized. However, there is still debate regarding the relative importance of the various basins and mechanistic timescales involved (Nicholson, 2013). The At-lantic (Lamb, 1978; Joly and Voldoire, 2010; Mohino et al., 2011a), Pacific (Janicot et al., 2001; Mohino et al., 2011b), Indian Ocean (Palmer et al., 1986), and Mediterranean (Row-ell, 2003; Polo et al., 2008) have been linked to the variabil-ity of west African rainfall. In these oceans, the ENSO is thought to modulate the high-frequency component (interan-nual) of the variability (Ward, 1998; Joly et al., 2007). How-ever, the relationships are not stationary over time; the west-ern African rainfall is correlated with ENSO only after the 1970s (Janicot et al., 2001; Losada et al., 2012), indicating the existence of multiple competing physical mechanisms. How the impact has changed remains an open question.
Several studies used isotopes to understand the water cy-cle over western Africa on the intraseasonal timescale. Risi et al. (2008b) and Tremoy et al. (2012, 2014) examined the isotopic compositions of precipitation (δ18OP)and vapor
(δ18Ov), respectively, and both found that δ18O records the
spatially and temporally integrated convective activity dur-ing the monsoon season. Here, δ in per mill units is defined as (Rsample/Rstd-1) × 1000, where Rstd is VSMOW (Vienna
Standard Mean Ocean Water). Risi et al. (2010) confirmed the relationship using the LMDZ-iso model and suggested that δ18O is controlled by convection through rain reevap-oration and the progressive depletion of the vapor by con-vective mixing along air mass trajectories. The relationship between δ18O and convective activity suggests the possibil-ity of reconstructing the convective activpossibil-ity using a climate proxy if the relationship holds on the interannual timescale. The long record of precipitation should help in determining how SSTs influence precipitation variability. Some studies have reconstructed precipitation over western Africa (Lézine and Casanova, 1989; Shanahan et al., 2009). Shanahan et al. (2009) directly tied isotopic composition to local pre-cipitation. However, it is possible that the amount of rain-fall along the trajectory rather than local information has a greater impact, as mentioned above. Therefore, it is still nec-essary to estimate the relative contributions of the main con-trols on the interannual variability of the isotopic composi-tion in more comprehensive way.
In this paper, we explore the factors governing the inter-annual variability of monsoon season δ18Ov, which is the
source of precipitation and controls δ18Op variability (Risi
et al., 2008a), over western Africa and how the ENSO sig-nal is imprinted. As the observations cover relatively short
periods for looking into the interannual variability and avail-able variavail-ables are limited, we use an isotope-enavail-abled general circulation model (GCM) to complement the observations.
In the following section, the model simulations and the observations are described. In Sect. 3, we compare the simu-lated and observed variability of δ18O on a daily to interan-nual timescale. Section 4 investigates the factors controlling
δ18Ovon the interannual timescale by analyzing the
simula-tion results and confirms the role of the identified factors by sensitivity experiments. Finally, we examine the relationship between δ18O and ENSO in Sect. 5.
2 Data and methods 2.1 Observations
2.1.1 Observation of HDO in vapor from space
Frankenberg et al. (2009) measured column-averaged iso-topologue ratio (δD) values in water vapor using the SCan-ning Imaging Absorption spectroMeter for Atmospheric CHartographY (SCIAMACHY) onboard the European re-search satellite ENVISAT. We used the updated and extended version of this data set from Scheepmaker et al. (2014), cov-ering the years 2003–2007. As measured δD is weighted by the H2O concentration at all heights, it is largely
deter-mined by the isotopic abundance in the lowest tropospheric layers, where most water vapor resides. The footprint of each measurement is 120 km (across-track) × 30 km (along-track). We apply the following selection criteria concerning the retrievals (Scheepmaker et al., 2014):
– Retrieved H2O total column must be at least 70 % of the
a priori value.
– The CH4column in the same retrieval window must be at least within 10 % of the a priori value.
– Root-mean-square variation of the spectral residuals
must be below 5 %.
– Convergence must be achieved in a maximum of four
iteration steps.
Here, the first two criteria restrict large deviations from the a priori H2O and CH4columns, which are normally the
re-sult of light scattering by clouds. Therefore, these two crite-ria function as a simple cloud filter. Due to the high detector noise of SCIAMACHY in the shortwave infrared channels, the single measurement noise (1σ ) is typically 40–100 ‰, depending on total water column, surface albedo, and view-ing geometry. For the region of our study, however, the mean single measurement noise is of the order of 20–50 ‰, due to the high albedo and optimal viewing geometry of west-ern Africa. This random error can be further reduced by av-eraging multiple measurements. Therefore, we average the measurements according to the procedure of Yoshimura et
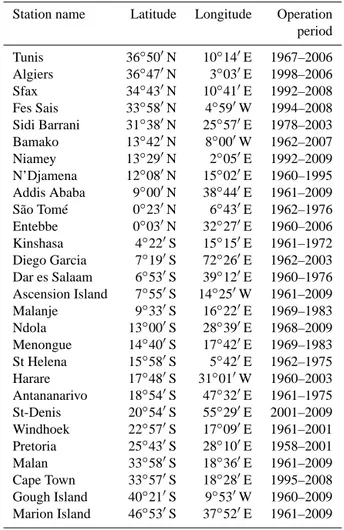
Table 1. Locations and operational periods of the GNIP
observato-ries used in this study.
Station name Latitude Longitude Operation period Tunis 36◦500N 10◦140E 1967–2006 Algiers 36◦470N 3◦030E 1998–2006 Sfax 34◦430N 10◦410E 1992–2008 Fes Sais 33◦580N 4◦590W 1994–2008 Sidi Barrani 31◦380N 25◦570E 1978–2003 Bamako 13◦420N 8◦000W 1962–2007 Niamey 13◦290N 2◦050E 1992–2009 N’Djamena 12◦080N 15◦020E 1960–1995 Addis Ababa 9◦000N 38◦440E 1961–2009 São Tomé 0◦230N 6◦430E 1962–1976 Entebbe 0◦030N 32◦270E 1960–2006 Kinshasa 4◦220S 15◦150E 1961–1972 Diego Garcia 7◦190S 72◦260E 1962–2003 Dar es Salaam 6◦530S 39◦120E 1960–1976 Ascension Island 7◦550S 14◦250W 1961–2009 Malanje 9◦330S 16◦220E 1969–1983 Ndola 13◦000S 28◦390E 1968–2009 Menongue 14◦400S 17◦420E 1969–1983 St Helena 15◦580S 5◦420E 1962–1975 Harare 17◦480S 31◦010W 1960–2003 Antananarivo 18◦540S 47◦320E 1961–1975 St-Denis 20◦540S 55◦290E 2001–2009 Windhoek 22◦570S 17◦090E 1961–2001 Pretoria 25◦430S 28◦100E 1958–2001 Malan 33◦580S 18◦360E 1961–2009 Cape Town 33◦570S 18◦280E 1995–2008 Gough Island 40◦210S 9◦530W 1960–2009 Marion Island 46◦530S 37◦520E 1961–2009
al. (2011); we averaged multiple measurements that were collected in a grid of 2.5◦×2.5◦in 6 h. We set the thresh-old value for averaging to 10, meaning that the average of the SCIAMACHY measurements in every grid cell is based on at least 10 measurements taken within 6 h. From the Isotope-incorporated Global Spectral Model (IsoGSM) sim-ulation results, the times of the nearest satellite measure-ments were extracted (hereafter the process is called “collo-cation”). Thus, there was no difference in representativeness between the model and the satellite data.
2.1.2 In situ measurement of water isotopologues in vapor
To assess the performance of the model on shorter timescales, daily δ18Ovfrom Tremoy et al. (2012) was used
in this study. The δ18Ovwas observed at about 8 m above the
ground using a Picarro laser instrument (L1102-i model) with an accuracy of ±0.25 ‰ at the Institut des Radio-Isotopes in Niamey, Niger (IRI; 13.31◦N, 2.06◦E; 218 m a.s.l) from 2 July 2010 to 12 May 2011.
2.1.3 In situ measurement of isotopes in precipitation (GNIP)
Observations of the monthly isotope ratio in precipitation over western Africa were obtained from the Global Network for Isotopes in Precipitation (GNIP) observational database (IAEA/WMO, 2014). We chose 28 GNIP stations in Africa that have full annual data spanning more than 10 years. The observatory location and its operation period are summarized in Table 1.
2.2 Isotope-enabled general circulation model simulation
The IsoGSM is an atmospheric GCM, into which stable water isotopes are incorporated. The model uses T62 hori-zontal resolution (about 200 km) and 28 vertical levels, and the temporal resolution of the output is 6 h. The convection scheme is the relaxed Arakawa–Schubert scheme (Moor-thi and Suarez, 1992). The main time integration scheme is a leapfrog scheme. The model is spectrally nudged to-ward wind and temperature fields from the National Cen-ters for Environmental Prediction (NCEP)–Department of Energy (DOE) Reanalysis 2 (R2) (Kanamitsu et al., 2002) in addition to being forced with prescribed SST and sea ice from an NCEP analysis, which are the same as those used in NCEP–DOE R2 (Kanamitsu et al., 2002). After a spin-up period of about 10 years with the constant 1979 forcing, the simulation was run from 1979 to 2012, as in Yoshimura et al. (2008). Isotope processes were incorporated following Joussaume et al. (1984): isotopic fractionation takes place whenever phase transition occurs. Most fractionation can be assumed to occur at thermodynamic equilibrium, except for three particular cases: surface evaporation form open wa-ter, condensation from vapor to ice in supersaturation condi-tions under −20◦C, and evaporation and isotopic exchange from liquid raindrop into unsaturated air. IsoGSM assumes no fractionation when water evapotranspires over land. More details of the model configurations have been described pre-viously (Yoshimura et al., 2008). The general reproducibil-ity of the model for daily to interannual timescales is well evaluated by comparing it with the precipitation isotope ra-tio (Yoshimura et al., 2008) and the vapor isotopologue rara-tio from satellite measurements (Yoshimura et al., 2011), and it showed sufficiently accurate results for various process stud-ies (e.g., Berkelhammer et al., 2012; Liu et al., 2013, 2014).
In addition to the standard experiment (Std) mentioned above, we carried out two sensitivity experiments. The first of these experiments examined the sensitivity of the results to the “equilibrium fraction ε”, which is the degree to which falling rain droplets equilibrate with the surroundings. Risi et al. (2010) reported the importance of reevaporation for δ18Ov
over western Africa, and Yoshimura et al. (2011) found an improved simulation result with the changed parameter. Fol-lowing Yoshimura et al. (2011), we set this value to 10 %,
while in the standard simulation it was set to 45 %. The other sensitivity experiment was intended to estimate the contri-butions to interannual variability in δ18Ovof the distillation
effect during transportation from the source regions. In this experiment, we removed the influences of the distillation pro-cesses by turning off isotopic fractionation during conden-sation and reevaporation from raindrops and preventing iso-topic exchange between falling raindrops and the surround-ing vapor. Note that these effects were switched off only in a certain region in the simulation. For a similar purpose, Ishizaki et al. (2012) specified transport pathways and then removed these effects along the pathway. We chose a differ-ent means of removing the effects in a certain domain, as we wished to specify the area that plays an important role in controlling the isotopic variation at a given point. Hereafter, we refer to the former sensitivity experiment as the “E10” experiment and the latter as the “NoFrac” experiment. Std and NoFrac cover the 1979–2012 period, and E10 covers the 2010–2011 period. The simulation results used in this study are from Std unless otherwise noted.
We use both δD and δ18O in the evaluation of the model since SCIAMACHY observes δD, whereas Tremoy et al. (2012) observes δ18O. As δD and δ18O basically respond to meteorological factors in the same way, there are no differ-ences in underlying mechanisms to produce changes. There-fore, there is no problem in using the combination of δD and
δ18O to evaluate model performance. In Sects. 4 and 5 we consistently use δ18O.
2.3 Isoflux analysis
Isoflux analysis specifies the contributions of advection, evapotranspiration, and precipitation to the changes in the isotopic composition of precipitable water in an atmospheric column. The concept of the analysis is based on budget anal-ysis. Using such analysis, Lai et al. (2006) specified the fac-tors controlling δ18Ovin a canopy layer. Worden et al. (2007)
discovered the importance of reevaporation from raindrops. Here, we develop the mass balance equation for18O in the atmospheric column. The mass balance for total precipitable water inside the atmospheric column can be written as
dW
dt = −∇ ·Q + E − P , (1) where W represents the total precipitable water, Q is the ver-tically integrated two-dimensional vapor flux vector, E is evapotranspiration, and P is precipitation. The term ∇ ·Q de-notes the horizontal divergence of vapor flux. Here, we refer to this term as advection. A mass balance equation can also be written for18O in the same manner as Eq. (1).
dRWW
dt = −∇ ·RWQ + REE − RPP , (2) where RW, RE, and RPrepresent the isotope ratio (18O /16O)
of precipitable water, evapotranspiration, and precipitation,
respectively. Multiplying Eq. (1) by RWand subtracting that
from Eq. (2), we obtain
dRW
dt W = −∇RW·Q + (RE−RW)E − (RP−RW)P . (3) Dividing by the Rstd, we can rewrite Eq. (3) in δ notation as
dδW
dt W = −∇δW·Q + (δE−δW)E − (δP−δW)P . (4) Starting from the left, the terms represent the temporal derivative of the isotopic composition of precipitable water, the effect of advection, evapotranspiration, and precipitation to deplete or enrich the precipitable water. As the analysis specifies the contribution of each factor to the change in iso-topic composition of precipitable water, the analysis period should start before the initiation of isotopic depletion and end at the most depleted point. We use the 6 h output of IsoGSM to calculate each term in Eq. (4); then each term is averaged over the targeting period and compared.
3 Evaluation of IsoGSM
3.1 Evaluation of IsoGSM at the mean state and seasonal climatology
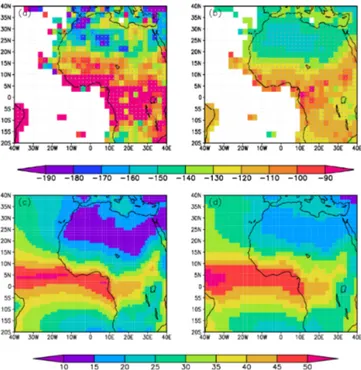
The annual mean climatology of the SCIAMACHY data and the collocated IsoGSM fields together with precipitable wa-ter by JRA25 (Japanese 25-year ReAnalysis; Onogi et al., 2007) and the model are shown in Fig. 1. In the SCIA-MACHY data, the meridional gradient over western Africa is notable; the lowest values of δD were found in the Sa-hara and the highest on the Guinea coast. This is due to the dry and therefore HDO-depleted air mass from the subsid-ing branch of the Hadley circulation in the dry season over the Sahara and strong evaporation and/or recycling of wa-ter in the tropics (Frankenberg et al., 2009). IsoGSM simu-lates this spatial pattern qualitatively well. Although the av-erage is negatively biased (about 20 ‰) (Yoshimura et al., 2011) and the latitudinal gradient is weaker in IsoGSM, bias and overestimated gradient are found in SCIAMACHY when compared with ground-based Fourier-transform spectrome-ters (Scheepmaker et al., 2014). Accordingly we cannot con-clude whether such differences from the satellite are indeed problematic or not at this stage.
Figure 2 shows time–latitude diagrams of δD and pre-cipitable water averaged on 5◦W–5◦E from 2003 to 2007. Over the region, vapor δD is high and wet in the monsoon season and low in the dry season. In the monsoon season, the wet and isotopically heavy vapor comes from the south, along with the monsoon flow. The northern end of the flow coincides with the location of the Intertropical Discontinu-ity (ITD), which limits the extension of the monsoon flow (Janicot et al., 2008). In the dry season, the subsiding branch of the Hadley cell brings a dry and depleted air mass to the north of the area (Frankenberg et al., 2009). At around 10◦N,
Figure 1. Annual mean δD (‰) in column vapor by (a)
SCIA-MACHY and (b) collocated IsoGSM. Regions in which the mea-surements did not pass the retrieval criteria were left blank. The shaded grid with dots represents the mean value of the average, which consists of at least 10 measurements within every 6 h. Annual mean precipitable water (kg m−2) by (c) JRA25 and (d) IsoGSM is also shown.
δD has two minima: one in winter, reflecting the depleting effect of subsidence, and the other in summer, reflecting the depleting effect of convective activity (Risi et al., 2010). The model captures these two regimes and the depleting effect of convective activity around 10◦N in the monsoon season. The Pearson product moment correlation coefficient (here-after we use the term “correlation” unless otherwise noted) between the observed and simulated zonally averaged δD (5◦W–5◦E) is 0.77 (significance level: P < 0.001). Note that the range is widely different between them (−300–0 ‰ for SCIAMACHY; −190–90 ‰ for IsoGSM). This may be be-cause IsoGSM misses the enrichment in boreal summer over tropical Africa, as suggested in previous studies (Franken-berg et al., 2009; Yoshimura et al., 2011). The bias in the mean field (Risi et al., 2010; Werner et al., 2011; Lee et al., 2012) and the underestimated seasonality (Risi et al., 2010) are also common in other GCMs. Again, the bias in SCIA-MACHY has also been indicated (Scheepmaker et al., 2014), and Risi et al. (2010) pointed out the possibility that SCIA-MACHY may overestimate the variability by preferentially sampling high altitudes.
Then we compared the simulated δ18Ovwith in situ
mea-surements from Tremoy et al. (2012) at the Niamey grid point over the 2010–2011 period. Figure 3 shows the time series of near-surface daily δ18Ovfrom the observation and
Figure 2. Time–latitude diagrams of δD (‰) in column vapor
aver-aged over 5◦W–5◦E from 2003 to 2007 by (a) SCIAMACHY and
(b) collocated IsoGSM. Regions in which the measurements did not
pass the retrieval criteria are left blank. The shaded grid with dots represents the mean value of the average, which consists of at least 10 measurements within every 6 h. The two lower panels show the same information as in (a–b) but for precipitable water (kg m−2) by
(c) JRA25 and (d) IsoGSM.
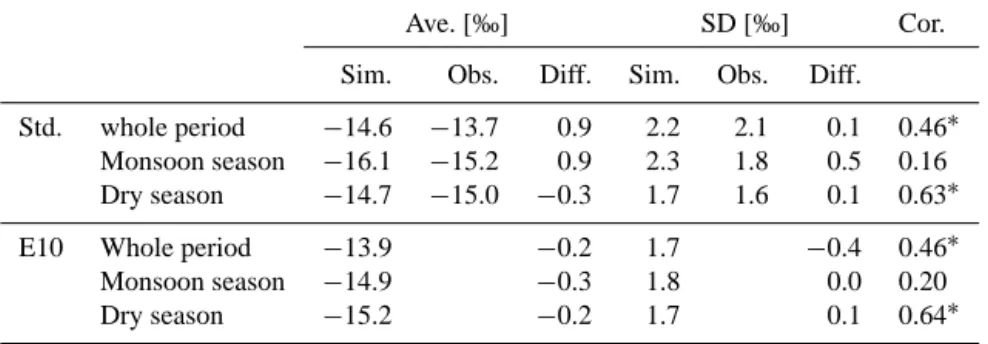
IsoGSM, and the statistics are summarized in Table 2. Note that only the days for which observations were available were used to calculate the statistics. These measurements also showed the two isotopic minima of the year (W-shape): the first in August and September and the second in January, associated with the convective activity and large-scale sub-sidence, respectively. The model captures the two minima nicely and simulates the average and variability well, espe-cially in the dry season. On the other hand, the model re-veals rather poor reproducibility of day-to-day variation dur-ing the monsoon season; the depletion and variability were both overestimated. In the sensitivity experiment E10, the av-erage and standard deviation (−14.9 and 1.8 ‰, respectively, for the monsoon season) were comparable with the obser-vation (−15.2 and 1.8 ‰), and the correlation was slightly improved. Although this does not fully explain the
discrep-Table 2. Averages (Ave.), standard deviations, their differences (simulations minus observations), and correlation coefficients (Cor.) for the
simulations and observations from the 2010 to 2011 time series.
Ave. [‰] SD [‰] Cor.
Sim. Obs. Diff. Sim. Obs. Diff. Std. whole period −14.6 −13.7 0.9 2.2 2.1 0.1 0.46∗
Monsoon season −16.1 −15.2 0.9 2.3 1.8 0.5 0.16 Dry season −14.7 −15.0 −0.3 1.7 1.6 0.1 0.63∗
E10 Whole period −13.9 −0.2 1.7 −0.4 0.46∗
Monsoon season −14.9 −0.3 1.8 0.0 0.20
Dry season −15.2 −0.2 1.7 0.1 0.64∗
∗P< 0.05.
ancy, it implies that the parameter controlling the equilib-rium fraction ε can be problematic. The positive points are that the δ18Ovand precipitation averaged over previous days
showed a strong correlation (R < 0.6) southwest of Niamey, as in the observation (Fig. S3 in Tremoy et al., 2012), which means that the relationship between convective activity and the δ18Ov is well represented and that the time evolution
on the monthly scale is comparable (thick lines in Fig. 3). The seasonal differences were similar, suggesting that SCIA-MACHY may overestimate the seasonal variability.
3.2 Evaluation of IsoGSM on the interannual scale
Finally we evaluate the reproducibility of IsoGSM on the in-terannual scale. Although our target is the isotope ratio of near-surface water vapor, we use the isotope ratio of precip-itation to validate the model reproducibility of surface va-por isotopes on the interannual timescale. There are two rea-sons for this: on the one hand, there is the lack of observa-tions of vapor isotopes covering several years; the other is the fact that the isotopic composition of the precipitation is strongly constrained by that of the local lower-tropospheric vapor (Risi et al., 2008a). Hence the precipitation isotope represents surface vapor isotopes to some extent, and can be used to evaluate the reproducibility of vapor isotopes, even though they are not identical.
Figure 4 compares the modeled and observed time series of annual mean δ18Opat Niamey. Note that there are missing
observations from 2000 to 2008 and after 2010. The corre-lation between them is 0.74 (P < 0.05). The simulated (ob-served) annual average is −4.6 (−4.1 ‰) and the standard deviation is 1.2 (1.1 ‰). The factors controlling the variabil-ity will be discussed in Sect. 4.
3.3 Overview of IsoGSM evaluation
To summarize the evaluation results, the spatial pattern in the mean state and the seasonal pattern driven by the Hadley cir-culation, monsoon flow, and convective activity are qualita-tively well simulated with an emphasis on the reproducibility
Figure 3. Temporal evolution from June 2010 to May 2011 of
near-surface δ18Ov(‰): the thin red and green lines are the daily
av-eraged observations and model values, respectively. The thick red and green lines connected by dots are the monthly averaged obser-vations and model values, respectively.
of the interannual variability. When compared with SCIA-MACHY measurements of δD, there is a slight bias in the mean state, and IsoGSM largely underestimates the seasonal
δD variations. When compared with the in situ measure-ments, the bias and variation differences are not as large as when compared with SCIAMACHY. Although the results of the simulation of the monsoon season are not as good as those of the dry season on the daily scale, IsoGSM captures the monthly-scale variability fairly well. These results sug-gest that the model is appropriate for studying the interannual variability of δ18O during the monsoon season.
4 Simulated interannual variability of vapor isotopes 4.1 General features of interannual variability
In this section, we explore the interannual variability of
δ18Ov over Niamey as given by the standard experiment.
The simulation period is from 1979 to 2012. The most strik-ing feature of the interannual variability is that the depletion in the monsoon season does not appear every year in the model (Fig. 4 and Fig. 5). In contrast, δ18Ovdepletion
oc-Figure 4. Interannual variability of annual mean δ18Op(‰) at
Ni-amey by the standard experiment (green) and by GNIP observation (red), together with that of near-surface δ18Ov(‰) during JAS at
Niamey by the standard experiment (black) and the sensitivity ex-periment NoFrac (white).
Figure 5. Seasonal variation of surface δ18Ov (‰) in W-shape
years (red) and NW-shape years (black). Bars denote the interan-nual standard deviations for each month of the two composite fields. Closed red squares indicate that the monthly δ18Ovin the W-shape
year differs significantly from NW-shape year (P < 0.05).
curs each winter. We term the years with isotopic depletion in the monsoon season the “W-shape year” following Tremoy et al. (2012). To understand the factors controlling the in-terannual variability of δ18Ov, it is necessary to investigate
the differences between the years with and without depletion. For the purpose of comparison, we set the criteria and made two composite fields: W-shape year composite and non-W-shape (NW-non-W-shape) year composite. The quantitative defini-tion of a W-shape year is a year in which the surface vapor isotope value averaged over JAS in Niamey is 1σ (1.1 ‰) less than that of the climatological average (−12.9 ‰). We picked out six W-shape years (1988, 1999, 2009, 2010, 2011, and 2012) in the period; the rest are appointed to the NW-shape composite. The seasonal variations in surface δ18Ovin
the two composite fields are shown in Fig. 5.
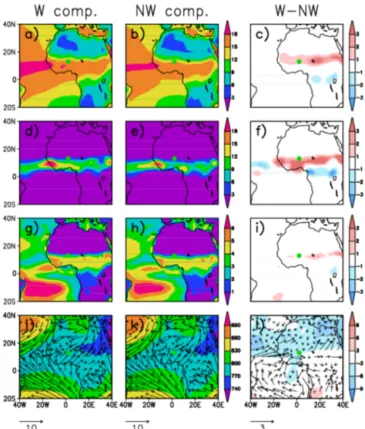
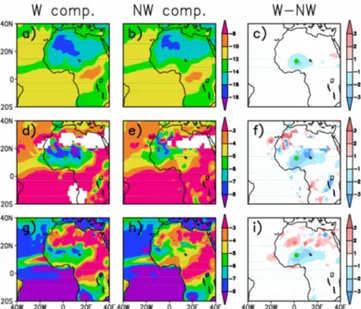
Figure 6. JAS average of 2 m height specific humidity (g kg−1)
(a) in W-shape years, (b) in NW-shape years, and (c) the
differ-ence between them. Panels (d–f): same as (a–c) but for precipitation (mm day−1). Panels (g–i): same as (a–c) but for evapotranspiration (mm day−1). Panels (j–l): same as (a–c) but for geopotential height at 925 hPa (gpm). Vectors denote wind at 925 hPa.
Here, we briefly discuss the features of the W-shape years. Figures 6 and 7 show the two composite fields and their dif-ferences (W-shape years minus NW-shape years) in the mon-soon season. W-shape years are characterized by enhanced monsoon activity; the velocities of southwesterly winds over western Africa are higher (Fig. 6, panel l), and latitudes south of 10◦N receive a larger amount of precipitation, especially on the Guinean coast and in the western and eastern Sahel (Fig. 6f). Due to the larger amount of precipitation, the level of evapotranspiration is also higher (Fig. 6i), and hence wet-ter conditions prevail (Fig. 6c) in W-shape years. The δ18Ov
is more depleted, as expected, centering on Niamey (Fig. 7c). The isotopic compositions of precipitation and evapotranspi-ration are also more depleted south of Niamey (Fig. 7f, i).
4.2 Factors controlling δ18Ovon interannual timescales
To identify the mechanism responsible for the difference in isotopic variability between W-shape and NW-shape years, isoflux analysis was applied to both composite fields. Here we analyze precipitable water instead of surface vapor for two reasons. The first is simplicity: by analyzing precipitable water, we do not have to consider at what height
conden-Figure 7. JAS average of isotopic composition of 2 m height vapor
(‰) (a) in W-shape years, (b) in NW-shape years, and (c) the dif-ference between them. Panels (d–f): same as (a–c) but for isotopic composition of precipitation (‰). Panels (g–i): same as (a–c) but for isotopic composition in evapotranspiration (‰).
sation and reevaporation take place, or the effect of verti-cal advection. The second reason is that most of the atmo-spheric water resides near the surface, and therefore the iso-topic composition of precipitable water should be useful as a proxy for surface δ18Ov. This kind of alternation is also
seen in Tremoy et al. (2012). As the analysis specifies the contribution of each factor to the change in the isotopic com-position of precipitable water, the analysis period should start before the initiation of isotopic depletion and end at the most depleted point. Since the seasonal variation in the isotopic composition of precipitable water is almost the same as the surface δ18Ov(Fig. 5), the analysis period was June–August
to capture the decrease in the isotopic composition of precip-itable water.
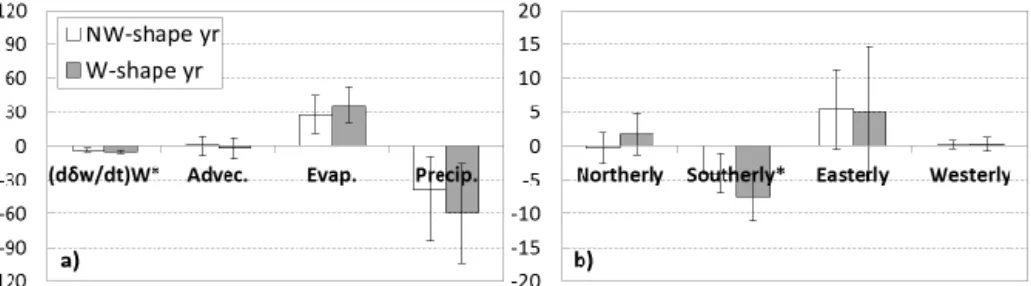
Figure 8 shows the results for the two composite fields in the Niamey grid cell. First, we discuss how each factor con-tributes to the δWvariation in general. Precipitation lowers
δW, which is reasonable when considering the Rayleigh
dis-tillation model. This means that δPis greater than δW;
there-fore, the effect of precipitation is always negative and con-tributes to lowering δW. Evapotranspiration works in the
op-posite way. As the model does not take fractionation into ac-count on the land surface, δEcan be assumed to be a mixture
of all precipitation (Yoshimura et al., 2008). Hence, δEis
pre-sumably larger than δW, by the same analogy used to explain
the effect of precipitation, and contributes to the increase in
δW. The impact of advection in this form in Eq. (4) seems
weaker compared with the other terms. However, the impact is the temporally averaged value. Given that advection some-times lowers the δWand sometimes enriches δW, the fact that
the averaged value is very low does not readily imply that the impact itself is small. Therefore, we further decompose the effect of advection in Eq. (4) into
∇δW·Q = ∂δW ∂y QN+ ∂δW ∂y QS+ ∂δW ∂x QE+ ∂δW ∂x QW, (5)
where QN, QS, QE, and QW represent the vertically inte-grated two-dimensional vapor flux vector from the north, south, east, and west, respectively. In this form, the impact of advection becomes clearer (Fig. 8b): southerly flow de-creases δW, and easterly flow increases δW. The precipitation
area in the south of Niamey which produces isotopically light moisture is considered to contribute decreased δW. On the
other hand there is relatively less area with precipitation in the east of Niamey, which should produce isotopically heav-ier moisture compared with the southern part, contributing to increase δW (Fig. 6). The impacts of the westerly flow and
northerly flow are ambiguous and negligible.
The (dδW/dt)W is low in W-shape years (P < 0.05).
Pre-cipitation further lowers δW and evapotranspiration further
increases δWin W-shape years, reflecting the larger amounts
of precipitation and evapotranspiration. Although the dif-ferences between the impacts of the two composite fields are large, they are not significant because of the high de-gree of variation. The only term significantly different at 5 % significance level other than (dδW/dt)W is the impact of
the southerly flow. When regressed with JAS-averaged sur-face δ18Ovon the interannual timescale, the term that shows
a strong correlation (P < 0.05) is the southerly flow alone. This suggests that the monsoon flow brings depleted mois-ture produced by heavier precipitation to the Niamey area, controlling the interannual variability of δ18Ov. The
interan-nual regression field of JAS-averaged precipitation against Niamey surface δ18Ovshows high correlation at the Guinea
coast (10◦W–10◦E, 0◦–10◦N; Fig. 9). This indicates the rel-ative importance of the distillation process during transport as compared to local precipitation for the interannual vari-ability of δ18Ovin western Africa.
In this regard, the correlation between δ18Ovand
precipi-tation east of Niamey, which is also located in the upstream region of Niamey, is expected to be strong because heavier precipitation falls in the eastern Sahel in W-shape years and the African Easterly Jet (AEJ) flows toward the Niamey gion at heights above 800 hPa. The correlation for this re-gion east of Niamey, however, is relatively weak (|R| < 0.4). As the southerly flow is dominant in the lower atmosphere (1000–800 hPa) in the monsoon season, the relatively weak connection between surface δ18Ov and precipitation east of
Niamey is reasonable.
4.3 Sensitivity experiment
To confirm the contributions of the amount of precipitation that falls on the Guinea coast to the interannual variability in
Figure 8. Panel (a): temporal derivative of isotopic composition in precipitable water during JJA and the contributions of advection,
evapo-transpiration, and precipitation to the vapor isotope change in NW-shape years (white) and W-shape years (grey) (‰ mm day−1). Panel (b): same as (a) but for the decomposed terms of the advection isoflux (‰ mm day−1).∗P< 0.05 between two composites.
Figure 9. Correlation coefficient between JAS-averaged δ18Ovat
Niamey (green dot) and precipitation. The contoured area represents statistical significance (P < 0.01).
NoFrac, in which we removed the influence of the distilla-tion process in the Guinea coast (10◦W–10◦E, 0◦–10◦N). As shown in Fig. 4, most of the interannual variability in
δ18Ovat Niamey was removed. In the standard experiment,
the average δ18Ovand the variance at Niamey are −12.9 ‰
and 1.16, respectively, whereas they are −11.7 ‰ and 0.15, respectively, in NoFrac. The enriched average and consider-ably smaller variance in NoFrac confirm the key role of the Guinea coast precipitation in controlling the interannual vari-ability of δ18Ovat Niamey. In addition, we conducted other
sensitivity experiments that were the same as the sensitiv-ity experiment NoFrac but for the eastern Sahel (10◦–30◦E, 10◦–20◦N) and Niamey (10◦–14◦E, 11◦–15◦N). Neither of these experiments showed a significant difference from the standard experiment (data not shown): the average and vari-ance were −12.8 (−12.8 ‰) and 1.07 (1.15), respectively, for the eastern Sahel (Niamey). These results exclude the im-pact of precipitation in the eastern Sahel or Niamey on con-trolling the interannual variability and enhance the robust-ness of our hypothesis.
5 Relationship with ENSO
Western African rainfall in the monsoon season has been connected to ENSO (e.g., Janicot et al., 2001; Joly et al., 2007; Losada et al., 2012); there is less precipitation dur-ing El Niño and more precipitation durdur-ing La Niña. Given this connection, a relationship between δ18Ov and ENSO
through precipitation change is expected. Indeed, three of six W-shape years (1988, 1999, and 2010) fell during a La Niña period. Therefore, we regressed JAS δ18Ov from the
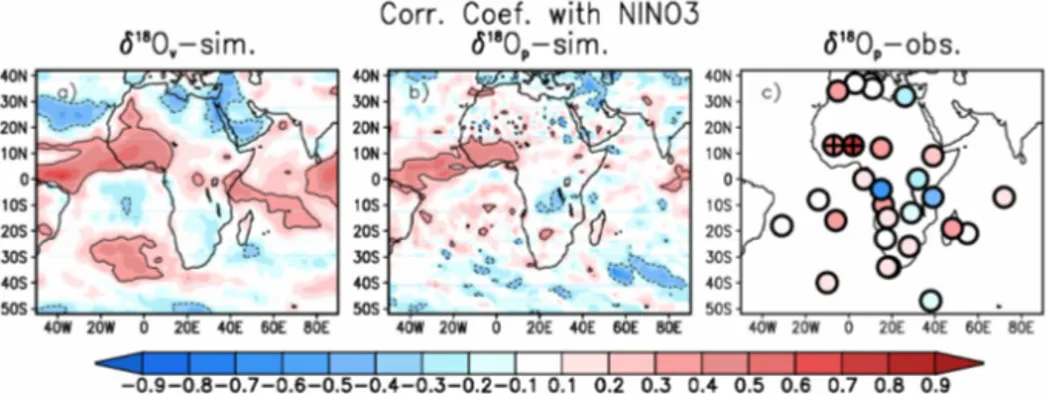
model and annually averaged the NINO3 index calculated from the NCEP SST analysis, which was used to force the model. High positive correlations were found in all of west-ern Africa (Fig. 10a). The spatial distribution of the cor-relation between the annual average of δ18Op weighted by
monthly precipitation and the annual averaged NINO3 in-dex was almost identical to that of the correlation between the δ18Ovand the NINO3 index, but the correlated area over
western Africa was confined to south of 15◦N (Fig. 10b). To validate this, we also show the relationship between observed
δ18Opfrom GNIP and the NINO3 index. The correlation
pat-tern agreed well with GNIP over most of Africa; the high-est positive correlation was in whigh-estern Africa, a weak nega-tive correlation was seen in the south of central and eastern Africa, and a weak positive correlation was found in south-ern Africa (Fig. 10c). All of the figures indicate that δ18O is significantly lower (higher) during the cold (warm) phase of ENSO over western Africa. The relationship between δ18O in western Africa and ENSO is evident from the figures. It re-sults from the relationship between δ18O and western African precipitation, as discussed in Sect. 4, and between the precip-itation and ENSO. This mechanism is also found in the Asian and South American monsoon regions: ENSO governs pre-cipitation, and the precipitation determines the interannual variability of the isotopic composition over the downstream regions (Vuille and Werner, 2005; Ishizaki et al., 2012).
ENSO is not the only mode affecting western African rain-fall (Janicot et al., 2001); global warming, Interdecadal Pa-cific Oscillation (IPO), and Atlantic Multidecadal Oscilla-tion (AMO) are found to have a significant impact (Mohino et al., 2011a) as well. Therefore, a nonstationary
relation-Figure 10. Correlation coefficient between annual averaged NINO3 index and (a) simulated July–September averaged vapor isotopes, (b)
an-nual averaged simulated precipitation isotopes weighted by monthly precipitation, and (c) anan-nual averaged observed precipitation isotopes weighted by monthly precipitation. Regions with significant positive (negative) correlations at the 90 % confidence level are enclosed by solid (dotted) lines in (a) and (b). Sites with significant correlations at the 90 % confidence level are indicated by crosses in (c).
ship between western African rainfall and ENSO (Janicot et al., 1996; Losada et al., 2012) has been reported, but this lies beyond the scope of the present study. Here, we wish to emphasize that we confirmed the statistical relationship between rainfall at the Guinea coast and ENSO in both the model (R = −0.45, P < 0.05) and observations (Global Pre-cipitation Climatology Project, GPCP; Huffman et al., 2009) (R = −0.43, P < 0.05) during the period 1979–2012. Losada et al. (2012) also showed that this relationship became sig-nificant after the 1970s. Hence, we ensured the robustness of the relationship between the isotope ratio in surface vapor, precipitation, and ENSO over western Africa.
6 Conclusion and outlook
Here, we presented the interannual variability of δ18Ov
in western Africa and its relationship to ENSO using the nudged IsoGSM model (Yoshimura et al., 2008). Our sim-ulation indicated that the isotopic depletion in the monsoon season, which was reported by Risi et al. (2010) and Tremoy et al. (2012), does not occur every year. The main driver of the depletion was found to be precipitation at the Guinea coast. Furthermore, we found a relationship between δ18O over western Africa and ENSO: ENSO modulates the in-terannual variability of δ18O via precipitation at the Guinea coast.
We showed the ability of the model to simulate intrasea-sonal to interannual timescale variability, but the model per-formed relatively poorly on the daily scale. The parameter controlling the equilibrium fraction ε is suggested to be prob-lematic. Another possibility is the lack of isotopic fractiona-tion over the land surface. Risi et al. (2013) demonstrated the importance of continental recycling and sensitivity to model parameters that modulate evapotranspiration over western Africa. They indicated the importance of taking land sur-face fractionation into account. As IsoGSM assumes that isotopic fractionation does not occur over the land surface, coupling with more sophisticated land surface models would
allow more accurate simulations. Similarly, an atmosphere– ocean-coupled model with stable isotopes is desirable to de-termine how ENSO impacts the isotope ratio above water more clearly.
One of the expected roles of isotope-enabled GCMs is to find “hot spots” – i.e., places in which a climate proxy is sen-sitive to climate change – for climate reconstruction. Here, we propose that δ18O at Niamey may be a good proxy of western African rainfall and its relationship to ENSO. In-deed, we found a good correlation between the simulated
δ18O and a climate proxy from Ghana, which has an ENSO signal (Shanahan et al., 2009) for their overlapping period (R = 0.65, P < 0.01). Despite the strong correlation, how-ever, ENSO is certainly not the only mode modulating δ18O in the area. In our simulation, the last 4 years were counted as W-shape years, in which surface δ18Ovwas lower at
Ni-amey and precipitation over western Africa was higher, even though not all of these were La Niña years. This may re-flect the recent La Niña-like trend associated with the hia-tus (Kosaka and Xie, 2013; England et al., 2014), supporting the impact of Interdecadal Pacific Oscillation (IPO) on west-ern African rainfall on a multidecadal timescale (Mohino et al., 2011a). On the other hand, Shanahan et al. (2009) re-constructed western African rainfall variability from the sed-iments of a lake in Ghana, supporting the suggestion that At-lantic SST controls multidecadal variability. Further compar-isons with in situ observations and climate proxies would be of interest.
This study confirms the relationship between western African rainfall and isotopic variability on the interannual timescale, which enables us to reconstruct detailed western African rainfall, and this should help disentangle the non-stationarity of the impact of various SST basins on western Africa rainfall.
Acknowledgements. The first author is supported by the Japan
Society for the Promotion of Science (JSPS) via a Grant-in-Aid for JSPS Fellows. Part of this research was supported by the SOUSEI from MEXT, Japan, CREST from JST, Japan, JSPS KAKENHI Grant Numbers 23686071, 26289160, and the GCOE for Sustainable Urban Regeneration at the University of Tokyo. R. Scheepmaker acknowledges support from the Netherlands Space Office as part of the User Support Programme Space Research project GO-AO/16.
Edited by: P. Jöckel
References
Aronson, R. B., Precht, W. F., Macintyre, J. G., and Mur-doch, T. J. T.: Coral bleach-out in Belize, Nature, 405, p. 36, doi:10.1038/35011132, 2000.
Berkelhammer, M., Stott, L., Yoshimura, K., Johnson, K., and Sinha, A.: Synoptic and mesoscale controls on the isotopic com-position of precipitation in the western US, Clim. Dynam., 38, 433–454, 2012.
Brown, J., Simmonds, I., and Noone, D.: Modeling δ18O in tropical precipitation and the surface ocean for present-day climate, J. Geophys. Res., 111, D05105, doi:10.1029/2004JD005611, 2006. Cai, W., Borlace, S., Lengaigne, M., Rensch, P., Collins, M., Vecchi, G., Timmermann, A., Santoso, A., McPhaden, M. J., Wu, L., England, M. H., Wang, G., Guilyardi, E., and Jin, F.-F.: Increasing frequency of extreme El Niño events due to greenhouse warming, Nat. Clim. Change, 4, 111–116, doi:10.1038/NCLIMATE2100, 2014.
Dai, A., Fung, I. Y., and Del Genio, A. D.: Surface observed global land precipitation variations during 1900–88, J. Climate, 10, 2943–2962, 1997.
Dansgaard, W.: Stable isotopes in precipitation, Tellus, 16, 436– 468, 1964.
England, M. H., McGregor, S., Spence, P., Meehl, G. A., Timmer-mann, A., Cai, W., Gupta, A., McPhaden, M. J., Purich, A., and Santoso, A.: Recent intensification of wind-driven circulation in the Pacific and the ongoing warming hiatus, Nat. Clim. Change, 4, 222–227, 2014.
Frankenberg, C., Yoshimura, K., Warneke, T., Aben, I., Butz, A., Deutscher, N., Griffith, D., Hase, F., Notholt, J., Schneider, M., Schrijver, H., and Röckmann, T.: Dynamic processes governing lower-tropospheric HDO/H2O ratios as observed from space and
ground, Science, 325, 1374–1377, 2009.
Folland, C. K., Palmer, T. N., and Parker, D. E.: Sahel rainfall and worldwide sea temperatures, 1901–85, Nature, 320, 602–607, 1986.
Giannini, A., Saravanan, R., and Chang, P.: Oceanic forcing of Sa-hel rainfall on interannual to interdecadal time scales, Science, 302, 1027, doi:10.1126/science.1089357, 2003.
Huffman, G. J., Alder, R. F., Bolvin, D. T., and Gu, G.: Improving the global precipitation record: GPCP Version 2.1, Geophys. Res. Lett., 36, L17808, doi:10.1029/2009GL040000, 2009.
IAEA/WMO, Global Network of Isotopes in Precipitation, The GNIP Database, available at: http://www.iaea.org/water, last ac-cess: 8 May 2014.
Ishizaki, Y., Yoshimura, K., Kanae, S., Kimoto, M., Kurita, N., and Oki, T.: Interannual variability of H182 O in precipitation over the Asian monsoon region, J. Geophys. Res., 117, D16308, doi:10.1029/2011JD015890, 2012.
Janicot, S., Moron, V., and Fontaine, B.: Sahel droughts and ENSO dynamics, Geophys. Res. Lett., 23, 515–518, 1996.
Janicot, S., Trzaska, S., and Poccard, I.: Summer Sahel-ENSO tele-connection and decadal time scale SST variations, Clim. Dy-nam., 18, 303–320, 2001.
Janicot, S., Thorncroft, C. D., Ali, A., Asencio, N., Berry, G., Bock, O., Bourles, B., Caniaux, G., Chauvin, F., Deme, A., Kergoat, L., Lafore, J.-P., Lavaysse, C., Lebel, T., Marticorena, B., Mounier, F., Nedelec, P., Redelsperger, J.-L., Ravegnani, F., Reeves, C. E., Roca, R., de Rosnay, P., Schlager, H., Sultan, B., Tomasini, M., Ulanovsky, A., and ACMAD forecasters team: Large-scale overview of the summer monsoon over West Africa during the AMMA field experiment in 2006, Ann. Geophys., 26, 2569– 2595, doi:10.5194/angeo-26-2569-2008, 2008.
Joly, M. and Voldoire, A.: Role of Gulf of Guinea in the interannual variability of the West African monsoon: what do we learn from CMIP3 coupled simulations?, Int. J. Climatol., 30, 1843–1856, 2010.
Joly, M., Voldoire, A., Douville, H., Terray, P., and Royer, J.-F.: African monsoon teleconnections with tropical SSTs: validation and evolution in a set of IPCC4 simulations, Clim. Dynam., 29, 1–20, 2007.
Joussaume, S., Sadourny, R., and Jouzel, J.: A general circulation model of water isotope cycles in the atmosphere, Nature, 311, 24–29, 1984.
Kanamitsu, M., Ebisuzaki, W., Woolen, J., Potter, J., and Fiorino, M.: NCEP-DOE AMIP-II Reanalysis (R-2), B. Am. Meteorol. Soc., 83, 1631–1643, 2002.
Kosaka, Y. and Xie, S.-P.: Recent global-warming hiatus tied to equatorial Pacific surface cooling, Nat. Clim. Change, 501, 403– 407, 2013.
Lai, C.-T., Ehleringer, J. R., Bond, B. J., and Paw, U. K. T.: Con-tributions of evaporation, isotopic non-steady state transpiration and atmospheric mixing on the δ18O of water vapour in Pacific Northwest coniferous forests, Plant Cell Environ., 29, 77–94, 2006.
Lamb, P. J.: Large-scale tropical Atlantic surface circulation pat-terns associated with Subsaharan weather anomalies, Tellus, 30, 240–251, 1978.
Lee, J.-E., Risi, C., Fung, I., Worden, J., Scheepmaker, R. A., Lin-der, B., and Frankenberg, C.: Asian monsoon hydrometeorol-ogy from TES and SCIAMACHY water vapor isotope mea-surements and LMDZ simulations: Implications for speleothem climate record interpretation, J. Geophys. Res., 117, D15112, doi:10.1029/2011JD017133, 2012.
Lézine, A.-M. and Casanova, J.: Pollen and hydrological evidence for the interpretation of past climates in tropical West Africa dur-ing the Holocene, Quaternary Sci. Rev., 8, 45–55, 1989. Liu, G., Kojima, K., Yoshimura, K., Okai, T., Suzuki, A., Oki, T.,
Siringan, F. P., Yoneda, M., and Kawahata, H.: A model-based test of accuracy of seawater oxygen isotope ratio record derived from a coral dual proxy method at southeastern Luzon Island, the Philippines, J. Geophys. Res.-Biogeo., 118, 853–859, 2013. Liu, Z., Yoshimura, K., Bowen, G. J., Buenning, N. H., Risi,
records reveal modern North American atmospheric dynam-ics during the Holocene, Nature communications, 5, 3701, doi:10.1038/ncomms4701, 2014.
Losada, T., Rodiriguez-Fonseca, B., Mohino, E., Bader, J., Jani-cot, S., and Mechoso, C. R.: Tropical SST and Sahel rainfall: A non-stationary relationship, Geophys. Res. Lett., 39, L12705, doi:10.1029/2012GL052423, 2012.
Mohino, E., Janicot, S., and Bader, J.: Sahel rainfall and decadal to multi-decadal sea surface temperature variability, Clim. Dynam., 37, 419–440, 2011a.
Mohino, E., Rodriguez-Fonseca, B., Losada, T., Gervois, S., Jani-cot, S., Bader, J., Ruti, P., and Chauvin, F.: Changes in the in-terannual SST-forced signals on West African rainfall. AGCM intercomparison, Clim. Dynam., 37, 1707–1725, 2011b. Moorthi, S. and Suarez, S. J.: Relaxed Arakawa-Schubert: A
param-eterization of moist convection for general circulation models, Mon. Weather Rev., 120, 978–1002, 1992.
Nicholson, S. E.: The West African Sahel: A review of recent stud-ies on the rainfall regime and its interannual variability, ISRN Meteorology, 2013, 1–32, 2013.
Onogi, K., Tsusui, J., Koide, H., Sakamoto, M., Kobayashi, S., Hat-sushika, H., Matsumoto, T., Yamazaki, N., Komahori, H., Taka-hashi, K., Kadokura, S., Wada, K., Kato, K., Oyama, R., Ose, T., Mannoji, N., and Taira, R.: The JRA-25 Reanalysis, J. Meteorol. Soc. JPN, 85, 369–432, 2007.
Palmer, T. N.: Influence of the Atlantic, Pacific and Indian Ocean on Sahel rainfall, Nature, 322, 251–253, 1986.
Philander, S. G. H.: Anomalous El Niño of 1982–1983, Nature, 305, p. 16, doi:10.1038/305016a0, 1983.
Polo, I., Rodriguez-Fonseca, B., Losada, T., and Garcia-Serrano, J.: Tropical Atlantic variability modes (1979–2002). Part I: Time-evolving SST modes related to West African rainfall, J. Climate, 21, 6457–6475, 2008.
Risi, C., Bony, S., and Vimeux, F.: Influence of convective pro-cesses on the isotopic composition (δ18O and δD) of precip-itation and water vapor in the tropics: 2. Physical interpre-tation of the amount effect, J. Geophys. Res., 113, D19306, doi:10.1029/2008JD009943, 2008a.
Risi, C., Bony, S., Vimeux, F., Descroix, L., Ibrahim, B., Le-breton, E., Mamadou, I., and Sultan, B.: What controls the isotopic composition of the African monsoon precipitation? Insights from event-based precipitation collected during the 2006 AMMA field campaign, Geophys. Res. Lett., 35, L24808, doi:10.1029/2008GL035920, 2008b.
Risi, C., Bony, S., Vimeux, F., Frankenberg, C., Noone, D., and Worden, J.: Understanding the Sahelian water budget through the isotopic composition of water vapor and precipitation, J. Geo-phys. Res., 115, D24110, doi:10.1029/2010JD014690, 2010. Risi, C., Noone, D., Frankenberg, C., and Worden, J.: Role of
con-tinental recycling in intraseasonal variations of concon-tinental mois-ture as deduced from model simulations and water vapor isotopic measurements, Water Resour. Res., 49, 4136–4156, 2013.
Rowell, D. P.: The impact of Mediterranean SSTs on the Sahelian rainfall season, J. Climate, 16, 849–862, 2003.
Scheepmaker, R. A., Frankenberg, C., Deutscher, N. M., Schnei-der, M., Barthlott, S., Blumenstock, T., Garcia, O. E., Hase, F., Jones, N., Mahieu, E., Notholt, J., Velazco, V., Landgraf, J., and Aben, I.: Validation of SCIAMACHY HDO/H2O
measure-ments using the TCCON and NDACC-MUSICA networks, At-mos. Meas. Tech. Discuss., 7, 11799–11851, doi:10.5194/amtd-7-11799-2014, 2014.
Schmidt, G. A., LeGrande, A., and Hoffmann, G.: Water iso-tope expressions of intrinsic and forced variability in a cou-pled ocean-atmosphere model, J. Geophys. Res., 112, D10103, doi:10.1029/2006JD007781, 2007.
Shanahan, T. M., Overpeck, J. T., Anchukaitis, K. J., Beck, J. W., Cole, J. E., Dettman, D. L., Peck, J. A., Scholz, C. A., and King, J. W.: Atlantic forcing of persistent drought in West Africa, Sci-ence, 324, 377–380, 2009.
Tindall, J. C., Valdes, P. J., and Sime, L. C.: Stable water iso-topes in HadCM3: Isotopic signature of El Niño-Southern Oscil-lation and tropical amount effect, J. Geophys. Res., 114, D04111, doi:10.1029/2008JD010825, 2009.
Tremoy, G., Vimeux, F., Mayaki, S., Souley, I., Cattani, O., Risi, C., Favreau, G., and Oï, M.: A 1-year long δ18O record of wa-ter vapor in Niamey (Niger) reveals insightful atmospheric pro-cesses at different timescales, Geophys. Res. Lett., 39, L08805, doi:10.1029/2012GL051298, 2012.
Tremoy, G., Vimeux, F., Soumana, S., Souley, I., Risi, C., Favreau, G., and Oï, M.: Clustering mesoscale convective systems with laser-based water vapor δ18O monitoring in Niamey (Niger), J. Geophys. Res., 119, 5079–5013, doi:10.1002/2013JD020968, 2014.
Vuille, M. and Werner, M.: Stable isotopes in precipitation record-ing South American summer monsoon and ENSO variability: ob-servations and model results, Clim. Dynam., 25, 401–413, 2005. Ward, N.: Diagnosis and short-lead time prediction of summer rain-fall in tropical North Africa at interannual and multidecadal timescales, J. Climate, 11, 3167–3191, 1998.
Werner, M., Langebroek, P. M., Carlsen, T., Herold, M., and Lohmann, G.: Stable water isotopes in the ECHAM5 gen-eral circulation model: Toward high-resolution isotope mod-eling on a global scale, J. Geophys. Res., 116, D15109, doi:10.1029/2011JD015681, 2011.
Worden J., Noone, D., and Bowmann, K.: Importance of rain evap-oration and continental convection in the tropical water cycle, Nature, 445, 528–532, 2007.
Yoshimura, K., Kanamitsu, M., Noone, D., and Oki, T.: Historical isotope simulation using Reanalysis atmospheric data, J. Geo-phys. Res., 113, D19108, doi:10.1029/2008JD010074, 2008. Yoshimura, K., Frankenberg, C., Lee, J., Kanamitsu, M., Worden,
J., and Röckmann, T.: Comparison of an isotopic atmospheric general circulation model with new quasi-global satellite mea-surements of water vapor isotopologues, J. Geophys. Res., 116, D19118, doi:10.1029/2011JD016035, 2011.