HAL Id: hal-02379116
https://hal.archives-ouvertes.fr/hal-02379116
Submitted on 25 Nov 2019
HAL is a multi-disciplinary open access
archive for the deposit and dissemination of
sci-entific research documents, whether they are
pub-lished or not. The documents may come from
teaching and research institutions in France or
abroad, or from public or private research centers.
L’archive ouverte pluridisciplinaire HAL, est
destinée au dépôt et à la diffusion de documents
scientifiques de niveau recherche, publiés ou non,
émanant des établissements d’enseignement et de
recherche français ou étrangers, des laboratoires
publics ou privés.
variations in soil physical and geochemical properties
Carole Bastianelli, Adam Ali, Julien Beguin, Yves Bergeron, Pierre Grondin,
Christelle Hély, David Paré
To cite this version:
Carole Bastianelli, Adam Ali, Julien Beguin, Yves Bergeron, Pierre Grondin, et al.. Boreal coniferous
forest density leads to significant variations in soil physical and geochemical properties. Biogeosciences,
European Geosciences Union, 2017, 14 (14), pp.3445-3459. �10.5194/bg-14-3445-2017�. �hal-02379116�
https://doi.org/10.5194/bg-14-3445-2017 © Author(s) 2017. This work is distributed under the Creative Commons Attribution 3.0 License.
Boreal coniferous forest density leads to significant variations in
soil physical and geochemical properties
Carole Bastianelli1,2,3,4, Adam A. Ali4,5, Julien Beguin2, Yves Bergeron4, Pierre Grondin6, Christelle Hély3,4,5, and David Paré2
1AgroParisTech, 16 Rue Claude Bernard, 75005 Paris, France
2Natural Resources Canada, Canadian Forest Service, Laurentian Forestry Centre, 1055 du P.E.P.S., P.O. Box 10380, Stn. Sainte-Foy, Québec, QC, G1V 4C7, Canada
3EPHE, PSL Research University, 4-14 Rue Ferrus, 75014 Paris, France
4NSERC–UQAT–UQAM Industrial Chair in Sustainable Forest Management, Forest Research Institute, Université du Québec en Abitibi-Témiscamingue, 445 Boulevard de l’Université, Rouyn-Noranda, QC, J9X 5E4, Canada 5Université de Montpellier, Place Eugène Bataillon, 34095 Montpellier, France
6Ministère des Forêts, de la Faune et des Parcs, Direction de la recherche forestière, 2700 Rue Einstein, Québec, QC, G1P 3W8, Canada
Correspondence to:Carole Bastianelli ([email protected]) Received: 12 January 2017 – Discussion started: 16 March 2017
Revised: 21 June 2017 – Accepted: 23 June 2017 – Published: 21 July 2017
Abstract. At the northernmost extent of the managed forest in Quebec, Canada, the boreal forest is currently undergo-ing an ecological transition between two forest ecosystems. Open lichen woodlands (LW) are spreading southward at the expense of more productive closed-canopy black spruce– moss forests (MF). The objective of this study was to inves-tigate whether soil properties could distinguish MF from LW in the transition zone where both ecosystem types coexist. This study brings out clear evidence that differences in vege-tation cover can lead to significant variations in soil physical and geochemical properties.
Here, we showed that soil carbon, exchangeable cations, and iron and aluminium crystallinity vary between boreal closed-canopy forests and open lichen woodlands, likely at-tributed to variations in soil microclimatic conditions. All the soils studied were typical podzolic soil profiles evolved from glacial till deposits that shared a similar texture of the C layer. However, soil humus and the B layer varied in thickness and chemistry between the two forest ecosystems at the pedon scale. Multivariate analyses of variance were used to evalu-ate how soil properties could help distinguish the two types at the site scale. MF humus (FH horizons horizons compos-ing the O layer) showed significantly higher concentrations of organic carbon and nitrogen and of the main exchangeable
base cations (Ca, Mg) than LW soils. The B horizon of LW sites held higher concentrations of total Al and Fe oxides and particularly greater concentrations of inorganic amorphous Fe oxides than MF mineral soils, while showing a thinner B layer. Overall, our results show that MF store three times more organic carbon in their soils (B+FH horizons, roots apart) than LW. We suggest that variations in soil properties between MF and LW are linked to a cascade of events in-volving the impacts of natural disturbances such as wildfires on forest regeneration that determines the vegetation struc-ture (stand density) and composition (ground cover type) and their subsequent consequences on soil environmental param-eters (moisture, radiation rate, redox conditions, etc.). Our data underline significant differences in soil biogeochemistry under different forest ecosystems and reveal the importance of interactions in the soil–vegetation–climate system for the determination of soil composition.
1 Introduction
Vegetation–soil interactions are complex and constitutive processes of ecosystem dynamics, materialised by functional feedback roles between plant communities and the soil
sys-tem (Richter and Yaalon, 2012; Van der Putten et al., 2013). Land-use changes or ecosystem shifts can have a wide range of impacts on soil properties such as nutrient availability, or-ganic matter content, soil structure, erosion or soil water re-pellency (Li and Richter, 2012; Van der Putten et al., 2013; Willis et al., 1997). Concurrently, soil properties are of great importance for vegetation establishment and maintenance in space and time (Kardol et al., 2006).
In the central portion of Quebec’s boreal zone, Canada, a southward expansion of open black spruce–lichen wood-lands (hereafter LW) is currently being observed at the ex-pense of more closed black spruce–moss forests (hereafter MF; Bernier et al., 2011; Girard et al., 2008, 2009; Rapanoela et al., 2016). The current ecosystem shift could be due to a change in the regional fire regime (Ali et al., 2012; Rapanoela et al., 2016) that likely occurred several thousands of years ago (Richard, 1979; Asselin and Payette, 2005) and consti-tutes a hot stake raised by forest ecologists and forest man-agers in so far as open black spruce–lichen woodlands are less productive and, consequently, sequester less carbon than closed moss forests (Rapanoela et al., 2016; Van Bogaert et al., 2015). MF are characterised by dense stands mainly composed of black spruce (Picea mariana) with a ground layer dominated by feather mosses (Pleurozium schreberi and others) and sphagnum (Sphagnum spp.). In LW, black spruce also stands as the dominant and quasi-exclusive tree species, yet tree density cover is a lot scarcer and the pre-dominant ground cover vegetation is composed of lichens, mostly Cladonia spp.
The main factors influencing soil formation, namely cli-mate, organisms, topography, parent material and time, also determine soil properties (Jenny, 1994; Lundström et al., 2000; Mourier et al., 2010). Soil formation is polygenetic and sensitive to ecosystem and vegetation changes (Richter and Yaalon, 2012). Transformation can be perceptible within a few years or decades, as it has already been observed fol-lowing land-use changes (e.g. Li and Richter, 2012; Richter and Yaalon, 2012). Some vegetation communities have com-monly been observed in association with specific soil types (Lundström et al., 2000, Mourier et al., 2010, Willis et al., 1997). Podzols are typically found in boreal spruce forests under well-drained conditions (Sanborn et al., 2011; Ugolini et al., 1981). Yet it is still unclear (i) what part pre-existing soil properties play in the establishment and maintenance of the different ecosystems and (ii) how the persistence of a spe-cific vegetation cover contributes to changing or maintaining specific soil properties. It is likely that both mechanisms co-exist by relying on many feedbacks.
We have several reasons to hypothesise that ecosystems with different ground vegetation types, humus thicknesses and stand densities such as MF and LW could induce dif-ferent soil geochemistry and soil horizon development. Dif-ferences in canopy openness and groundcover type may lead to variations in soil formation processes. MF soils should develop thicker accumulation (B) soil horizons as more
or-ganic matter inputs are provided by the denser vegetation, leading to higher nutrient availability (Bonan and Shugart, 1989; Haughian and Burton, 2015). Conversely, the low-density canopy in LW should provide a lower nutrient sup-ply, along with higher light and heat (Haughian and Bur-ton, 2015; Sulyma and Coxson, 2001), leading to differ-ent soil microclimatic conditions. Variations in hydrologi-cal processes are to be expected beneath both ground cov-ers as moss laycov-ers, which have a high water holding ca-pacity, create a saturated environment that is less favourable to decomposition, whereas lichen layers may maintain soil moisture at lower levels (Bonan and Shugart, 1989). Wa-ter fluxes, insulation properties and soil acidity may have a great influence on chemical reactions during pedogenesis, particularly redox conditions, chemical element associations, and exchangeable cation circulation and mobilisation (Schw-ertmann, 1985; Brimhall and Dietrich, 1987). Lichens are also reported to be strong physical and chemical weather-ing agents of rock surfaces (Chen et al., 2000; Porada et al., 2014), while moss layer thickness may lead to a diffuse and weaker weathering. Differences in pedoclimate (Duchaufour, 1990) hydrological processes such as water fluxes, snowmelt rate, and drainage conditions (Buurman and Jongmans, 2005; Schaetzl and Isard, 1996), organic matter dynamics (Buur-man and Jong(Buur-mans, 2005) or weathering rate (Lundström et al., 2000) could deeply impact the podzolisation process.
Our main research objective was therefore to determine how soil biogeochemical properties and soil horizon devel-opment differ between two forest ecosystems, which are de-fined by different stand densities and ground vegetation com-positions, but which both developed from glacial deposit in the transition region where both open- and closed-canopy forests occur as adjacent patches at the landscape scale. This is the first attempt, to our knowledge, in trying to identify a biogeochemical signature of boreal forest with open versus closed-canopy conditions – two states that are common to boreal forests of North America and Eurasia. In particular, this pedological investigation constitutes a first step to un-derstand the implications of changes in boreal forest canopy openness that have happened and that will happen in the fu-ture.
We hypothesised that soils would be richer under dense forests with a moss cover that has higher C and N contents and higher base cation concentrations than lichen cover. Be-cause iron complexation with organic compounds is a domi-nant process in podzolic B mineral horizons and is sensitive to properties such as soil pH, organic matter content or soil erosion (Holmgren, 1967; Li and Richter, 2012; McBride, 1987), we also hypothesised that the podzolisation process and hence iron reactive chemical species would be differ-ent depending on the local vegetation density. We assumed that the conditions found in soils covered by a lichen mat with low-density canopy would be more prone to iron and aluminium oxide accumulations than MF soils. Schaetzl et al. (2015) argued that water fluxes have a great influence on
the intensity of podzolisation especially because they control the mobility of soluble organic complexes onto the soil pro-files. Snow, snowmelt and deep percolation may thus vary between MF and LW because of tree density and lichen or moss cover.
We therefore used an exploratory approach focusing on soil horizon thickness, carbon and nitrogen contents, base cation concentrations (Ca, Mg, K, Na), and species of iron (Fe) and aluminium (Al; organically bound and oxides) as elements of interest and investigated their relations with veg-etation properties. Our study was first conducted at the pe-don scale for a local approach (lichen vs. moss cover) on a 1 m2basis, and analyses were secondly run at the site scale (∼ 10 ha, LW vs. MF) to assess whether local observations could be generalised to the ecosystem.
2 Materials and methods 2.1 Study sites
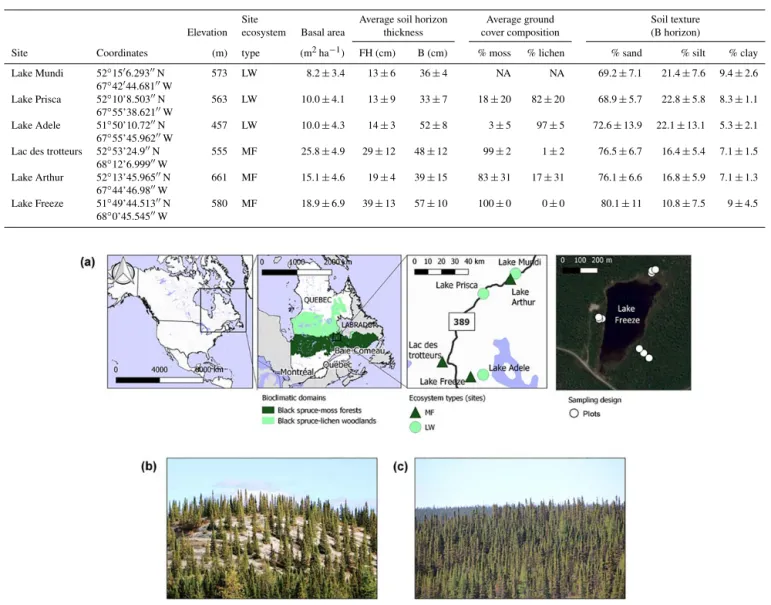
The study area was located in the Canadian northern region of the Manicouagan crater in Quebec in the north portion of the moss forest ecological domain (Fig. 1). Our study area covered approximately 900 km2. Climatic data from the near-est reported station in Wabush Lake (52◦550N, 66◦520W; 551 m elevation, located 150–200 km northwest of our study sites) show a mean annual temperature of −3.1 ± 3.3◦C and mean annual precipitation of 840 mm, with 51 % falling as snow, for the 1981–2010 period. The number of degree days above 5◦C for the period 1981–2010 was 817 per year (Envi-ronment Canada, 2013). Black spruce (Picea mariana (Mill.) BSP) was the dominant tree species in the area, but bal-sam fir (Abies balbal-samea (L.) Mill) was also scarcely found in MF. Groundcover vegetation was mostly composed of feather mosses (Pleurozium schreberi and others) with occa-sional patches of Sphagnum spp. in MF, while it was mostly composed of Cladonia spp. in LW. While vegetation in the area was essentially composed of black spruce–lichen wood-lands north of the 52nd parallel and of black spruce–moss forests in the south, patches of both ecosystems could be found in a patchy distribution throughout the area. The study area was particularly relevant for our comparative study in so far as it presented a patchy distribution of plots covered by moss and lichen developed from glacial deposit, within regional sites of LW and MF ecosystems. Types of deposit were still slightly different from site to site (e.g. undiffer-entiated till, dead-ice moraine). We selected six independent sites (experimental units or EUs): three sites dominated by an MF ecosystem and three other sites dominated by an LW ecosystem (Table 1). Sites were preselected based on satel-lite images and maps of the vegetation ecological domains and of the surface deposit types to focus on ecological re-gion 6P (côteaux du lac Caopacho) defined by the Ministère des Forêts, de la Faune et des Parcs du Québec. Site
selec-tion was then validated through a field prospecselec-tion. Each site was centred on a small headwater lake. Three transects were delineated per site; they extended from the lake shore out of the riparian zone up to 30 m. Sample plots were placed along each transect at distances of 10, 20 and 30 m from the end of the riparian area surrounding the lake, identified by the pres-ence of Chamaedaphne calyculata. At each plot, soil samples were collected as described below. Stand characteristics were evaluated by measuring the basal area using a wedge prism relascope (factor 2) and by listing the measured tree species. Groundcover vegetation composition and abundance (in %) was estimated on a 1 m2area per plot prior to soil sampling; visual estimates were summed to 100 %. Our design for a given forest type was therefore composed of three EUs and nine sampling plots per EU, for a total of 27 soil sampling plots per ecosystem type (MF vs. LW, 54 altogether). This experimental design was conceived for further investigations linking soil and lake sediment composition at the watershed scale. Indeed, it corresponds to the first step of a palaeoe-cological investigation aiming to retrace the opening of the landscape over time using geochemistry analysis from lacus-trine deposits. Before proceeding further, it was fundamen-tal to test and demonstrate that nowadays the two types of ecosystem (LW and MF) display significant differences in soil properties at the watershed scale. Although the ecosys-tem type was determined at the lake watershed scale, plots within a site could display non-typical cover vegetation. For instance, local lichen patches could be found in some plots belonging to the MF ecosystem and vice versa. For practi-cal purposes, lower case letters were therefore used when referring to vegetation type at the plot scale (lw and mf), while upper case letters were used when referring to the lake watershed/ecosystem (LW, MF). The most distant sites were 100 km apart. A general description of each site is given in Table 1. For statistical analyses including lichen and moss covers, binary values were attributed to plots depending on the dominant vegetation cover type.
2.2 Soil sampling and treatment
Soils in the study area were typical podzols whose devel-opment in northern Quebec dated back to the colonisation of bare grounds by the boreal forest after glaciation 9000 to 13 000 years ago (Lundström et al., 2000). Podzolisation is favoured by conifer stands and is formed by precipitation of litter organic matter that engages the mobilisation of soil Al and Fe (Buurman and Jongmans, 2005). The different meth-ods used for sampling individual soil horizons are schema-tised on Fig. S1 in the Supplement. A 20 × 20 cm2template was used to sample the organic layer (FH horizon) after dis-carding the live green moss or lichen portion. Mineral soil fractions were sampled in each horizon. Soil samples of the mineral B and C horizons were collected in every plot (to-tal N = 54 for both forest types) in June and September 2015 and in one out of the three plots per transect (10 m from the
Table 1. General information and description of the six sites of study. LW is lichen woodland, and MF is moss forest. Values of basal area, ground cover composition and soil horizon thickness are given as means ± standard deviations to illustrate intra-site variability. Means where calculated from nine plots per site, regardless of the local ground cover type, but rather considering the regional ecosystem-type of the site they belonged to. NA means not determined during field sampling because of a fire that burned the forest in 2007.
Site Average soil horizon Average ground Soil texture
Elevation ecosystem Basal area thickness cover composition (B horizon)
Site Coordinates (m) type (m2ha−1) FH (cm) B (cm) % moss % lichen % sand % silt % clay
Lake Mundi 52◦1506.29300N 573 LW 8.2 ± 3.4 13 ± 6 36 ± 4 NA NA 69.2 ± 7.1 21.4 ± 7.6 9.4 ± 2.6 67◦42044.68100W Lake Prisca 52◦10’8.50300N 563 LW 10.0 ± 4.1 13 ± 9 33 ± 7 18 ± 20 82 ± 20 68.9 ± 5.7 22.8 ± 5.8 8.3 ± 1.1 67◦55’38.62100W Lake Adele 51◦50’10.7200N 457 LW 10.0 ± 4.3 14 ± 3 52 ± 8 3 ± 5 97 ± 5 72.6 ± 13.9 22.1 ± 13.1 5.3 ± 2.1 67◦55’45.96200W
Lac des trotteurs 52◦53’24.900N 555 MF 25.8 ± 4.9 29 ± 12 48 ± 12 99 ± 2 1 ± 2 76.5 ± 6.7 16.4 ± 5.4 7.1 ± 1.5
68◦12’6.99900W
Lake Arthur 52◦13’45.96500N 661 MF 15.1 ± 4.6 19 ± 4 39 ± 15 83 ± 31 17 ± 31 76.1 ± 6.6 16.8 ± 5.9 7.1 ± 1.3
67◦44’46.9800W
Lake Freeze 51◦49’44.51300N 580 MF 18.9 ± 6.9 39 ± 13 57 ± 10 100 ± 0 0 ± 0 80.1 ± 11 10.8 ± 7.5 9 ± 4.5
68◦0’45.54500W
Figure 1. Overview of the study area and sites. (a) Geographical localisation of the study area and distribution of the study sites (experimental units). The study area is located in Quebec, Canada, at a latitude of 52◦N and a longitude of 67–68◦W. The right panel presents the sampling design as undertaken in each EU around the watershed lake with three transects and three sampled distances (plots) by transect using a basemap from google maps openlayers. (b) Open black spruce–lichen woodland. (c) Closed black spruce–moss forest.
lakeshore) for the FH horizon (N = 18). In addition, the top 15 cm of the B horizon was collected volumetrically using a 5 cm diameter metal corer. Samples of the C horizon were re-trieved with a soil auger as soon as the B-to-C horizon limit was reached. All soil samples were air dried, sieved at 2 mm and weighed. This fraction was used for conventional anal-ysis (pH, texture). Samples were ground at 500 µm for geo-chemical analyses. C and N stocks as well as those of Al and Fe species were estimated and reported for the FH layer and the B top layer.
2.3 Geochemical analyses
2.3.1 Soil primary characteristics
Total C and N contents (%) were measured on all soil sam-ples by combustion using an induction furnace (Leco® Tru-Mac CNS Analyzer) following sieving at 2 mm, drying and grinding at 0.5 mm. The combustion is performed at 1350◦C under an oxygen gas atmosphere which turns C and N forms to CO2, N2 and NOx. Gaz concentrations are then deter-mined by thermal conductivity and infrared detection. pH values and effervescence to HCl indicated the absence of
carbonate. pH was determined by potentiometric titrations in deionised water. Soil texture was determined by soil frac-tionation and grain size sedimentation following instructions from Carter (1993).
2.3.2 Exchangeable ions and extractable phosphorous Soil samples were treated with an extracting Mehlich 3 so-lution (CH3COOH 0.2M, NH4NO3 0.25M, NH4F 0.015M, HNO3 0.013M, EDTA 0.001M) at a 1 : 10 ratio (Mehlich, 1984). Concentrations of exchangeable ions and extractable phosphorous (P) were then analysed by inductively cou-pled plasma atomic emission spectroscopy (ICP-AES). The Melich 3 solution mainly extracts exchangeable and soluble cations and phosphorus under aluminium, calcium and iron phosphate forms. Cationic exchange capacity (CEC) was cal-culated as the sum of exchangeable cation concentrations (K, Ca, Mg, Mn, Al, Fe, Na). Base saturation was calculated as the sum of main base cations (Ca + Mg + K + Na) divided by the CEC.
2.3.3 Reactive Fe and Al chemical species
Podzols are characterised by a B horizon predominantly made up of amorphous material constituted of organic matter bounded at different degrees to Al and Fe oxides and hydrox-ides (Canadian Soil Survey Committee, 1978; Lundström et al., 2000). Chemically bound species of Fe and Al were ex-tracted from mineral soil samples by means of three chemi-cal methods that rely on different reduction reagents: sodium pyrophosphate (Na4P2O7), ammonium oxalate (C2H8N2O4) and dithionite–citrate–bicarbonate (Na2S2O4, Na3C6H5O7, NaHCO3; Pagé and Kimpe, 1989). We followed the ex-traction protocols of Mehra and Jackson (1960) and McK-eague (1978). Concentrations of extracted ions were then analysed by ICP-AES. Species extracted by pyrophosphate, oxalate and dithionite–citrate reagents will be respectively referred to as “pyro”, “oxa” and “dit” hereafter. Pyrophos-phate is the weakest extractor, known to specifically isolate organically bound iron (Fepyro). Oxalate removes Fepyroas well as the inorganic amorphous iron (Feoxa). Dithionite– citrate removes Fepyro, Feoxa and crystalline iron (Fedit), i.e. most Fe species (Mehra and Jackson, 1960; Blume and Schwertmann, 1969; McKeague et al., 1971). Al species ex-tracted by all three methods are reported to be of similar na-ture as Fe species, although extractions may be less specific and result in some overlaps (McKeague et al., 1971). In par-ticular, quantities of Al extracted by oxalate (Aloxa)may be higher than quantities extracted by dithionite–citrate (Aldit) in some cases such as in acid soils or podzols (Johnson and Todd, 1983; Pagé and Kimpe, 1989). McKeague et al. (1971) showed that these two extractants are less useful for distin-guishing species of Al in soils than for Fe species. Relying on iron extraction specificity, relative quantities of crystalline iron (e.g. goethite, hematite) can be obtained by subtracting
the quantities of iron extracted with oxalate from those ex-tracted with dithionite–citrate (FeCRI=Fedit−Feoxa). Amor-phous inorganic iron, also designed as short-range order (SRO) mineral phases, is calculated by FeSRO=Feoxa− Fepyro (Johnson and Todd, 1983; Pagé and Kimpe, 1989). Finally, we computed the commonly used iron crystallinity index (CI = Fedit: Feoxa)in order to asses soil development rate (Arduino et al., 1984; Blume and Schwertmann, 1969). Amorphous iron species gradually aggregate into crystalline forms during the pedogenesis process, which makes them good indicators of soil age (Arduino et al., 1984; Johnson and Todd, 1983).
2.4 Statistical analyses
To test the influence of spatial scale on associations of soil properties and belowground geochemistry between forest types, we performed statistical analyses at two different spa-tial scales: one at the soil pedon scale (plot scale) and another at the lacustrine watershed scale (site scale). At the plot scale, we tested for differences in each soil property between lw and mf using a mixed analysis of variance (ANOVA) with the variables “site” as random intercept, “transect” nested into “site” as random intercept, and the dominance of moss vs. lichen as the fixed effect. All mixed models were fitted using the nlme R package (Pinheiro et al., 2016) in the R envi-ronment (R Core Team, 2013). We then assessed covariances among aboveground attributes of vegetation (stand basal area and percent cover of moss and lichen) and chemical vari-ables using partial least squares canonical analysis (PLSCA) and cross-correlation tests. PLSCA identifies latent variables (“orthogonal canonical component”) that maximise correla-tions between two sets of variables given symmetric roles. PLSCA also makes it possible to calculate the proportion of variance explained by each orthogonal canonical compo-nent of one set into the other and to determine the “intra-group community index” (Tenenhaus, 1998) that represents the weight of one variable in a set in explaining variations of variables in the other set. To this effect, we grouped the vegetation variables estimated at the plot scale (e.g. basal area, moss and lichen cover) into one set of variables and the soil geochemical variables into another set. PLSCA was performed using the plsdepot R package (Sanchez, 2012).
Then, to determine whether association patterns between vegetation attributes and geochemical soil properties at the soil profile level could be scaled up at the site scale, we performed a permutational multivariate analysis of variance (PERMANOVA) to test whether geochemical soil properties differed among ecosystem types (LW vs. MF). Following the parsimony principle, we restricted the number of soil chem-ical variables in our analyses to the five elements (Aloxa, FeSRO, AlSRO, Ca and Fe) that had the highest intragroup community indexes relative to vegetation components in the PLSCA. The justification for this choice is that variables that have a low intragroup community index are loosely linked to
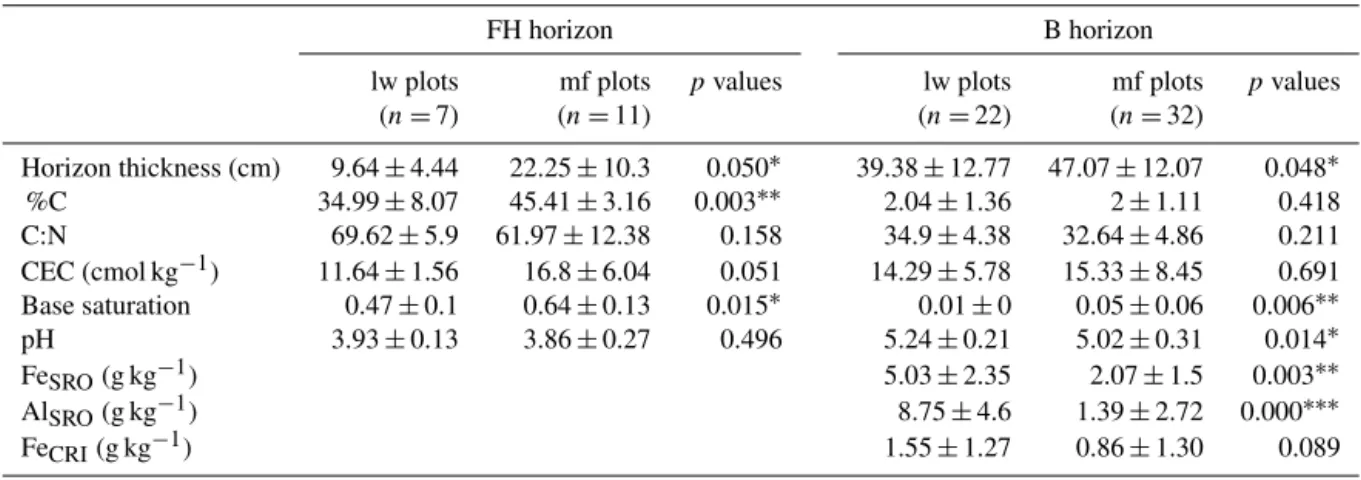
Table 2. Characteristics of FH and B horizons in mf and lw plots. The lw plots are plots covered by lichen woodlands, and the mf plots are plots covered by moss forests. Values are given as means ± standard deviations. “SRO” stand for short-range order species and “CRI” for crystalline species. Asterisks indicate statistical significance using mixed models (see Materials and methods), with∗pvalue < 0.05,∗∗p value < 0.01 and∗∗∗pvalue < 0.001.
FH horizon B horizon
lw plots mf plots pvalues lw plots mf plots pvalues
(n =7) (n =11) (n =22) (n =32) Horizon thickness (cm) 9.64 ± 4.44 22.25 ± 10.3 0.050∗ 39.38 ± 12.77 47.07 ± 12.07 0.048∗ %C 34.99 ± 8.07 45.41 ± 3.16 0.003∗∗ 2.04 ± 1.36 2 ± 1.11 0.418 C:N 69.62 ± 5.9 61.97 ± 12.38 0.158 34.9 ± 4.38 32.64 ± 4.86 0.211 CEC (cmol kg−1) 11.64 ± 1.56 16.8 ± 6.04 0.051 14.29 ± 5.78 15.33 ± 8.45 0.691 Base saturation 0.47 ± 0.1 0.64 ± 0.13 0.015∗ 0.01 ± 0 0.05 ± 0.06 0.006∗∗ pH 3.93 ± 0.13 3.86 ± 0.27 0.496 5.24 ± 0.21 5.02 ± 0.31 0.014∗ FeSRO(g kg−1) 5.03 ± 2.35 2.07 ± 1.5 0.003∗∗ AlSRO(g kg−1) 8.75 ± 4.6 1.39 ± 2.72 0.000∗∗∗ FeCRI(g kg−1) 1.55 ± 1.27 0.86 ± 1.30 0.089
variables of the other set (Tenenhaus, 1998). PERMANOVA performs a permutational MANOVA procedure (Anderson, 2001; McArdle and Anderson, 2001) on similarity matrices (here obtained using Euclidean distances) taking the hierar-chical structure of the experimental design into account in order to test whether the locations of centroids differ among the groups of interest in multivariate space. The three tested factors were (1) ecosystem type (LW vs. MF) as the fixed ef-fect, (2) site as the random effect (N = 6) and (3) transect as the random effect nested within site (N = 18, or 3 per site). Most importantly, we avoided any pseudo-replication issue by testing the effect of ecosystem type (LW vs. MF) with the random variable “site” as the error term (ddl of error term = 4; see Table 5). Moreover, to ensure valid re-sults, we normalised our data prior to analysis and used the Monte Carlo method to maximise the number of permuta-tion combinapermuta-tions when estimating the p value (Anderson, 2001; McArdle and Anderson, 2001). PERMANOVA was performed using Primer 6 software (Anderson, 2001; McAr-dle and Anderson, 2001). We also tested whether multivariate dispersions around each group’s centroid were homogeneous between the LW and MF ecosystem types using the vegan R package (Oksanen et al., 2016).
3 Results and discussion 3.1 Soil profile analysis
Soil profiles from the two vegetation cover types showed vi-sually prima facie pedological differences at the plot scale. All horizons were thicker under the mf cover than under lw cover (Fig. 2a, Table 2). Colours, although not defined with a soil handbook, also differed among soil profiles: while we observed a reddish to light yellow B horizon in lw plots, they were darker and browner in mf plots (Fig. 2b and c). Colour
hues of mineral horizons have been reported to reflect var-ious species and concentrations of Fe(III) oxides (Arduino et al., 1984; Schwertmann, 1985), known as indicators of soil age and soil weathering rate. The more important the pedogenic process of Fe reduction and subsequent removal are, the less colourful the soils are, displaying mostly the grey colours of the silicate matrix (Schwertmann, 1985). It is thus likely that pedogenic processes differ between lw and mf plots. Because all sites developed from a similar geomor-phological base (glacial deposit), we thought that the differ-ences observed could portend different developmental or for-mation processes depending on the vegetation cover. Regard-ing texture prospection, we found no significant differences (p value > 0.1) in the mean percentages of sand, clay and silt between mf and lw samples of the C horizon nor in the mean percentage of sand and clay of the B horizon (Table 1). 3.2 Soil chemical properties
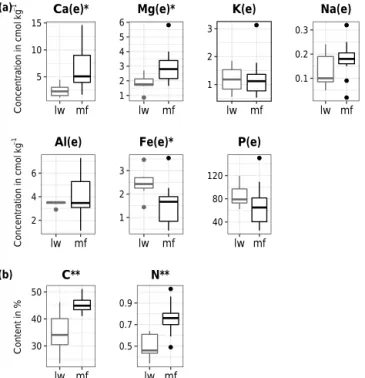
Regarding the FH humus layer, C and N concentrations were 30 to 50 % higher in mf plots than in lw plots (Fig. 3, Ta-ble 2). Concentrations of the two dominant exchangeaTa-ble base cations (Ca, Mg) were respectively 2.5 and 1.5 times higher in mf humus than in lw humus (Fig. 3). This trans-lated into direct consequences on humus cation exchange ca-pacity, which was ∼ 50 % higher in mf than in lw. However, no difference in humus pH was observed between mf and lw (Table 2).
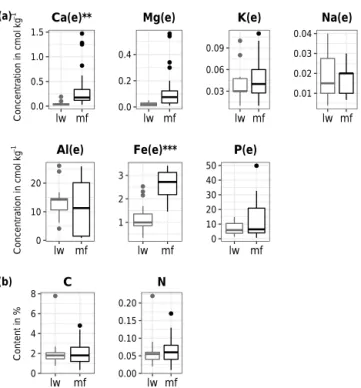
With regard to the B horizon, contrary to the FH horizon, we detected no difference in C or N concentrations between mf and lw plots (Fig. 4, Table 2). As previously reported in acid soils of North American boreal coniferous forests (Bo-nan, 1990), the N concentration in mineral soil was very low (0.5–0.8 %). The B horizon appeared to have higher Ca and Mg concentrations in mf than in lw, while other ion concen-trations were similar between plot types (Fig. 4). Regarding
Figure 2. Soil profiles in mf and lw plots. (a) Average thicknesses of the litter, FH, Ae and B horizons. Labels inside stacked bars refer to each horizon’s thickness average. (b) Picture taken in the field of a soil profile representative of lw. (c) Picture taken in the field of a soil profile representative of mf. Soil profiles were composed of a thin eluvial pale grey horizon (Ae), a mineral B horizon whose colour varied between sites from light, reddish to dark brown and faded to paler colours with depth, and a grey mineral C horizon.
5 10 15 lw mf Ca(e)* 1 2 3 4 5 6 lw mf Mg(e)* 1 2 3 lw mf K(e) 0.1 0.2 0.3 lw mf Na(e) 2 4 6 lw mf Al(e) 1 2 3 lw mf Fe(e)* 40 80 120 lw mf P(e) 30 40 50 lw mf C** 0.5 0.7 0.9 lw mf N** (a) (b) Content in % Co nc en tr at io n i n c m ol kg − 1 Co nc en tr at io n i n c m ol kg − 1
Figure 3. Distributions of chemical compounds in the FH hori-zon in lichen woodland and moss forest plots (lw and mf, respec-tively). (a) Concentrations of exchangeable base cations and ex-tractable P, (b) organic C and N. Boxplots represent the distribu-tion around the median values. “(e)” indicates exchangeable or ex-tractable elements. Asterisks indicate a significant difference using mixed models (see Materials and methods), with∗pvalue < 0.05,
∗∗
pvalue < 0.01 and∗∗∗pvalue < 0.001.
the pH, mf B horizons were ∼ 5 % more acidic than lw B horizons (Table 2).
Concerning the C horizon, as expected, C percentage was lower in this deep horizon than in the FH and B horizons (Table S1 in the Supplement). However, the percentage of C was ∼ 2 times higher in the C horizons of mf plots than in that of lw plots (Table S1). This organic enrichment can only have a biological origin coming from the upper layers as no C is provided by the mineral parent material in these acidic soils evolved from a granitic bedrock. Similarly, extractable phosphorous (P) was 2.5 times higher in the lw C horizon than in that of mf. The accumulation of products of mineral weathering as well as the migration of organic P compounds could explain this difference.
3.3 Fe and Al reactive species in mineral horizons Our results for the different Fe and Al species in the B hori-zon show that ranges of organically bound metal concentra-tions (Fepyro, Alpyro)were similar in lw and mf plots (Fig. 5). However, lw B horizon exhibited 1.5 to 2.5 times higher con-centrations of Fe and Al extracted by oxalate and dithionite– citrate than mf B horizon. In compliance with other studies performed in acid forest soils (Johnson and Todd, 1983), we observed higher concentrations of Aloxa than Aldit(Fig. 5). The main difference between lw and mf B horizons lay in the proportion of inorganic amorphous Fe and Al (FeSRO, AlSRO; Fig. 5, Table 2) while crystalline iron concentrations (FeCRI) were similar (Table 2).
In the C horizon, no major variations in Al and Fe species concentrations could be observed between lw and mf plots (Table S1). This deeper horizon was also less concentrated
0.0 0.5 1.0 1.5 lw mf Ca(e)** 0.0 0.2 0.4 lw mf Mg(e) 0.03 0.06 0.09 lw mf K(e) 0.01 0.02 0.03 0.04 lw mf Na(e) 0 10 20 lw mf Al(e) 1 2 3 lw mf Fe(e)*** 0 10 20 30 40 50 lw mf P(e) 0 2 4 6 8 lw mf C 0.00 0.05 0.10 0.15 0.20 lw mf N (a) (b) Content in % Co nc en tr at io n i n c m ol kg − 1 Co nc en tr at io n i n c m ol kg − 1
Figure 4. Distribution of chemical compounds in the B horizon in lichen woodland and moss forest plots (lw and mf, respec-tively). (a) Concentrations of exchangeable base cations and ex-tractable P, (b) organic C and N. Boxplots represent the distribu-tion around the median values. “(e)” indicates exchangeable or ex-tractable elements. Asterisks indicate a significant difference using mixed models (see Materials and methods), with∗pvalue < 0.05,
∗∗
pvalue < 0.01 and∗∗∗pvalue < 0.001.
0 5 10 15 20 25 lw mf Alpyro** 0 10 20 30 lw mf Aloxa*** 0 10 20 lw mf Aldit** −5 0 5 10 15 20 lw mf AlSRO*** 5 10 15 lw mf Fepyro 4 8 12 16 lw mf Feoxa* 5 10 15 20 lw mf Fedit* 0 3 6 9 lw mf FeSRO** Co nc en tr at io n i n g kg − 1 Co nc en tr at io n i n g kg − 1
Figure 5. Distribution of Fe and Al species concentrations in the B horizon of lw and mf plots. Boxplots represent the distri-bution around the median values. “Pyro”, “oxa” and “dit” sub-scripts mention the type of extractions used for isolating Fe and Al species (respectively pyrophosphate, oxalate and dithionite– citrate). “SRO” stand for short-range order species (AlSRO=Aloxa
-Alpyro, FeSRO=Feoxa-Fepyro). Asterisks indicate a significant
dif-ference using mixed models (see Materials and methods), with∗p value < 0.05,∗∗pvalue < 0.01 and∗∗∗pvalue < 0.001.
than the B horizon in all reactive Fe and Al species, which is consistent with the findings that, in podzolic soils, metal-lic elements are more concentrated in the upper centimetres of the B horizon (Lundström et al., 2000). Because no dif-ferences in Al and Fe species concentrations were found in the C horizon as opposed to our observations in the B hori-zon, our result suggest that the B horizon’s chemical struc-ture and metal oxides composition may have been influenced by different pedogenetic development under mf and lw cover rather than by the mineralogical origin of their parent mate-rials. In particular, the absence of any noticeable difference in the iron crystallinity index of B horizon between all stud-ied sites indicated that they had identical ages (Table S2). Structural and composition variations are thus derived from other drivers than soil origin and instead depend on factors influencing horizon formation processes.
Our results diverge from the observations made by Ugolini et al. (1981), who found no morphological variations nor geochemical differences in the soil profiles of lichen tundra and spruce forest in a boreal zone of Alaska. In particular, they found no difference in reactive Fe species concentra-tions (Fepyro, Fedit)between the two ecosystems. They con-cluded that time and climate were stronger drivers of soil for-mation in their study area than the vegetation type. We sug-gest that because of the proximity of our study sites and the patchy plot distribution within sites, climate could be consid-ered homogeneous in the present study. Our results are rather in line with those of Li and Richter (2012), who showed that land-use changes between old hardwood forests, culti-vated agricultural fields and old-field pine forests can induce transformation and redistribution of soil iron oxides over rel-atively short timeframes (Feoxa, Fedit). They inferred that some differences could be due to the different erosion lev-els and biological activities impacting soil iron oxides and organometallic compound transformation (Li and Richter, 2012).
3.4 Phosphorus distribution
We observed low concentrations of extractable phosphorous in the B horizon, in contrast to the FH and C horizons (Figs. 3 and 4, Table S1). These results could be explained by P sorption properties of FeSRO and AlSROspecies. As a mat-ter of fact, in the B horizon, most P is bound within Fe–P and Al–P complexes (Grand and Lavkulich, 2015; Li and Richter, 2012). Grand and Lavkulich (2015) showed that P sorption to short-range order Al and Fe mineral phases de-creased the availability of labile P. In the C horizon, in ad-dition to its enrichment in organic C, the smaller amounts of Fe and Al oxides may be the reason why more labile P is available (Table S1). Reactive Fe and Al species are known to play an important geochemical role in acidic forest soils due to their sorption properties that influence carbon and nutrients bioavailability through coupling reactions, which makes them good predictors of nutrient availability (Grand
0 1 2 3 lw mf Ca(e)*** 0.0 2.5 5.0 7.5 lw mf Mg(e) 0 1 2 3 4 5 lw mf Fe(e) 0 2 4 6 8 lw mf Base saturation* 0 5 10 lw mf Alpyro 0 5 10 15 20 25 lw mf Aloxa*** 0 5 10 15 20 lw mf Aldit* 0 20 40 lw mf AlSRO*** 0 20 40 60 lw mf Fepyro 2 4 6 8 lw mf Feoxa 3 6 9 lw mf Fedit*** 0 2 4 6 lw mf FeSRO** Horizon B:C ratio Horizon B:C ratio Horizon B:C ratio
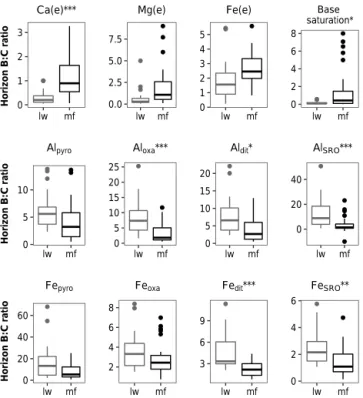
Figure 6. Comparison of horizons B : C ratios in lw and mf plots. Ratios were calculated by dividing for each soil type concentra-tion measured in the B horizon by that measured in the C hori-zon. “(e)” indicates exchangeable or extractable elements. “Pyro”, “oxa” and “dit” subscripts mention the type of extractions used for isolating Fe and Al species (respectively pyrophosphate, ox-alate and dithionite–citrate). “SRO” stand for short-range order species (AlSRO=Aloxa-Alpyro, FeSRO=Feoxa-Fepyro). Asterisks
indicate statistical significance using mixed models (see Materials and methods), with∗pvalue < 0.05,∗∗pvalue < 0.01 and∗∗∗p value < 0.001.
and Lavkulich, 2015; Li and Richter, 2012). Here, P sorp-tion to short-range order Al and Fe mineral phases in the B horizon may reduce nutrient availability for plants, resulting in limited P supply. P limitation is commonly observed in acidic soils of boreal forests (Giesler et al., 2002).
3.5 Relations between B and C horizons
Soil properties were analysed by considering the local vari-ability of the parent material and, therefore, by studying the ratio of B to C horizons for various properties. We found that B : C ratios were different between mf and lw soils for many chemical properties (e.g. Ca, Aloxa, Aldit, AlSRO, Fedit, FeSRO; cf. Fig. 6), which suggests that dissimilar biogeo-chemical processes and vertical transfers occur locally in the soil of the two vegetation types. These differences in B : C ratios between mf and lw soils also confirm that C horizon composition is unlikely to drive most of the variation ob-served between lw and mf B horizons and that it is the in-fluence of vegetation that impacts most of the soil biogeo-chemistry. Furthermore, the low concentration of chemical
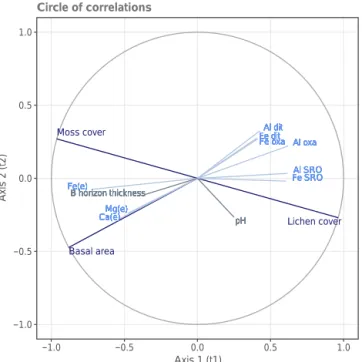
Table 3. Intragroup community indexes of soil physico-geochemical variables relative to orthogonal canonical components of vegetation variables. Values with the highest scores are indicated in bold. t1 t2 t3 Aloxa 0.38 0.43 0.73 Feoxa 0.17 0.24 0.35 Fedit 0.16 0.24 0.41 Aldit 0.18 0.29 0.70 FeSRO 0.37 0.37 0.71 AlSRO 0.38 0.38 0.56 Ca 0.28 0.35 0.46 Mg 0.23 0.28 0.97 Fe 0.51 0.52 0.28 B horizon thickness 0.13 0.14 0.22 pH 0.06 0.13 0.35
elements in the C horizon compared with B and FH hori-zons also invalidates the hypothesis of a deeper mineralogi-cal influence explaining the main differences in geochemimineralogi-cal composition between lw and mf plots. Finally, variations in soil conditions such as temperature, pH and soil hydrology could play a role in differentiating horizon composition. The thickness of the organic layer and its higher water retention capacity in mf forests could greatly affect soil processes, and this is also reflected in the thickness of the B horizon. 3.6 Covariance between vegetation and soil
geochemical variables
Results of the multivariate PLS canonical analysis conducted using the five most significant compounds (according to Figs. 4 and 5, Table 2) support the hypothesis of a different biological influence of vegetation on soil chemical composi-tion and structure that discriminates between the two forest types.
Indeed, our results revealed that the five soil geochemi-cal variables with the greatest intragroup community indexes were Aloxa, FeSRO, AlSRO, Ca and Fe (Fig. 7, Tables 3 and 4), meaning that they were highly linked to variables in the veg-etation set. Vegveg-etation variables, on the other hand, all had an important weight in explaining the variability of soil physico-geochemical variables (Table 4). This result was consistent with stand basal area (representative of forest production) and cover type vegetation being tightly correlated (Fig. 7). Fe and Al complex species were positively correlated with each other, positively correlated with lichen cover, and negatively correlated with moss cover and basal area (Fig. 7). This result was consistent with our aforementioned quantitative obser-vations at the plot scale. Exchangeable Fe, Ca and Mg were positively correlated with each other as well as with the veg-etation characteristics of dense moss-covered stands (Fig. 7). Exchangeable Fe, Ca and Mg behaviours were very much alike, displaying negative correlations with Fe and Al oxides
Basal area Moss cover Lichen cover Al oxa Al oxa Al oxa Al oxa Al oxa Al oxa Al oxa Al oxa Al oxa Al oxa Al oxa Al oxa Al oxa Al oxa Fe dit Fe dit Fe dit Fe dit Fe dit Fe dit Fe dit Fe dit Fe dit Fe dit Fe dit Fe dit Fe dit Fe ditAl ditAl ditAl ditAl ditAl ditAl ditAl ditAl ditAl ditAl ditAl ditAl ditAl ditAl dit
Fe SRO Fe SRO Fe SRO Fe SRO Fe SRO Fe SRO Fe SRO Fe SRO Fe SRO Fe SRO Fe SRO Fe SRO Fe SRO Fe SROAl SROAl SROAl SROAl SROAl SROAl SROAl SROAl SROAl SROAl SROAl SROAl SROAl SROAl SRO
Ca(e) Ca(e) Ca(e) Ca(e) Ca(e) Ca(e) Ca(e) Ca(e) Ca(e) Ca(e) Ca(e) Ca(e) Ca(e) Ca(e)Mg(e)Mg(e)Mg(e)Mg(e)Mg(e)Mg(e)Mg(e)Mg(e)Mg(e)Mg(e)Mg(e)Mg(e)Mg(e)Mg(e) Fe(e) Fe(e) Fe(e) Fe(e) Fe(e) Fe(e) Fe(e) Fe(e) Fe(e) Fe(e) Fe(e) Fe(e) Fe(e) Fe(e) B horizon thickness B horizon thickness B horizon thickness B horizon thickness B horizon thickness B horizon thickness B horizon thickness B horizon thickness B horizon thickness B horizon thickness B horizon thickness B horizon thickness B horizon thickness B horizon thickness pH pH pH pH pH pH pH pH pH pH pH pH pH pH Fe oxa Fe oxa Fe oxa Fe oxa Fe oxa Fe oxa Fe oxa Fe oxa Fe oxa Fe oxa Fe oxa Fe oxa Fe oxa Fe oxa −1.0 −0.5 0.0 0.5 1.0 −1.0 −0.5 0.0 0.5 1.0 Axis 1 (t1) Axis 2 (t2) Circle of correlations
Figure 7. Graphical projection of partial least squares canonical analysis (PLSCA) results in the B horizon at the plot scale. Vari-ables for stand tree cover characteristics are drawn in dark blue, chemical compounds in light blue and soil characteristics in grey. Axes correspond to principal orthogonal canonical components. Positive, null or negative correlations between variables are indi-cated by acute, right or obtuse angles, respectively, between the cor-responding vectors. “(e)” indicates exchangeable or extractable ele-ments. Regarding the chemical elements, only variables that showed the greatest differences in mean values between lw and mf plots in the B horizon were included in the PLSCA.
(Figs. 5, S2 and S3). The different behaviours of exchange-able Fe and bound Fe could be explained by their different mobility properties and abilities, in particular since fluxes could vary under different soil environmental conditions and soil thicknesses between lw and mf plots. The conversion re-actions of iron oxides depend to a large extent on pedoen-vironmental factors (pH, water activity, temperature, etc.; Schwtermann, 1988). These factors vary with depth and de-pend on the groundcover. Furthermore, organic matter seems to have an influence on iron oxides by inhibiting their crys-tallinity (Borggaard et al., 1990): in mf plots, the thicker and denser organic matter layer could explain the lower concen-trations of Fe and Al oxides in B horizons. Fe and Al oxides species could also differ between mf and lw plots because soil temperature and moisture are also responsible for differ-ent goethite : hematite ratios (Schwtermann, 1988). Hematic soils develop in warmer conditions and are characterised by reddish brown colours, while goethitic soils develop under colder environment and turn yellowish-brown. This is con-sistent with our observations of clearer red to yellow soils under lw cover where little organic matter accumulates as
Table 4. Intragroup community indexes of vegetation variables relative to orthogonal canonical components of soil physico-geochemical variables. u1 u2 u3 Basal area 0.55 0.55 0.59 Moss cover 0.43 0.49 0.53 Lichen cover 0.43 0.49 0.53 LW LW LW LW LW LW LW LW LW LW LW LW LW LW LW LW LW LW LW LW LW LW LW LW LW LW LW LW LW LW LW LW LW LW LW LW LW LW LW LW LW LW LW LW LW LW LW LW LW LW LW LW LW LW MF MF MF MF MF MF MF MF MF MF MF MF MF MF MF MF MF MF MF MF MF MF MF MF MF MF MF MF MF MF MF MF MF MF MF MF MF MF MF MF MF MF MF MF MF MF MF MF MF MF MF MF MF MF −5 0 5 10 −20 −10 0 10 20 PCoA 1 (90.0 %) PCoA 2 (7.9 %)
Figure 8. Graphical projection of homogeneity of multivariate dis-persions of data around ecosystem-type centroids (principal coordi-nates analysis). Average distance to centroids was 6.084 and 5.912 for LW and MF, respectively. Small open circles represent plots cated in LW sites; small black filled circles correspond to plots lo-cated in MF sites. The two big circles represent the group centroids for each forest type (LW vs. MF).
opposed to mf soils overlaid by a thick dark brown organic layer which could lead to warmer temperatures.
We also found positive correlations between C and N con-centrations, moss coverage, and Mg and Ca concentrations in the FH organic horizon (Fig. S3). The higher base cation bioavailability in mf plots could be explained by greater in-puts of organic matter to the soil surface and by a higher coniferous basal area cover. Decomposing organic matter and litter are known to be important sources of base cation supply such as Ca and Mg (Finzi et al., 1998; Grand and Lavkulich, 2015).
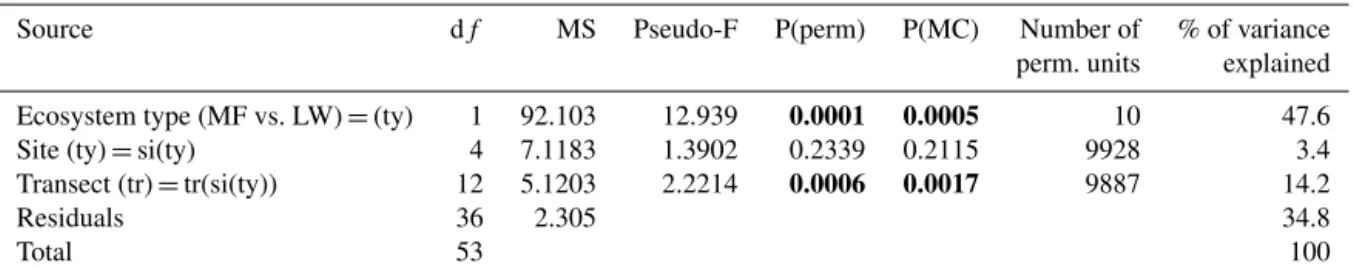
3.7 Differences in soil geochemistry at the site scale We scaled up the effect of ground cover type (lw vs. mf) on Aloxa, FeSRO, AlSRO, Ca and Fe at the site scale (lake water-shed scale) to test explicitly whether the same chemical ele-ments differed between ecosystem type (LW vs. MF) using PERMANOVA. Our results showed significant differences between MF and LW ecosystem types (P(MC) = 0.0005, pseudo-F = 12.939). The type of ecosystem alone explained 47.6 % of the total variance in the studied set of geochem-ical variables (Table 5). In addition, our test of multivariate
dispersion revealed that the level of heterogeneity regarding Aloxa, FeSRO, AlSRO, Ca and Fe did not differ between MF and LW (p value = 0.895, F = 0.0203, Table S3), which re-inforces the conclusion that the difference observed between MF and LW originates from differences in mean values of Aloxa, FeSRO, AlSRO, Ca and Fe rather than differences in variance (Fig. 8). This finally highlights interactions between ecosystem structure and geochemical composition of the soil at the site scale.
3.8 Total element stocks in the soil
Because LW and MF displayed variations in soil composition and thickness, we hypothesised that they should hold differ-ent total amounts of chemical species. Total net stocks of C and N were scaled up from the plot to the site scale (layer thickness × organic matter concentration) in FH and B hori-zons (top 15 cm). On average, the FH horizon in MF held 3.5 times higher amounts of C and 4 times more N than that in LW (Table 6). Similarly, in the B horizon, both C and N stocks were 2 times higher in MF than in LW. These results suggest that, in addition to C sequestration in a greater aerial biomass, closed moss forests also hold more C in their soil. However, regarding Fe and Al species, total net stocks were higher in LW than in MF, despite their thinner B horizons (Table S4).
3.9 Biological influence
Overall, because we did not find any difference in the geo-chemistry and texture of the C horizon between ecosystem types and because our sites developed from surficial de-posits (undifferentiated till, dead-ice moraine) of similar ori-gin (glacial), our results, which are in line with those of other studies, suggest a biological influence of vegetation on soil profile development and soil chemistry (Finzi et al., 1998; Haughian and Burton, 2015; Wood et al., 1984). Haughian and Burton (2015) showed that more variability in soil com-position could be explained by vegetation functional groups (e.g. mosses vs. lichens) than by abiotic characteristics (soil texture, topography). They found that variations in nutrient availability were the result of differences in vegetation types (lichens, feather mosses and vascular plants) rather than the opposite (i.e. nutrient availability as a cause of vegetation patterns). In their study of podzol biogeochemical vertical stratification in hardwood forests of New Hampshire, Wood et al. (1984) concluded that the B horizon is subject to strong geochemical control that is under biological influence rather than of mineralogical origin. Finzi et al. (1998) observed different distributions of Ca, Mg, Fe and Al exchangeable cations in 0–7.5 cm mineral soils under various tree species. They found an association between tree species and soil-specific chemical properties at the tree scale and suggested that vegetation influenced soil acidity and cation cycling in the forests studied (Finzi et al., 1998). Here, we suggest
Fire frequency LW MF Fewer seed regeneration Maintenance of dense forests Impoverished environment
Open forests Closed forests
Radiation rate Throughfall rate
Impacts on soil microclimatic conditions
Humus humidity Length of snow covering period OM accumulation
Fe and Al oxides C and N content Exchangeable Fe, Ca , Mg Impacts on soil geochemistry
+
Figure 9. Schematic illustration of feedback processes between stand biomass (basal area and/or density) and soil biogeochemistry as a consequence of climatic conditions based on the present study interpretations.
that the differences we observed in soil geochemical struc-ture and composition between MF and LW had a biological origin that resulted in repercussions of the local vegetation on soil environmental conditions, which in turn influenced soil biogeochemical processes. We suggest the following po-tential causes for the difference observed in soil between LW and MF ecosystems: (i) the abundance of tree cover could influence soil formation through its direct consequence of canopy openness on soil micro-environmental conditions and drainage; (ii) snowfall rate and snowmelt duration in turn may influence reductive conditions and cause differen-tial dissolution of iron oxides that accumulate in the B hori-zon (Giesler et al., 2002); (iii) thickness of organic soil lay-ers could create differential insulating properties (Lawrence and Slater, 2007); (iv) because water flow also affects the distribution of chemical elements such as labile P, Fe and Al (Giesler et al., 2002), differences in drainage conditions, slope, moisture and hydrochemical processes under moss and lichen covers (Brown et al., 2010; Haughian and Burton, 2015; Price et al., 1997) could also explain the observed vari-ations in lw and mf soil chemical properties; and, finally, v) lichen surface weathering capacity (Chen et al., 2000; Porada et al., 2014) may be responsible for the higher concentrations of Fe and Al species in LW upper mineral horizons, while a dense moss cover may be less aggressive in mineral weather-ing; however, because this environment is more productive, it could generate more organic acid and favour a deeper profile development.
Table 5. Results of PERMANOVA on the ecosystem types and geochemical variables (MF vs. LW). Significant effects are indicated in bold. P(MC): p values obtained through Monte Carlo methods.
Source df MS Pseudo-F P(perm) P(MC) Number of % of variance
perm. units explained
Ecosystem type (MF vs. LW) = (ty) 1 92.103 12.939 0.0001 0.0005 10 47.6
Site (ty) = si(ty) 4 7.1183 1.3902 0.2339 0.2115 9928 3.4
Transect (tr) = tr(si(ty)) 12 5.1203 2.2214 0.0006 0.0017 9887 14.2
Residuals 36 2.305 34.8
Total 53 100
Table 6. Carbon and nitrogen stocks contained in FH and B hori-zons. Values are given as means ± standard deviations.
Total stock at the site scale (t ha−1)
LW sites MF sites FH horizon C 36.68 ± 4.29 126.44 ± 67.86 N 0.53 ± 0.05 2.06 ± 1.00 B horizon C 22.23 ± 8.55 44.68 ± 6.61 N 0.67 ± 0.31 1.39 ± 0.32
3.10 Soil, climate and vegetation dynamics
It has previously been suggested that the two vegetation types considered could be two ecological states and that LW could be an alternative stable state resulting from regional dis-turbance history (Jasinski and Payette, 2005). We propose here a diagram (Fig. 9) that synthesises our interpretations of the possible feedback processes between climate, vegeta-tion and soil biogeochemistry that can be considered to re-sult from successive fires. Indeed, the progression of open-canopy forests could be due to a greater fire frequency re-sulting from the changing climate (Rapanoela et al., 2016). Differences in fire events may lead to direct and indirect consequences at the soil level arising from fire impacts on vegetation structure and soil properties (Certini, 2005). Fire effects on soil properties have been shown to range from negative short-term effects (removal of organic matter, ero-sion, loss of nutrients through volatilisation, alteration of mi-crobial communities, etc.) to long-term consequences (en-hanced productivity, impact on forest successions, etc.; Cer-tini, 2005). While negative effects on soil properties seem to be short lived (detectable some years post-fire, at most a decade) and restricted to a few top centimetres of super-ficial layers (Certini, 2005), we suggest that indirect effects may be wider and could have longer-term consequences. Fre-quent fires may hinder the accumulation of a thick top layer of organic matter, thus leading to direct aftereffects on soil
physical and microclimatic conditions. The low stem basal area (likely associated with lower tree density) inherited from frequent fires results in both higher radiative insolation and precipitation reaching the soil surface, thus setting an envi-ronment more suitable to the establishment of light-tolerant lichen rather than colonisation by moss species. Repeated fires may spearhead lichen dominance in LW by maintain-ing preferential environmental conditions for its colonisation and establishment (Girard et al., 2009). In return, lichen es-tablishment could also maintain a specific soil composition that is low in nutrients because of its low primary produc-tivity (Moore, 1980). Altogether, the disturbance regime in boreal forests could determine the ground cover vegetation type and impact soil development through both direct and in-direct effects, by generating poorer soils and sustaining the establishment of less productive forests.
4 Conclusions
We identified clear relationships between soil and vegeta-tion structures that are reflective of a whole integrative sys-tem relying on feedback interactions. Although the correla-tion patterns between the ecosystem’s biological components and the soil variables seem complex, our results suggest that in comparison to closed-canopy forests, open forests with a lichen ground cover are associated with a soil impoverished in C and available nutrients that develops a thinner B horizon characterised by high concentrations in amorphous species of Fe and Al. Ecosystem productivity and carbon sequestra-tion are affected twice in LW compared with MF: through a lower density of trees (lower basal area and fewer stems) and through nutrient- and organically limited soils. This em-phasises the current economic and climatic stakes that forest opening represents in so far as it could have important conse-quences in terms of carbon sequestration capacity. Our study of soil compartments confirms that the current opening of black spruce forests is an ecological, economic and climatic stake with underlying long-term consequences, notably in the terrestrial carbon budget.
A good understanding of the processes governing soil bio-geochemistry and feedback interactions between soil and vegetation remains fundamental for forest management,
es-pecially in areas of ecological transitions representing ma-jor challenges, such as the northern boundary between pro-ductive boreal forests and open lichen woodlands. Our study highlights that natural disturbances may influence landscape remodelling and ecosystem heterogeneity in much more ways than through their direct impacts on seedling regen-eration and soil nutrient short-term depletion. Repeated dis-turbance events could have long-term consequences on soil formation and development. Disturbance history and inher-itance could promote the establishment and maintenance of specific vegetation–soil systems (or ecological states). If so, soil science and biogeochemistry could become interesting proxies in disturbance ecology, notably for palaeoecologi-cal investigations aiming to reconstruct changes in vegeta-tion. Further investigations should explore vegetation struc-ture (basal area and tree density) and soil relations in other ecosystems and focus on microclimatic and drainage condi-tions as well as disturbance history as explanatory drivers of variability.
Data availability. The raw data compiled for this study are available at https://www.researchgate.net/publication/317662332_
Soil_data_Biogeochemistry_analysis_-_LWvsMF_-_June2017 –
https://doi.org/10.13140/RG.2.2.12565.52965, Bastianelli et al., 2017
The Supplement related to this article is available online at https://doi.org/10.5194/bg-14-3445-2017-supplement.
Author contributions. AA, CB, DP, YB, PG and CH designed the research. AA, CB, PG and DP collected samples in the field. Ex-perimental analyses were carried out by CB and Serge Rousseau. Results were statistically analysed by CB and JB. CB prepared the manuscript with input from AA, JB, DP, CH and YB.
Competing interests. The authors declare that they have no conflict of interest.
Acknowledgements. This research was funded by the Natural Sci-ences and Engineering Research Council of Canada (NSERC), the European IRSES NEWFOREST project, the Institut de l’Écologie et Environnement of the Centre national de la recherche scientifique (CNRS-InEE), the École Pratique des Hautes Études and the Uni-versity of Montpellier (France) through the International Research Group on Cold Forests (GDRI “Forêts Froides”, France), and the In-stitut Universitaire de France (IUF). The PhD thesis of Carole Bas-tianelli was supported by AgroParisTech.
The authors are grateful to Serge Rousseau for carrying out laboratory experiments; to David Gervais, Benoît Brossier and Samuel Alleaume for their help with field work; and to
Isabelle Lamarre for her help in proofreading this paper. The authors also thank Véronique Poirier from the Forest Research Head department of the Ministère des Forêts, de la Faune et des Parcs du Québec (MFFP) for providing helpful geographical and spatial information as well as Pierre clouâtre (MFFP) and Benoît Gaudreau (MFFP) for the logistical support and their involvement in the field campaign preparation.
Edited by: Roland Bol
Reviewed by: three anonymous referees
References
Ali, A. A., Blarquez, O., Girardin, M. P., Hély, C., Tinquaut, F., Guellab, A. E., Valsecchi, V., Terrier, A., Bremond, L., Gen-ries, A., Gauthier, S., and Bergeron, Y.: Control of the multi-millennial wildfire size in boreal North America by spring cli-matic conditions, P. Natl. Acad. Sci. USA, 109, 20966–20970, https://doi.org/10.1073/pnas.1203467109, 2012.
Anderson, M. J.: A new method for non–parametric multivariate analysis of variance, Austral Ecol., 26, 32–46, 2001.
Arduino, E., Barberis, E., Carraro, F., and Forno, M. G.: Estimating relative ages from iron-oxide/total-iron ratios of soils in the western Po Valley, Italy, Geoderma, 33, 39–52, https://doi.org/10.1016/0016-7061(84)90088-0, 1984.
Asselin, H. and Payette, S.: Late Holocene opening of the for-est tundra landscape in northern Québec, Canada, Global Ecol. Biogeogr., 14, 307–313, https://doi.org/10.1111/j.1466-822X.2005.00157.x, 2005.
Bastianelli, C., Ali, A. A., Béguin, J., Bergeron, Y., Grondin,
P., Hély, C., and Paré, D.: Soil data:
Biogeochem-istry analysis – LWvsMF – June 2017, ResearchGate, https://doi.org/10.13140/RG.2.2.12565.52965, 2017.
Bernier, P. Y., Desjardins, R. L., Karimi-Zindashty, Y., Worth, D., Beaudoin, A., Luo, Y., and Wang, S.: Boreal lichen wood-lands: A possible negative feedback to climate change in eastern North America, Agr. Forest Meteorol., 151, 521–528, https://doi.org/10.1016/j.agrformet.2010.12.013, 2011.
Blume, H. P. and Schwertmann, U.: Genetic evaluation
of profile distribution of aluminum, iron, and
man-ganese oxides, Soil Sci. Soc. Am. J., 33, 438–444,
https://doi.org/10.2136/sssaj1969.03615995003300030030x, 1969.
Bonan, G. B.: Carbon and nitrogen cycling in North American bo-real forests. II. Biogeographic patterns, Can. J. Forest Res., 20, 1077–1088, https://doi.org/10.1139/x90-143, 1990.
Bonan, G. B. and Shugart, H. H.: Environmental factors and eco-logical processes in boreal forests, Annu. Rev. Ecol. Syst., 1–28, 1989.
Borggaard, O. K., Jdrgensen, S. S., Moberg, J. P., and Raben-Lange, B.: Influence of organic matter on phosphate adsorption by alu-minium and iron oxides in sandy soils, J. Soil Sci., 41, 443–449, https://doi.org/10.1111/j.1365-2389.1990.tb00078.x, 1990. Brimhall, G. H. and Dietrich, W. E.: Constitutive mass balance
re-lations between chemical composition, volume, density, poros-ity, and strain in metasomatic hydrochemical systems: Results on weathering and pedogenesis, Geochim. Cosmochim. Ac., 51, 567–587, https://doi.org/10.1016/0016-7037(87)90070-6, 1987.
Brown, S. M., Petrone, R. M., Mendoza, C., and Devito, K. J.: Sur-face vegetation controls on evapotranspiration from a sub-humid Western Boreal Plain wetland, Hydrol. Process., 24, 1072–1085, https://doi.org/10.1002/hyp.7569, 2010.
Buurman, P. and Jongmans, A. G.: Podzolisation and
soil organic matter dynamics, Geoderma, 125, 71–83,
https://doi.org/10.1016/j.geoderma.2004.07.006, 2005.
Canadian Soil Survey Committee: The Canadian System of Soil Classification, Agric. Can. Publ., No. 1646, NRC Research Press, 1978.
Carter, M. R.: Soil Sampling and Methods of Analysis, CRC Press, 1993.
Certini, G.: Effects of fire on properties of forest soils: a review, Oecologia, 143, 1–10, https://doi.org/10.1007/s00442-004-1788-8, 2005.
Chen, J., Blume, H.-P., and Beyer, L.: Weathering of rocks in-duced by lichen colonization – a review, Catena, 39, 121–146, https://doi.org/10.1016/S0341-8162(99)00085-5, 2000. Duchaufour, P.: La formation et l’évolution des complexes
organo-minéraux dans les sols et leur rôle dans la pédogénèse, Sci. Sol, 28, 273–284, 1990.
Environment Canada: Canadian Climate Normals 1981-2010 Sta-tion Data – Climate – Environment Canada, available at: http: //climate.weather.gc.ca/ (last access: 10 August 2016), 2013. Finzi, A. C., Canham, C. D., and Van Breemen, N.: Canopy tree-soil
interactions within temperate forests: species effects on pH and cations, Ecol. Appl., 8, 447–454, https://doi.org/10.1890/1051-0761(1998)008[0447:CTSIWT]2.0.CO;2, 1998.
Giesler, R., Petersson, T., and Högberg, P.: Phosphorus limi-tation in boreal forests: effects of aluminum and iron ac-cumulation in the humus layer, Ecosystems, 5, 300–314, https://doi.org/10.1007/s10021-001-0073-5, 2002.
Girard, F., Payette, S., and Gagnon, R.: Rapid expansion of lichen woodlands within the closed-crown boreal for-est zone over the last 50 years caused by stand dis-turbances in eastern Canada, J. Biogeogr., 35, 529–537, https://doi.org/10.1111/j.1365-2699.2007.01816.x, 2008.
Girard, F., Payette, S., and Gagnon, R.: Origin of the
lichen–spruce woodland in the closed-crown forest zone of eastern Canada, Global Ecol. Biogeogr., 18, 291–303, https://doi.org/10.1111/j.1466-8238.2009.00449.x, 2009. Grand, S. and Lavkulich, L. M.: Short-range order mineral phases
control the distribution of important macronutrients in coarse-textured forest soils of coastal British Columbia, Canada, Plant Soil, 390, 77–93, https://doi.org/10.1007/s11104-014-2372-6, 2015.
Haughian, S. R. and Burton, P. J.: Microhabitat associations of lichens, feathermosses, and vascular plants in a caribou winter range, and their implications for understory develop-ment, Botany, 93, 221–231, https://doi.org/10.1139/cjb-2014-0238, 2015.
Holmgren, G. G. S.: A rapid citrate-dithionite extractable iron pro-cedure, Soil Sci. Soc. Am. J., 31, 210–211, 1967.
Jasinski, J. P. P. and Payette, S.: The creation of alternative sta-ble states in the southern boreal forest, Québec, Canada, Ecol. Monogr., 75, 561–583, https://doi.org/10.1890/04-1621, 2005. Jenny, H.: Factors of Soil Formation: A System of Quantitative
Pedology, Courier Corporation, 1994.
Johnson, D. W. and Todd, D. E.: Relationships among
iron, aluminum, carbon, and sulfate in a variety of
forest soils, Soil Sci. Soc. Am. J., 47, 792–800,
https://doi.org/10.2136/sssaj1983.03615995004700040035x, 1983.
Kardol, P., Bezemer, T. M., and van der Putten, W. H.: Temporal variation in plant-soil feedback controls succes-sion, Ecol. Lett., 9, 1080–1088, https://doi.org/10.1111/j.1461-0248.2006.00953.x, 2006.
Lawrence, D. M. and Slater, A. G.: Incorporating organic soil into a global climate model, Clim. Dynam., 30, 145–160, https://doi.org/10.1007/s00382-007-0278-1, 2007.
Li, J. and Richter, D. D.: Effects of two-century land use changes on soil iron crystallinity and accumulation in South-eastern Piedmont region, USA, Geoderma, 173–174, 184–191, https://doi.org/10.1016/j.geoderma.2011.12.021, 2012.
Lundström, U. S., van Breemen, N., and Bain, D.: The podzolization process, A review, Geoderma, 94, 91–107, https://doi.org/10.1016/S0016-7061(99)00036-1, 2000. McArdle, B. H. and Anderson, M. J.: Fitting multivariate models
to community data: a comment on distance–based redundancy analysis, Ecology, 82, 290–297, 2001.
McBride, M. B.: Adsorption and oxidation of
phe-nolic compounds by iron and manganese
ox-ides, Soil Sci. Soc. Am. J., 51, 1466–1472,
https://doi.org/10.2136/sssaj1987.03615995005100060012x, 1987.
McKeague, J. A.: Manual on Soil Sampling and Methods of Analy-sis, 2nd Edn., Canadian Society of Soil Science, Ottawa, 212 pp., 1987.
McKeague, J. A., Brydon, J. E., and Miles, N. M.:
Differentiation of forms of extractable iron and
alu-minum in soils, Soil Sci. Soc. Am. J., 35, 33–38,
https://doi.org/10.2136/sssaj1971.03615995003500010016x, 1971.
Mehlich, A.: Mehlich 3 soil test extractant: A modification of Mehlich 2 extractant, Commun. Soil Sci. Plant Anal., 15, 1409– 1416, 1984.
Mehra, O. P. and Jackson, M. L.: Iron oxide removal from soils and clays by a dithionite-citrate system buffered with sodium bicar-bonate, Clay. Clay Miner., 7, 317–327, 1960.
Moore, T. R.: The nutrient status of subarctic woodland soils, Arct. Alp. Res., 12, 147–160, https://doi.org/10.2307/1550512, 1980. Mourier, B., Poulenard, J., Carcaillet, C., and Williamson, D.: Soil
evolution and subalpine ecosystem changes in the French Alps inferred from geochemical analysis of lacustrine sediments, J. Paleolimnol., 44, 571–587, https://doi.org/10.1007/s10933-010-9438-0, 2010.
Oksanen, J., Blanchet, G. F., Friendly, M., Kindt, R., Legendre, P., McGlinn, D., Minchin, P. R., O’Hara, R. B., Simpson, G. L., Solymos, P., Stevens, M. H. H., Szoecs, E., and Wagner, E.: vegan: Community Ecology Package, R package version 2.4-1, 2016.
Pagé, F. and Kimpe, C. R. D.: Dissolution des composés fer-rugineux et alumineux des horizons b podzoliques de sols du québec par le dithionite-citrate-bicarbonate, l’oxalate, le py-rophosphate et le tétraborate, Can. J. Soil Sci., 69, 451–459, https://doi.org/10.4141/cjss89-047, 1989.