HAL Id: cea-02339951
https://hal-cea.archives-ouvertes.fr/cea-02339951
Submitted on 17 Feb 2020
HAL is a multi-disciplinary open access
archive for the deposit and dissemination of
sci-entific research documents, whether they are
pub-lished or not. The documents may come from
teaching and research institutions in France or
abroad, or from public or private research centers.
L’archive ouverte pluridisciplinaire HAL, est
destinée au dépôt et à la diffusion de documents
scientifiques de niveau recherche, publiés ou non,
émanant des établissements d’enseignement et de
recherche français ou étrangers, des laboratoires
publics ou privés.
A new equation of state for helium nanobubbles
embedded in UO_2 matrix calculated via molecular
dynamics simulations
Laurent van Brutzel, Alain Chartier
To cite this version:
Laurent van Brutzel, Alain Chartier. A new equation of state for helium nanobubbles embedded in
UO_2 matrix calculated via molecular dynamics simulations. Journal of Nuclear Materials, Elsevier,
2019, 518, pp.431-439. �10.1016/j.jnucmat.2019.02.015�. �cea-02339951�
A new equation of state for helium nanobubbles embedded in UO
2matrix calculated via
molecular dynamics simulations
Laurent Van Brutzela,∗, Alain Chartiera
aDen-Service de la Corrosion et du Comportement des Mat´eriaux dans leur Environnement (SCCME), CEA, Universit´e Paris-Saclay, F-91191, Gif-sur-Yvette,
France
Abstract
Molecular dynamics simulations have been carried out to determine the equation of state of helium inside nanobubbles embedded into a UO2matrix. The parameters of the equation of state are fitted with the Brearley and MacInnes hard-sphere model based on the formalism of Carnahan-Starling used in fuel performance codes. This new equation of state takes into account the interactions between the surrounding UO2 matrix and the helium atoms. Four nanobubble sizes (diameters: 1, 2, 5, and 10 nm) have been investigated over four temperatures (300, 500, 700, and 900 K) and for initial helium concentration inside the bubble ranging from 0.33 × 10⁵to 3.9 × 10⁵mol.m−3(corresponding to helium-to-vacancy ratio of 0.3 to 3.3, respectively). We find that helium atoms are inhomogeneously distributed inside the bubble. A boundary layer of 1 nm thickness appears at the bubble surface in which helium atoms are more concentrated and diffuse into the UO2matrix. We also find a saturation concentration of the helium atoms that can be incorporated into the bubble. This concentration limit is equal to 1.6 helium atom per vacancy in UO2. It corresponds to an atomic volume of 7.8 × 10⁻³⁰m3, which is almost half of the value proposed with the original Brearley and MacInnes model (13× 10−30m3). For this threshold concentration and for bubble of diameter higher than 5 nm, nano-cracks and dislocations appear at the bubble surface. However, experimental observation is needed to confirm this finding. We calculated the critical pressures inside the bubble which yields to this onset of crack in UO2. These critical pressures are in good agreement with those calculated with the Griffith criterion for brittle fracture.
Keywords: Molecular dynamics, helium bubble, equation of state, mechanical properties
1. Introduction
The knowledge of the spent nuclear fuel (SNF) microstruc-tural evolution and its thermo-mechanical properties is a crucial issue. SNF undergoes damage arising mainly from α-decay of minor actinides produced by uranium fission. These sel-irradiation events create structural damage and produces a large quantity of helium (He) atoms, which accumulate and are esti-mated to reach concentration up to 0.25 at.% after 10 000 years [1].
Experimental transmission electron microscopy studies show that these He atoms cluster, in the first stage, into nanobub-bles of about 2 nm diameter [2, 3]. These nanobubnanobub-bles can be over-pressurized and hence apply mechanical stresses inside the SNF. At a larger length scale, some experimental observations show that He accumulation at the grain boundaries results in grain decohesion [4]. However, the exact role of the nanobub-bles in this phenomena is still under debate. Physical integrity of He bubbles under self-irradiation is also an important ques-tion for fission gas release models [5] through re-soluques-tion rate coefficients [6]. To answer these questions one of the key ingre-dients is to describe accurately the He equation of state (EOS) reproducing the pressure-volume relationship.
∗Corresponding author. Tel.:+33-169087915; Fax: +33-169089221 Email address: laurent.vanbrutzel@cea.fr (Laurent Van Brutzel)
A plethora of He EOS of varying complexity exists either for solid, liquid or gas phase. A nice review can be found in refer-ence [7]. For nanobubbles, where internal pressure is in the GPa range, modified hard-sphere models are commonly used [8]. In UO2 the EOS of Brearley-MacInnes [9] is typically employed in SNF model [1, 10]. However, this EOS is fitted on pure He properties. For nanometer size bubbles, interactions between the He atoms and the surrounding matrix can alter the He prop-erties inside the bubble including the pressure [11]. Therefore, EOS should include this effect.
Development of atomic scale simulations, such as molecu-lar dynamics (MD) allows to calculate this effect. Several MD studies of over-pressurized He bubble in iron [12–14] or tita-nium and copper [15] have already been carried out with suc-cess to provide the He EOS in these metals. To the best of our knowledge, no equivalent simulations have been yet car-ried out for UO2. Nonetheless, MD studies of He solubility [16] and bubble nucleation [17] show that in this ceramic ma-terial the He behavior is significantly different than in metals. In both studies, the authors observe an upper He concentration inside the bubble beyond which He atoms diffuse into the sur-rounding matrix creating a diffuse interface at the edge of the over-pressurized bubbles.
The aim of the present paper is to calculate via MD simu-lations using empirical potentials the EOS for He embedded into UO2matrix. Several nanobubble sizes are investigated (0.5
to 10 nm of diameter) with initial He concentration inside the bubble ranging from 0.33 to 3.9×10⁵mol.m3and calculated for temperatures ranging between 300 to 900 K. For each case, be-side calculating the internal bubble pressure, we analyze the nanobubble morphology and the damage occurring in the sur-rounding UO2matrix.
This paper is organized as follows. First, we describe in sec-tion 2 the empirical potentials and the methodology used. Then, in section 3 the EOS of pure He are calculated and discussed. Subsequently, in section 4 the morphology and structure of He nanobubbles are presented followed by the EOS of He embed-ded into UO2 matrix. Finally, in section 4.3 the impact of the nanobubbles on the mechanical properties of UO2will be dis-cussed.
2. Computational method
2.1. Interatomic potential
Several interatomic potentials exist in literature to describe He in gas, liquid, or solid state over a wide range of temperature and pressure. Mainly, we can summarize the plethora of func-tions in three family of interatomic potentials: Lennard-Jones, Buckingham, and Tang-Toennies [18]. The analytical form of these pair potentials as a function of the distance, ri j, between
atoms i and j are: Lennard-Jones VHe−He(ri j)= 4ϵ ( σ ri j )12 − ( σ ri j )6 (1) Buckingham VHe−He(ri j)= A exp ( −ri j ρ ) − C r6i j (2) Tang-Toennies VHe−He(ri j)= A exp ( −ri j ρ ) − f6 ( ri j ρ ) C r6 i j − f8 ( ri j ρ ) D r8 i j − f10 ( ri j ρ ) E r10 i j (3) where f2n ( ri j ρ ) = 1 − exp ( −ri j ρ )∑2n k=0 ( ri j ρ )k 1 k! (4)
The parameters of each potential have been fitted to repro-duce the available experimental data or ab initio calculations. Table 1 reports the most recent values of the parameters for each potential functions.
Table 1: Parameters for the He-He interaction.
A (eV) ρ (Å) C (eV.Å6) D (eV.Å8) E (eV.Å10)
Buckingham [16] 169 0.257 0.58
Tang-Tonnies [18] 1141.43 0.21 0.8724 2.361 8.6028 ϵ (eV) σ (Å)
Lennard-Jones [19] 8.7863×10⁻⁴ 2.28
We have assessed these interatomic potentials over He con-centrations ranging from 1.1 × 10⁴ to 2× 10⁵ mol.m−3 corre-sponding to atomic volumes (i.e., volume occupied by one He atom, Vat) ranging from 8.33 × 10⁻³⁰to 1.5 × 10⁻²⁸m3
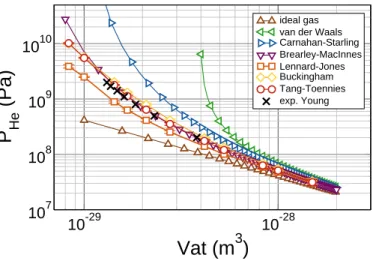
respec-tively. The temperature ranges from 300 to 1500 K. All the MD simulation have been performed using the LAMMPS code [23] Fig. 1 displays the EOS (pressure PHeas a function of Vat)
for pure He obtained by MD simulations. These results are compared to those calculated with the ideal gas law, the van der Walls law [24], the Carnahan-Starling model [25], and the Brearley-MacInnes model [9]. They are also compared with experimental data compiled by Young et al.[26].
10-29 10-28
Vat (m
3)
107 108 109 1010P
He(Pa)
ideal gas van der Waals Carnahan-Starling Brearley-MacInnes Lennard-Jones Buckingham Tang-Toennies exp. YoungFigure 1: Comparison of equation of states for pure Helium gas calculated by MD simulations with three interatomic potentials (Lennard-Jones, Bucking-ham, and Tang-Toennies). These results are compared with the equation of states calculated with the ideal gas, the van der Waals, the Carnahan-Starling, the Brearley-MacInnes laws, and experimental data [26].
Tang-Toennies potential fits the best the EOS of Brearley-MacInnes and the experimental data for Vat higher than
10−29m3. For this reason the Tang-Toennies potential has been chosen for the rest of the study. However, it is worth noticing that difference appears with the EOS of Brearley-MacInnes for the smallest value of Vat, namely for the highest He
concentra-tions, which are the concentrations of interest.
The goal of our study is to calculate the EOS of He in bub-bles embedded in the UO2fuel matrix. For large bubble sizes, the number of He atoms at the bubble surface and then in in-teraction with the UO2 matrix is considerably lower than the number of He atoms in the middle of the bubble, which are only in interaction with other He atoms. Hence, the approximation considering for EOS the pure He EOS seems reasonable. How-ever, for bubbles of few nanometers, interactions between UO2 matrix and gas atoms can play an important role and modify the EOS.
For the UO2interactions, the Morelon potential [20] has been selected because it was used successfully to study the energy formation of xenon nanobubble [21, 22] and has been optimized for the study of point defects. It is composed of a Coulomb-Buckingham (see equation 2) for the interaction between ura-nium and oxygen atoms. The interaction between two oxygen 2
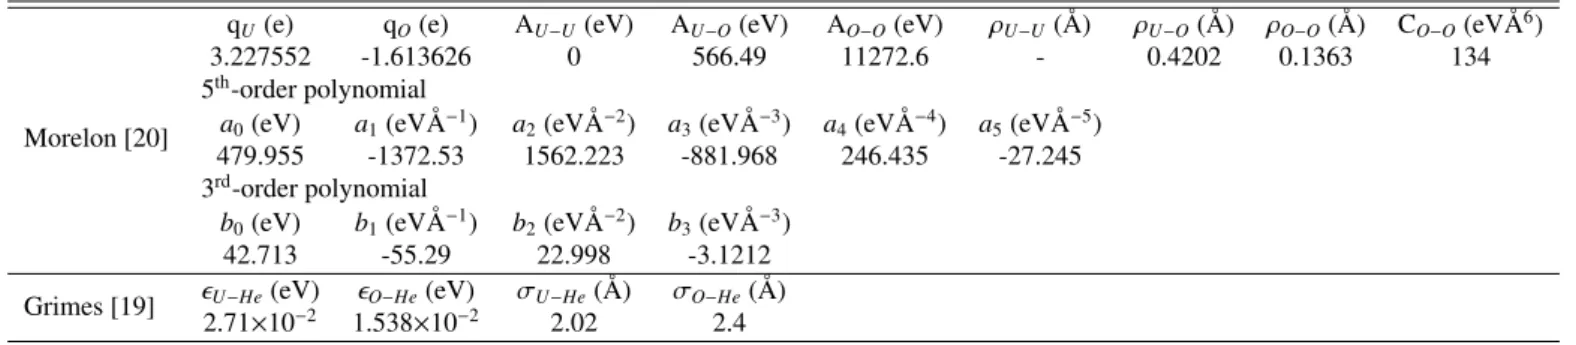
Table 2: Parameters for the UO2and UO2-He interactions.
Morelon [20]
qU(e) qO(e) AU−U(eV) AU−O(eV) AO−O(eV) ρU−U(Å) ρU−O(Å) ρO−O(Å) CO−O(eVÅ6)
3.227552 -1.613626 0 566.49 11272.6 - 0.4202 0.1363 134 5th-order polynomial
a0(eV) a1(eVÅ−1) a2(eVÅ−2) a3(eVÅ−3) a4(eVÅ−4) a5(eVÅ−5)
479.955 -1372.53 1562.223 -881.968 246.435 -27.245 3rd-order polynomial
b0(eV) b1(eVÅ−1) b2(eVÅ−2) b3(eVÅ−3)
42.713 -55.29 22.998 -3.1212 Grimes [19] ϵU−He(eV) ϵO−He(eV) σU−He(Å) σO−He(Å)
2.71×10⁻² 1.538×10⁻² 2.02 2.4
atoms is unconventional and is defined by intervals as follows:
VOO(r)= qO· qO 4πϵ0r + AOO exp ( − r ρOO ) , 0< r 6 1.2 Å 5th-order polynomial, 1.2 Å < r 6 2.1 Å 3rd-order polynomial, 2.1 Å < r 6 2.6 Å −COO r6 , 2.6 Å < r (5) For the interactions between UO2and He atoms, two poten-tials are available in the literature. The first one developed by Grimes et al.[19] is based on a Lennard-Jones (12-6) interac-tion (see equainterac-tion 1), and the second one developed by Yakub et
al.[16] is based on the Buckingham equation (see equation 2).
For our study, the incorporation energy of He into UO2 is of upmost importance. Therefore, the choice of the empirical po-tential is mainly dictated by this criterion.
It is known that He atoms in low concentration are soluble in UO2matrix and are located preferentially in octahedral in-terstitial sites (OIS) [27, 28]. However, the values of this incor-poration energy are still under debate. Indeed, the data found with first principle calculations (mainly DFT) are considerably variable [29–33]. Nonetheless, one general trend can be ex-tracted: the He incorporation energy in OIS is the smallest ; hence OIS seems to be the most stable crystallographic posi-tion for the He atoms. Table 3 reports the values of the He incorporation energy into defects calculated with MD and com-pared with the ranges of values obtained with DFT calculations. Grimes potential provides the lowest incorporation energy for OIS whereas for Yakub potential it is for the uranium vacancy. Therefore, in agreement with the experimental observations and DFT calculations showing that He atoms are preferentially lo-cated in OIS, we choose the Grimes potential for the He-UO2 interactions.
Table 3: Values of the incorporation energies of He into octahedral interstitial sites (OIS), uranium vacancy (VU), and oxygen vacancy (VO) of the UO2
ma-trix calculated with Grimes [19] and Yakub [16] potentials. They are compared with the range of values calculated with DFT [29–33].
Einc(eV) Grimes Yakub DFT
OIS -0.13 0.47 -0.1 to 1.3
VU -0.05 -1.19 0.1 to 1.8
VO -0.12 0.12 1.7 to 2.4
The parameters of the Morelon potential for UO2interactions and the Grimes potential for UO2-He interactions are shown in table 2.
2.2. Helium nanobubbles
For this study, we calculate the pressure of He nanobubbles embedded in UO2matrix for different He concentrations, tem-peratures, and bubble sizes. We investigate four bubble sizes with diameter equals to: 1, 2, 5, and 10 nm. The smallest sizes (1 and 2 nm) correspond to the size of nanobubbles formed un-der irradiation in fresh fuel [2, 3] and to those found in recrys-tallized grains in SNF [34]. The higher size nanobubbles are present in the defect cluster accumulation region in SNF [34]. For each size, we investigated four temperatures: 300, 500, 700, and 900 K. These temperatures have been chosen to cover the temperature of SNF in storage conditions. The SNF tempera-ture is expected to decrease quickly from about 800 K to 473 K after a few decades [1]. The range of initial He concentration in bubbles varies from 0.33 × 10⁵mol.m−3(V
at= 50 × 10−30m3)
to a maximum of 3.9 × 10⁵mol.m−3(V
at = 4.16 × 10⁻³⁰m3).
This choice was motivated in order to investigate a large range of densities including eventually He in solid state.
In our study, we define the maximum He concentration ac-cording the mechanical answer of the UO2matrix surrounding the nanobubble. It is defined as the maximum concentration for which no damage (i.e., dislocation emission and/or nano-crack initiation) in the UO2matrix surrounding the nanobubble is ob-served. In the case where no damage occurs, the limit is reached when the final number of He atoms counted inside the bubble at the end of the simulation remains constant as the initial He concentration increases.
Table 4 summarizes the different cases studied herein. The He concentrations are expressed in molar concentration (mol.m−3) and atomic volume (m3). Another practical concen-tration unit, commonly used in atomic-scale simulations, is the ratio of the number of He atoms in the bubble to the correspond-ing number of vacancies in the UO2matrix forming the bubble. This ratio is noted, nHe/nvacin the following and is defined as:
nHe nvac
= number of He atoms in a bubble
number of U and O vacancies in a bubble (6) Namely, nHe/nvac= 1, signifies that all the vacancies (either uranium or oxygen) are replaced with one He atom and a value of 1/3 corresponds herein to one He atom per Schottky defect.
Table 4: Summary of the different systems studied herein. All the systems marked have been investigated with the following four temperatures: 300, 500, 700, and 900 K. The initial He concentration is expressed in three different units: molar concentration, CHe, atomic volume, Vat, and helium-to-vacancy ratio, nHe/nvac.
Initial He concentration
Bubble System CHe(×105mol.m−3) 0.33 0.66 1.0 1.3 1.6 1.9 2.3 2.6 2.9 3.3 3.6 3.9
diameter size Vat(×10−30m3) 50 25 16 12 10 8.3 7.1 6.2 5.5 5.0 4.5 4.2 (nm) (nm) nHe/nvac 0.3 0.5 0.8 1.1 1.4 1.6 1.9 2.2 2.4 2.7 3.0 3.3 1 9.8 × 9.8 × 9.8 3 3 3 3 3 3 3 3 3 3 3 3 2 19.6 × 19.6 × 19.6 3 3 3 3 3 3 3 3 3 3 3 5 29.5 × 29.5 × 29.5 3 3 3 3 3 3 3 3 3 10 29.5 × 29.5 × 29.5 3 3 3 3 3 3 3 3 3
The He bubbles are created by removing UO2 atoms within a sphere of radius r in the middle of the simulation box. The charge neutrality of the system is conserved by removing two oxygen for one uranium atom. Afterwards, the He atoms are randomly placed in the empty sphere with a cut-off distance of 1.5 Å either between the He atoms or between the He atom and the UO2 matrix. The system is then relaxed for 20 ps in the microcanonical ensemble (NVE) to homogenize the He atoms in the bubble. A second relaxation in constant pressure (0 GPa) and constant temperature during 50 ps is applied to anneal all the residual stresses. The bubble pressure calculation and its structural analysis are performed over the last 10 ps of this last relaxation.
The He partial hydrostatic pressure is calculated by averaging individual atomic virial stresses and is defined as:
PHe= ⟨ NHekBT Ω + 1 2Ω N∑He−1 i=1 ∑ j∈neig(i) ⃗ ri j· ⃗fi j ⟩ (7)
where NHe, Ω, and T are respectively the number of He
atoms, the bubble volume, and the temperature. kBis the
Boltz-mann constant, r⃗i j is the distance vector between the atoms i
and j and ⃗fi j represents the force exerted on atom i by atom
j. The first term of equation 7 represents the kinetic energy
of the atoms corresponding to the ideal gas contribution. The second term represents the residual contribution arising from the atomic interactions. The second sum in the interaction con-tribution is done over j the nearest neighbors of i within the potential cut-off distance, neig(i).
3. Equation of state for pure He
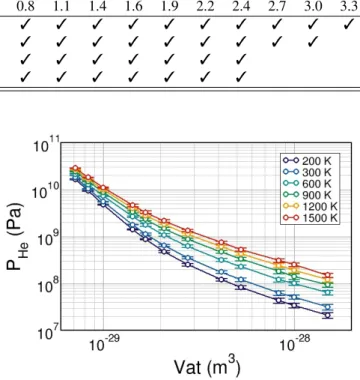
The pure He EOS have been calculated with the Tang-Toennies potential with small system size (2× 2 × 2 nm3) for temperatures between 200 to 1500 K. Fig. 2 displays the pure He EOS results.
To facilitate the implementation of the present EOS in the SNF evolution model, we adopt the formalism of Carnhan-Starling. The analytic form of the Carnahan-Starling EOS that relates the hydrostatic pressure to the atomic volume is:
PHe=
kBT
Vat
(1+ y + y2− y3)
(1− y)3 (8)
Figure 2: Pure Helium equation of states obtained with MD simulations with Tang-Toennies potential as a function of the temperature.
where kBis the Boltzmann constant, y is the volumetric
frac-tion of gas, which depends on the hard-sphere diameter, d, as follows:
y= π d
3 6 Vat
(9) According to the Brearley-MacInnes model [9], the hard-sphere diameter, d, depends on the temperature, the depth of the hard-sphere potential wellϵ (i.e. maximum attraction), and its corresponding inter-particle distanceσ (i.e., the distance at which the potential reaches its minimum) as follows:
d= σ [ A− B ln (T ϵ )] (10) where A and B are adjustable parameters. Brearley-MacInnes calculated the hard-sphere diameter for pure He with a modified Buckingham potential [9] and obtained the follow-ing equation: d= 3.135 [ 0.8542 − 0.03996 ln ( T 9.16 )] (11) with d andσ expressed in Å and ϵ expressed in K.
With the Tang-Toennies potential,σ is equal to 2.973 Å and ϵ is equal to 10.985 K. By fitting the data of Fig. 2 with the 4
Brearley-MacInnes model, we obtain a new equation for d: d= 2.973 [ 0.817 − 0.038 ln ( T 10.985 )] (12) This equation provides results close to those obtained with the Brearley-MacInnes model for low concentration, but leads to significant differences for low Vat. For instance, for Vat =
7.14 × 10⁻³⁰m3at 300 K, the pressure is only equal to 13 GPa whereas it equals 45 GPa with the Brearley-MacInnes model (see Fig. 1).
4. Results and Discussion
4.1. Nanobubble morphology 4.1.1. Nanobubble shape
To appreciate the results of the EOS in nanobubble, it is im-portant to analyse the shape and the spatial distribution of the He atoms inside the nanobubbles. This analysis is performed at the end of the relaxation. Fig. 3 shows two snapshots display-ing the He atoms in the simulation box for nanobubbles of size 2 nm (Fig. 3(a)) and 5 nm (Fig. 3(b)). One can observe easily that bubble morphology is different and depends strongly on the bubble size. For the small bubble size (1 and 2 nm), the shape of the nanobubble is a truncated octahedron, which corresponds to a typical Wulff shape of fluorite structure with a facet of type {1 1 1} [35]. Conversely, for bubbles greater than 5 nm, the bub-ble shape is perfectly spherical. These shapes have direct con-sequences on the determination of the nanobubble volume and consequently on the pressure calculation since it depends di-rectly on the bubble volume (see equation 7). Therefore, the volume calculation of each bubble is done by the Surface Mesh modifier tool provided by the OVITO software [36], which is based on the α-shape method developed by Eldelsbrunner et
al.[37].
With these figures, one can observe also that some He atoms diffuse into the first layer of the UO2matrix. They are located in the OIS. These atoms are not included in the calculation of the pressure inside the bubble.
4.1.2. Helium distribution in bubble
In the Fig. 3(b), the spatial distribution of He atoms seems inhomogeneous. More He atoms are concentrated at the bound-ary with the UO2matrix rather than in the middle of the bubble. To quantify this behavior, Fig. 4 reports the He concentration profiles inside a 10 nm diameter bubble as a function of the distance from the center of the bubble for different initial He concentration.
In all the cases, the concentration profiles are relatively ho-mogeneous inside the bubble up to a distance of about 0.2 to 0.3 nm from the surface. This distance corresponds to ap-proximately the first-nearest neighbors interatomic distance U-O in UU-O2. After this point, for initial concentrations less than 1.6 nHe/nvac (i.e., 8.3 × 10⁻³⁰ m3), we observe a peak for the He concentration near the surface of the bubble. Beyond this limit, He atoms are embedded into the UO2 matrix. The He concentration decreases rapidly and reaches zero at about 1 nm
from the surface. For initial concentrations equal or greater than 1.6 nHe/nvac, the concentration peak disappears (i.e., the He atoms are distributed homogeneously inside the bubble), and the concentration of the relaxed system saturates to a value close to 1.6 nHe/nvac. However, the point at which the concen-tration starts to drop appears at distances larger than the initial bubble size. This corresponds either to an increase of the bub-ble size or to the diffusion of He atoms through nano-cracks created at the bubble surface. This last point will be described later in section 4.3.
Nevertheless, this small boundary inhomogeneity has little influence on the pressure calculation for the EOS. However, this demonstrates the formation of a boundary layer of about 1 nm thickness at the bubble surface where the He atoms are prefer-entially located (see right picture in Fig. 4). This behavior has already been highlighted by Couet et al. for SiC [38]. In their study, the authors could calculate the free energy of He atoms in the nanobubble in SiC matrix. They found that the free en-ergy of He atoms near the surface bubble is smaller than the one in interstitial position in the matrix. This yields to a gradi-ent of the He concgradi-entration at the bubble surface. This behavior increases the number of possible He atoms that can be incorpo-rated into or close to the bubble. Furthermore, this phenomena is enhanced for small bubbles due to the Gibbs-Thomson effect. It is worth noting that in our study, we create He nanobubbles directly by introducing He atoms inside the bubble. In reality, the bubbles evolve through coalescence and growth, diffusion, or Ostwald ripening phenomena. Nonetheless, the saturation threshold found in our simulations for the He concentration at about 1.6 nHe/nvaccould correspond to a thermodynamic equi-librium that defines an upper concentration limit. To verify this hypothesis, Fig. 5 displays the number of He atoms present in a bubble after relaxation as a function of the number of initial He atoms. The bubble size considered herein is the initial one.
Figure 5: Evolution of the final He concentration as a function of the initial He concentration in bubble expressed in nHe/nvacfor different bubble sizes and
temperature. The straight line defines the ideal ratio 1:1.
In all the studied cases the He concentration in the bubble af-ter relaxation is lower than the initial concentration. As
previ-Figure 3: Snapshots taken at the end of the relaxation calculated at 500 K obtained from (a) a 2 nm helium nanobubble and (b) a 5 nm helium nanobubble. On each snapshot the image on the left is a slab of 1 nm width around the bubble (U in grey, O in red, and He in yellow) and the image on the right is a 3D projection of the full box where only the He atoms are displayed.
Figure 4: The left figure is the concentration profiles in a 10 nm diameter bubble calculated at 500 K as a function of the distance from the bubble center for different initial He concentration. The grey vertical dashed line represents the initial surface of the bubble. The figure on the right represents a snapshot of the atom spatial distribution for an initial concentration of 1.4 nHe/nvac.
ously mentioned, this signifies that part of the He atoms diffuse into the boundary layer or expend the bubble size. This be-havior is enhanced with smaller bubbles because the departure from the ideal ratio is greater. Furthermore, for all the cases, the maximum final He concentration saturates at about 1.6 nHe/nvac. However, the corresponding initial He concentration for which this limit is reached depends significantly on the bubble size. The smaller the bubble is, the higher is the initial He concen-tration required to reach the saturation point. For instance, for 10 nm diameter bubble, saturation occurs at about 1.9 nHe/nvac while for a 1 nm bubble the saturation appears only for an initial He concentration of 3 nHe/nvac. This behavior can be explained by the surface-area-to-volume ratio. Indeed, for smaller bub-bles the boundary layer is proportionally more important and incorporates more He atoms. Nevertheless, results are indepen-dent of the temperature.
4.1.3. Helium structure in bubble
To check the structural evolution of He inside the nanobub-ble, especially for high concentration, we calculated the partial pair correlation function (gHe(r)). Fig. 6 shows the g(r) for He atoms in a 10 nm diameter nanobubble for different initial He concentrations calculated at 500 K. The g(r) for 0.3 nHe/nvacis noisy because of the poor statistics due to the limited number of atoms. Nevertheless, a unique peak corresponding to the first-nearest neighbors followed by a plateau appears. This is the typical feature of a non-ideal gas (i.e., atom in interaction). As the initial He concentration increases, the intensity of the first peak increases and a second peak corresponding to a second-nearest neighbors appears. This is typical of a molecular liquid or an amorphous material. No crystal form of Helium is de-tected. Therefore, the hard-sphere model used to calculate the EOS and described in section 3 can be applied.
Figure 6: Evolution of the partial He pair correlation function (g(r)) as a func-tion of He concentrafunc-tion expressed in nHe/nvacin nanobubble of a 10 nm
diam-eter calculated at 500 K.
4.2. Equation of state for He in nanobubbles embedded in UO2
4.2.1. Bubble size influence
Fig. 7 shows the evolution of the bubble pressure as a func-tion of the atomic volume calculated at 500 K. These results are compared with the EOS obtained for pure He and with the EOS calculated with the Brearley-MacInnes model [1].
10-29 10-28
Vat (m
3)
107 108 109 1010P
He(Pa)
Brearley-MacInnes pure He d = 1 nm d = 2 nm d = 5 nm d = 10 nm Vat minFigure 7: EOS for He in nanobubbles of size 1 to 10 nm embedded in UO2
matrix at 500 K. For comparison the EOS of pure He (brown diamond sym-bols) and the EOS calculated with Brearley-MacInnes model (purple triangle symbols) are also reported. The vertical dashed line corresponds to the limit (Vatmin) that the He concentration can reach inside the nanobubble.
In this figure the error bars correspond to the standard de-viation calculated from the set of individual pressure of the He atoms inside the bubble determined from equation 7. The statistical error is higher for lower concentrations and smaller bubble sizes because of the lower number of He atom used for this calculation. Nevertheless, we can extract a general trend from these results. The pressures are lower for the He in nanobubbles than for pure He or those calculated with the Brearley-MacInnes parameters. This behavior is even more noticeable at high concentrations. We obtain clearly a mini-mum limit for the atomic volume corresponding to the upper number of He atoms that can be included into the nanobub-ble for a given bubnanobub-ble diameter. For instance, for a 5 nm di-ameter bubble, Vat = 7.8 × 10⁻³⁰ m3 corresponds to a
max-imum pressure in the nanobubble of 10 GPa at 500 K. This limiting value is very different than the one calculated with the original Brearley-MacInnes parameters for the same con-ditions: Vat = 13 × 10−30m3, which corresponds to a maximum
pressure of 69 GPa. As a consequence, with our model and for the same bubble size and temperature, more He atoms could be incorporated into the nanobubble.
To analyze the bubble size influence in a more sensitive way, we calculate the compressibility factor, Z. This dimensionless quantity describes the deviation of a real gas from the ideal gas behavior. It is defined as the ratio of the atomic volume of a gas (Vat) to the atomic volume of an ideal gas (Vat, IG) at the same
pressure and temperature conditions as follows: Z= Vat Vat, IG = P Vat kBT (13) For an ideal gas Z = 1. Fig. 8 displays the evolution of Z as a function of the initial He concentration for the different nanobubble sizes calculated at 500 K.
0 0.5 1 1.5 2
n
He/n
vac 0 10 20Compressibility factor, Z
Ideal gas Brearley-MacInnes Tang-Toennies d = 1 nm d = 2 nm d = 5 nm d = 10 nmFigure 8: Evolution of the compressibility factor, Z, as a function of the He concentration for different nanobubble sizes calculated at 500 K. For compar-ison the compressibility factor calculated for pure He and with the Brearley-MacInnes model are also reported.
These results show significant lower compressibility factor with our model and confirm that the behavior of He embedded into nanobubbles is rather different than the one of pure He and even more than the Brearley-MacInnes model. Moreover, the final He concentration in nanobubble for which Z is maximum changes with bubble size. It is maximum for nanobubble of 5 nm diameter with nHe/nvac= 1.75 (i.e. Vat = 7.8 × 10⁻³⁰m3)
and minimum for the nanobubble of 10 nm with nHe/nvac= 1.55 (i.e. Vat= 8.8 × 10⁻³⁰m3). This is probably due to the
interac-tion between the UO2 matrix and the He atoms. It is then not surprising that this behavior is more pronounced for the small-est nanobubble size (1 nm) where the surface-area-to-volume ratio is the highest.
4.2.2. Temperature influence
The EOS are calculated for four different temperatures: 300, 500, 700, and 900 K. All the EOS follow the same features. For all the temperatures the minimum limit for Vatis approximately
equivalent and equals 7.8 × 10⁻³⁰m3. However, the maximum pressure inside the nanobubble increases with increasing tem-perature from 8.4 GPa at 300 K to 13 GPa at 900 K. With these results, we can fit our results with the Brearley-MacInnes hard-sphere model described in section 3. Fig. 9 reports the evolution of the hard-sphere diameter as a function of the temperature. The resulting fitted equation for the He EOS embedded in UO2 matrix is: d= 2.973 [ 0.8414 − 0.05 ln ( T 10.985 )] (14)
As already stated, the values of the hard-sphere diameter for our model are smaller than those obtained for pure He calculated with the same He-He interatomic potential or than those calculated with the original Brearley-MacInnes parame-ters. The hard-sphere diameters range as a function of tempera-ture: 2 Å at 300 K and 1.85 at 900 K. These values are close to the first-nearest neighbors distance in solid helium at high pres-sures [39] and are coherent with the results directly obtained from the partial pair distribution functions (see section 4.1.3). This reflects a higher compactness of the He atoms inside the nanobubbles. It could arise from the He interactions with the UO2matrix that are more repulsive than the He-He interactions and impose more stress at the bubble surface.
Figure 9: Evolution of the hard-sphere diameters as a function of the tempera-ture. The results of our model (blue sphere symbols) are compared with pure He (brown diamond symbols) and original Brearley-MacInnes model (purple triangle symbols).
4.3. Mechanical integrity of UO2 due to over-pressurized He
nanobubbles
As stated in the method section, the mechanical integrity of the UO2matrix surrounding the nanobubble is a criterion for the concentration limit of He atoms into the bubble. Hence, after each relaxation phase, we verify if the UO2 matrix undergoes any damage. Herein, damage is defined either as nano-crack formation or dislocation emission. To analyze the UO2matrix, we use the OVITO software with the DXA tool (Dislocation Extraction Algorithm) [40] by checking the fcc uranium sublat-tice.
For all the initial He concentrations studied, we did not find any damage created by the nanobubbles of size equal or lower than 2 nm. However, for nanobubbles with diameter of 5 and 10 nm, which are initially perfectly spherical, both nano-cracks and dislocations appear at the bubble surface. These damages occur from 2.4 and 1.9 nHe/nvacfor diameter of 5 and 10 nm re-spectively. Fig. 10(a) and Fig. 11(a) represent the bubble struc-ture after relaxation for initial He concentrations less than the damage threshold for nanobubbles of diameter 5 and 10 nm re-spectively. Conversely, Fig. 10(b) and Fig. 11(b) are taken for 8
the same bubble sizes but for initial He concentration higher than the damage threshold. These figures show clearly that after the damage threshold, bubbles are not spherical; surface protrusions appear indicating some nano-crack openings trough which He atoms diffuse into the UO2matrix (see insert images in Fig. 10(b) and Fig. 11(b)). Simultaneously, dislocations of 1/2⟨1 1 0⟩ Burgers vector arise from the bubble surface (blue line in figures), which generates plasticity in UO2matrix. This be-havior exhibits just an initiation of mechanical damage, not the emergence of macro-cracks on a larger scale. Nevertheless, it captures the limit for the incorporation of He into the bubble.
Since we have established the concentration threshold for the mechanical damage, we can estimate the corresponding criti-cal pressure, i.e. pressure that yields the onset of nano-cracks in UO2. This concentration threshold depends on the bubble size. For 5 nm bubbles, it is equal to Vat = 7.8 × 10⁻³⁰ m3,
while for 10 nm bubbles, it is equal to Vat = 8.8 × 10⁻³⁰ m3.
The corresponding critical pressures calculated with our EOS are at 500 K: 10.4 GPa and 6.5 GPa, respectively. For small bubble sizes (i.e., < 5 nm), no critical pressure can be deter-mined because the limit of He incorporation is reached before mechanical damage appears.
Classically, the bubble critical pressures are calculated in SNF evolution model with the Griffith’s law [1]. This model links for brittle materials the stress intensity factor, K, with the size of the initial flaw and the applied tensile stress. The flaw propagates spontaneously to failure as soon as the stress inten-sity factor reaches a critical value, Kc, which corresponds to the
material toughness. Therefore the critical pressure for a bubble is calculated with the following equation:
PcritHe= √Kc
π d (15)
If we apply this equation with the value of Kcobtained with
Morelon interatomic potential, which is equal to 1.2 MPa.m1/2, the theoretical critical pressure is 9.6 and 6.8 GPa for 5 and 10 nm diameter bubble respectively. These values are close to the value directly found with MD simulations. Furthermore, the theoretical critical pressures for bubbles of 1 and 2 nm diameter are 21.4 and 15.1 GPa respectively. These pressures exceed the maximum pressure found with our MD simulation, which confirm that for small bubble sizes no mechanical damage is observed. Therefore, equation 15 seems to be a good model to determine the bubble critical pressure for the onset of nano-cracks in UO2.
5. Conclusions
A series of molecular dynamics simulations have been car-ried out to determine the He equation of state inside a nanobub-ble embedded into an UO2matrix. Four nanobubble diameters of: 1, 2, 5, and 10 nm have been investigated over four temper-atures: 300, 500, 700, and 900 K and initial He concentration ranging from 50× 10−30to 4.2 × 10⁻³⁰m3corresponding to 0.3 to 3.3 nHe/nvac.
To facilitate the implementation of this new EOS into our fuel performance codes, which uses Brearley-MacInnes model, we
choose the same hard-sphere formalism. However, we account for the interactions between the UO2matrix and the He atoms. Moreover, for the interaction between He atoms, we used the Tang-Toennies potential that provides the best agreement with experimental data of pure He at high pressures. The UO2 inter-actions are modeled with Morelon potential and interinter-actions be-tween UO2and He are modeled with Grimes’ parameters based on the Lennard-Jones formalism. The new parameters for the He EOS are: PHe= kBT Vat (1+ y + y2− y3) (1− y)3 with y= π d3 6 Vat and d= 2.973 [ 0.8414 − 0.05 ln ( T 10.985 )]
where d, the hard-sphere diameter, is expressed in Å and T is in Kelvin.
Besides, we found that the morphology of the He nanobub-bles depends on its size. For diameters lower than 5 nm, the shape of the nanobubble is a truncated octahedron following the Wulff shapes whereas for nanobubble of diameter 5 nm or higher the shape is perfectly spherical.
We observe an inhomogeneity in the He atom distribution inside the nanobubble. A boundary layer of 1 nm thickness ap-pears at the bubble surface where He atoms are more concen-trated and from which they diffuse into the UO2matrix. This behavior increases the number of He atoms that can be incorpo-rated in and near the surface bubble compared to the estimation of [1].
We found also a concentration limit for the He atoms inside the nanobubble. This maximum concentration is equal for all the cases studied herein to 1.6 nHe/nvac. It corresponds to an atomic volume of 7.8 × 10⁻³⁰ m3, which is almost half of the atomic volume of the original Brearley-MacInnes model (i.e. 13× 10−30 m3). Beyond this threshold, the He atoms diffuse into the UO2matrix or for bubble diameters higher or equal to 5 nm nano-cracks or dislocations appear at the bubble surface. Therefore, for bubble diameters less than 5 nm no critical pres-sure, yielding to UO2cracking, can be determined. Conversely, for higher diameters critical pressures are calculated from the new EOS at 500 K equal to 10.4 GPa and 6.5 GPa for diameter of 5 and 10 nm respectively. These critical pressures are ap-proximately equivalent to the values calculated with the Griffith criterion for brittle fracture. However, these conclusions, espe-cially the existence of cracks in vicinity of nanobubbles need to be confirmed with experimental observations.
Acknowledgements
This research is part of the research program COSTO, funded by EDF and CEA. This work was granted access to the HPC resources of [TGCC] under the allocation 2017-mtt7073 made by GENCI.
[1] C. Ferry, J-P. Piron, A. Ambard, ”Effect of helium on the microstructure of spent fuel in a repository: An operational approach”, J. Nucl. Mater., 407 (2010) 100109.
Figure 10: Pictures representing the damaged UO2(in white) for 5 nm diameter nanobubble including initially: (a) 2.2 and (b) 2.4 nHe/nvac. The blue lines are the
perfect dislocations (Burgers vector1/2⟨1 1 0⟩). The insert image in (b) is a slab of 1 nm width of the simulation box centered on the nanobubble.
Figure 11: Pictures representing the damaged UO2(in white) for 10 nm diameter nanobubble including initially: (a) 1.6 and (b) 1.9 nHe/nvac. The blue lines are the
perfect dislocations (Burgers vector1/2⟨1 1 0⟩). The insert image in (b) is a slab of 1 nm width of the simulation box centered on the nanobubble.
[2] C. Sabathier, L. Vincent, P. Garcia, F. Garrido, G. Carlo, L. Thom´e, P. Martin, C. Valot, ”In situ TEM study of temperature induced fission prod-uct precipitation in UO2”, Nucl. Ins. and Meth. B, 266 (2008) 3027-3032. [3] A. Michel, C. Sabathier, G. Carlot, O. Kaitasov, S. Bouffard, P. Garcia, C. Valot, ”An in situ TEM study of the evolution of Xe bubble populations in UO2”, Nucl. Ins. and Meth. B, 272 (2012), 218-221.
[4] D. Roudil,C. J´egou,X. Deschanels,S. Peuget, C. Raepsael, J-P.Gallien, V. Broudic, ”Effects of alpha self-irradiation on actinide-doped spent fuel surrogate matrix”, Materials Research Society Symposium Proceedings, 932 (2006) 529-536.
[5] D.C. Parfitt, R.W. Grimes, ”Predicted mechanisms for radiation en-hanced helium resolution in uranium dioxide”, J. Nucl. Mater., 381 (2008) 216222.
[6] J. Rest, M.W.D. Cooper, J. Spino, J.A. Turnbull, P. Van Uffelen, C.T. Walker, ”Fission gas release from UO2 nuclear fuel: A review”, J. Nucl. Mater., in press (2018) https://doi.org/10.1016/j.jnucmat.2018.08.019 [7] D.O. Ortiz Vega (2013). ”A New Wide Range Equation of State for
Helium-4.”, Doctoral dissertation, Texas A&M University.
[8] H. Trinkaus, B.N. Singh, ”Helium accumulation in metals during irradia-tion where do we stand?”, J. Nucl. Mater., 323 (2003) 229-242. [9] I.R. Brearley and D.A. MacInnes, ”An improved equation of state for
inert gases at high pressures”, J. Nucl. Mater., 95 (1980) 239-252. [10] C. Ferry, P. Lovera, C. Poinssot, P. Garcia, ”Enhanced diffusion under
alpha self-irradiation in spent nuclear fuel: Theoretical approaches”, J. Nucl. Mater., 346 (2005) 4855.
[11] A. Jelea, ”Molecular dynamics modeling of helium bubbles in austenitic steels”, Nuclear Inst. and Methods in Physics Research B 425 (2018) 5054.
[12] S.M. Hafez Haghighat, G. Lucas and R. Sch¨aublin, ”State of a pressurized helium bubble in iron”, Europhysics Letters, 85 (2009) 60008.
[13] A. Caro, J. Hetherly, A.Stukowski, M.Caro, E.Martinez, S.Srivilliputhur, L.Zepeda-Ruiz, M.Nastasi, ”Properties of Helium bubbles in Fe and FeCr alloys”, J. Nucl. Mater., 418 (2011) 261-268.
[14] R.E. Stoller, Yu.N. Osetsky, ”An atomistic assessment of helium behavior in iron”, J. Nucl. Mater., 455 (2014) 258262.
[15] B.L. Zhang, X.Y.Song, J.Wang, Q.Hou, ”Molecular dynamics study on the effect of interaction potentials on the pressures of high density he-lium”, Solid State Communications, 193 (2014) 6770.
[16] E. Yakub, C. Ronchi, D. Staicu, ”Diffusion of helium in non-stoichiometric uranium dioxide”, J. Nucl. Mater., 400 (2010) 189-195. [17] X.-Y. Liu, D.A. Andersson, ”Molecular dynamics study of fission gas
bubble nucleation in UO2”, J. Nucl. Mater., 462 (2015) 8-14.
[18] K.T. Tang, J.P. Toennies, ”The van der Waals potentials between all the rare gas atoms from He to Rn”, J. Chem. Phys., 118 (2003) 4976- 4983. [19] R.W. Grimes, R.H. Miller, C.R.A. Catlow, ”The behaviour of helium in
UO2: Solution and migration energies”, J. Nucl. Mater. 172 (1990) 123-125.
[20] N. Morelon, D. Ghaleb, JM. Delaye, L. Van Brutzel, ”A new empirical potential for simulating the formation of defects and their mobility in ura-nium dioxide”, Phil. Mag., 83 (2003) 1533-1550.
[21] A. Chartier, L. Van Brutzel, and M. Freyss, ”Atomistic study of stability of xenon nanoclusters in uranium oxide”, Phys. Rev. B, 81 (2010) 174111. [22] S.T. Murphy, A. Chartier, L. Van Brutzel, and J.-P. Crocombette, ”Free energy of Xe incorporation at point defects and in nanovoids and bubbles in UO2”, Phys. Rev. B, 85 (2012) 144102.
[23] http://lammps.sandia.gov/
[24] P. Fishbane, S.G. Gasiorowicz, and S.T. Thornton, Physics for Scientists and Engineers, 3rd Ed., Prentice-Hall, 2005.
[25] W.G. Wolfer, B.B. Glasgow, M.F. Wehner, and H. Trinkaus, ”Helium equation of state for small cavities: recent developments”, J. Nucl. Mater., 122 & 123 (1984) 565-570.
[26] D.A. Young, A.K. McMahan, and M. Ross, ”Equation of state and melt-ing curve of helium to very high pressure”, Phys. Rev. B, 24 (1981) 5119-5127.
[27] F. Garrido, L. Nowicki, G. Sattonnay, T. Sauvage, L. Thom´e, ”Lattice location of helium in uranium dioxide single crystals”, Nucl. Instr. and Meth. Phys. Res. B, 219220 (2004) 196199.
[28] E. Maugeri, T. Wiss, J.-P. Hiernaut, K. Desai, C. Thiriet, V.V. Rondinella, J.-Y. Colle, R.J. Konings, ”Helium solubility and behaviour in uranium dioxide”, J. Nucl. Mater., 385 (2009) 461-466.
[29] J-P. Crocombette, ”Ab initio energetics of some fission products (Kr, I,
Cs, Sr and He) in uranium dioxide”, J. Nucl. Mater., 305 (2002) 29-36. [30] M. Freyss, N. Vergnet, T. Petit, ”Ab initio modeling of the behavior of
helium and xenon in actinide dioxide nuclear fuels”, J. Nucl. Mater., 352 (2006) 144150.
[31] Y. Yun, O. Eriksson, P.M. Oppeneer, ”Theory of He trapping, diffusion, and clustering in UO2”, J. Nucl. Mater., 385 (2009) 510516.
[32] D. Gryaznov, E. Heifets and E. Kotomin, ”Ab initio DFT+U study of He atom incorporation into UO2 crystals”, Phys. Chem. Chemical Physics, 11 (2009) 7241.
[33] X.-Y. Liu, D.A. Andersson, ”Revisiting the diffusion mechanism of he-lium in UO2: A DFTU study”, J. Nucl. Mater., 498 (2018) 373-377. [34] K. Nogita, and K. Une, ”Irradiation-induced recrystallization in high
bur-nup UO2 fuel”, J. Nucl. Mater., 226 (1995) 302-310.
[35] R.M. Castell, ”Wulff shape of microscopic voids in UO2 crystals”, Phys. Rev. B, 68 (2003) 235411.
[36] A. Stukowski, K. Albe, ”Visualization and analysis of atomistic simula-tion data with OVITO - the Open Visualizasimula-tion Tool”, Modelling Simul. Mater. Sci. Eng. 18 (2010) 015012.
[37] H. Edelsbrunner and P. Ernst, ”Three-Dimensional Alpha shape”, ACM Transactions on Graphics, 13 (1994) 43-72.
[38] A. Couet, JP. Crocombette, A. Chartier, ”Atomistic study of the thermo-dynamic equilibrium of nano-sized helium cavities inβ-SiC”, J. Nucl. Mater., 404 (2010) 50-54.
[39] C.P. Herrero, ”Solid helium at high pressure: a path-integral Monte Carlo simulation”, J. Phys. Cond. Mater., 18 (2006) 3469-3478.
[40] A. Stukowski, V.V. Bulatov, and A. Arsenlis, ”Automated identifica-tion and indexing of dislocaidentifica-tions in crystal interfaces”, Modelling Simul. Mater. Sci. Eng. 20 (2012) 085007.