HAL Id: cea-02615666
https://hal-cea.archives-ouvertes.fr/cea-02615666
Submitted on 29 May 2020
HAL is a multi-disciplinary open access
archive for the deposit and dissemination of sci-entific research documents, whether they are pub-lished or not. The documents may come from teaching and research institutions in France or abroad, or from public or private research centers.
L’archive ouverte pluridisciplinaire HAL, est destinée au dépôt et à la diffusion de documents scientifiques de niveau recherche, publiés ou non, émanant des établissements d’enseignement et de recherche français ou étrangers, des laboratoires publics ou privés.
Lead contamination of the Seine River, France:
Geochemical implications of a historical perspective
Sophie Ayrault, Matthieu Roy-Barman, Marie-Françoise Le Cloarec, Cindy
Rianti Priadi, Philippe Bonté, Christa Göpel
To cite this version:
Sophie Ayrault, Matthieu Roy-Barman, Marie-Françoise Le Cloarec, Cindy Rianti Priadi, Philippe Bonté, et al.. Lead contamination of the Seine River, France: Geochemical implications of a historical perspective. Chemosphere, Elsevier, 2012, 87 (8), pp.902-910. �10.1016/j.chemosphere.2012.01.043�. �cea-02615666�
1
Lead contamination of the Seine River, France: geochemical
1
implications of a historical perspective.
2
Sophie Ayrault
a,*, Matthieu Roy-Barman
a, Marie-Françoise Le Cloarec
a, Cindy
3Rianti Priadi
a, Philippe Bonté
a, Christa Göpel
b 45 a
Laboratoire des Sciences du Climat et de l‟Environnement (LSCE/IPSL), UMR 1572 6
(CEA/CNRS/UVSQ), Domaine du CNRS – Bâtiment 12, Avenue de la Terrasse, F-91198 7
Gif-sur-Yvette Cedex (France) 8
b
IPGP, Laboratoire de Géochimie et Cosmochimie, 1 rue Jussieu, 75238 Paris (France) 9
10
*Corresponding author. Dr Sophie Ayrault, sophie.ayrault@lsce.ipsl.fr, Tel +33 1 69824354; 11 Fax +33 1 69823568 12 13 Abstract 14
Four sediment cores collected in the Seine River basin and dated between 1916 and 2003 15
were analysed for lead concentrations and isotopic composition. In all four cores, the 16
measured Pb concentration (up to 460 mg.kg-1) lies significantly above the natural 17
background (27-40 mg.kg-1), although a significant decrease (down to 75 mg.kg-1) was 18
observed during the second half of the 20th century which can be explained by the reduction 19
of lead emissions. The 206Pb/207Pb ratio measured in these samples indicates that the main 20
source of Pb used in the Paris conurbation is characterized by a “Rio Tinto” signature (defined 21
as 206Pb/207Pb = 1.1634 ± 0.0001). A high contribution, up to 25%, from the leaded gasoline 22
(characterized by 206Pb/207Pb = 1.08 ± 0.02) is revealed in the Seine River downstream Paris, 23
indicating that lead from the leaded gasoline is preferentially released to the river. 24
The dominating Pb signature in the Paris conurbation that is currently sampled through 25
incinerators fumes (206Pb/207Pb = 1.1550 ± 0.0005) and waste water treatment plant 26
(206Pb/207Pb = 1.154 ± 0.002), represents a mixture of highly recycled lead from the Rio Tinto 27
mine and lead from leaded gasoline (imprinted by the low 206Pb/207Pb of the Broken Hill 28
mine). This signature is called “urban” rather than “industrial”, because it is clearly distinct 29
from the Pb that is found in areas contaminated by heavy industry, i.e. the heavy industries 30
located on the Oise River which used lead from European ores characterized by high 31
206
Pb/207Pb ratios (~1.18-1.19) and possibly a minor amount of North American lead 32
(206Pb/207Pb ratios > 1.20). The “urban” signature is also found in a rural area upstream of 33
Paris in the 1970‟s. At the Seine River mouth in 2003, Pb with an urban signature represents 34
70% of the total Pb sediment content, with the 30% remaining corresponding to natural Pb. 35
*Manuscript
2 36
Keywords: Lead, isotope, pollution, Seine, industrial lead, urban lead, Paris, Broken Hill, Rio 37 Tinto, gasoline. 38 39 1. Introduction. 40 41
The Seine river basin (67,500 km²) drains one of the most urbanised areas in Europe. 42
It covers 14% of the French territory but accounts for 25% of the agriculture production, 25 to 43
30% of the industrial activity and 23% of the French population. In the Paris conurbation 44
(2,740 km², 9.5 million inhabitants), the Seine water and sediments are heavily contaminated 45
by metals. Unfortunately, the sources and pathways of these contaminations are not well 46
understood (Thévenot et al., 2007; Meybeck et al. 2007; Le Cloarec et al., 2009). 47
Lead (Pb) represents one of the major metallic contaminants of the Seine River. 48
Dredged sediments are characterized by such high Pb contents that they are classified in the 49
“moderated to highly contaminated sediment” category (Meybeck et al., 2007). Although the 50
release of Pb into the environment has been strongly reduced, the lead contamination of the 51
sediments on the downstream part of the Seine River is still three times higher than the 52
geochemical background which is in the range of 27-40 mg kg-1 (Thévenot et al., 2007). 53
The Pb concentration measured in the river sediments clearly reveals the high level of 54
contamination of the river. However, it does not provide any information on the different 55
sources of this contamination. The Pb isotopic composition represents a powerful tool to 56
evaluate the different sources of Pb (natural, industrial, leaded gasoline) that are released into 57
the environment (Monna et al., 2000; Shotyk et al., 1998). The overall balance of the lead 58
cycle in the environment is not straightforward because some Pb stocks are strongly recycled 59
and hence produce very small environmental leaks (e.g., Pb for car accumulators), whereas 60
others are directly released into the environment (emission of tetraethyl Pb from leaded 61
gasoline). 62
Gasoline lead additives were the main source of Pb to the road dust (206Pb/207Pb = 63
1.101 ± 0.001), but were less important for indoor dust accumulated from 1971 to 1981 64
(206Pb/207Pb = 1.120 ± 0.001) and even lower for the Seine River sediment (206Pb/207Pb = 65
1.152 ± 0.002) sampled in 1979 (Elbaz-Poulichet et al., 1986). The contribution of gasoline 66
lead additives to the Seine River decreased from 1979 to 2000 (206Pb/207Pb = 1.169; Millot et 67
al., 2004). In 1997, the lead contained in the street dust of Paris (206Pb/207Pb = 1.151) came 68
3 mostly from gasoline lead additives, except nearby the Eiffel Tower (206Pb/207Pb = 1.174) 69
where dust was contaminated by the lead contained in the paint used on the tower (Nageotte 70
and Day, 1998). There are also differences in isotopic compositions of aerosols sampled in 71
different sites in Paris, in 1989 and 1995 (Véron et al., 1999). From 1995 to 2002, the main 72
lead source to Parisian aerosols shifted from gasoline to the so-called “industrial” end-73
member (Widory et al., 2004). As a whole, the previous data underline the spatial and 74
temporal variability of the lead sources and their respective contribution to the pollution of the 75
Paris conurbation, claiming for an integrative study. 76
Moreover, in order to evaluate the efficiency of past and ongoing environmental 77
policies whose major goal is to reduce the heavy metal contamination, it is important to 78
establish a historical record of the Seine River contamination and to detect its different 79
contamination sources. 80
Sediment cores represent valuable archives of the anthropogenic river contamination 81
(Alfonso et al., 2001; Chillrud et al., 2003; Arnaud et al., 2004; Soster et al., 2007; Le Cloarec 82
et al., 2009), provided that they are sampled in undisturbed sites with continuous 83
sedimentation. Unfortunately, navigation and channel dredging prevent continuous 84
accumulation of sediments in the Seine River bed. The Seine River has no delta where marsh 85
cores (Alfonso et al., 2001) can be sampled. Floodplains offer an alternative, but undisturbed 86
floodplains are extremely rare along the Seine River. It was very difficult to find deposit sites 87
allowing temporal reconstructions over the last 100 years (Le Cloarec et al., in press). 88
Here, we report the Pb concentration and isotopic signature in four cores covering different 89
periods determined with the 137Cs- and 210Pb method, and three sites. This allows to: 90
1) Assess whether the changes in Pb contamination in the Seine River are related to 91
changes of the Pb source(s). 92
2) Constrain the actual Pb source(s) of the Seine River. 93
3) Evaluate the impact of leaded gasoline emissions on the past and present Seine River 94
contamination. 95
96
2. Materials and methods.
97 98
2.1. Sampling sites and sediment core dating
99 100
Figure 1
101 102
4 The core TR01 was collected in an upstream Seine River site (Fig.1). This sampling 103
site is located on an oxbow lake of the “Canal de la Haute Seine” that was built between 1806 104
and 1851 in order to connect Paris with agricultural and coal mining areas. This site drains an 105
area of 3577 km², and the population density is low, 40 inhabitants km-2. Agriculture and 106
forestry are the major activities. The 80-cm long TR01 core was collected during March 2002. 107
Bed soft sediments were cored using a hand pushed 10-cm diameter plastic tube, at a depth of 108
1 meter below the water surface. 109
Two cores, B2 and M1, were collected in the Seine River floodplain, about 100 km 110
downstream of Paris and its main waste water treatment plant (WWTP Seine Aval at Achères, 111
see Fig. 1). These two sampling sites drain 96% of the Seine River basin and are situated 112
within the last major meander of the Seine River before it reaches its estuary. “Bouafles” is 113
located just upstream of a dam, in „Les Andelys‟ (Fig. 1), in an oxbow lake located on the 114
right bank of the Seine River. It corresponds to a young accretion area as indicated by the 115
recent burial of trees. This undisturbed sampling area has remained grassland for 30 years, 116
and gradual sediment deposition has occurred. Inhabitants confirmed that this site has been 117
flooded until 2004 at least once a year. Eleven cores collected in this area between 2003 and 118
2008 indicated a continuous sedimentation during the last 60 years (see Le Cloarec et al., in 119
press). 120
The second site (Muids), where the M1 core was collected, (Fig.1) is located on the 121
same bank 12 km further downstream in the same meander of the Seine River. It is composed 122
of four islands which experienced regular flooding during wintertime. 123
All cores were sampled April 9th, 2003 using an Eijkelkamp device equipped with a 124
percussion drill bit (with 10-cm diameter and 1-m length). The stainless steel soil corer could 125
be opened laterally thus allowing an immediate transfer of the core into a PVC tube and 126
avoiding any metal contamination. 127
The 1-meter long core S01 was collected in at Pontoise-les-Noyon, March 23rd, 2005, 128
in a meander of the Oise River (Fig. 1). The site is located in an annually flooded pasture 129
downstream the city of Chauny. The core was sampled with the same equipment as the 130
samples from Bouafles and Muids. The sampling site drains an area of 4044 km² that was 131
dominated by rural and low density urban areas. The Oise River basin has been industrialized 132
since the beginning of the 1800‟s. This led to an increase of local urbanization beginning 133
shortly after the Second World War and continuing until 1975 (Le Cloarec et al., in press). 134
Today many Oise industrial plants are no longer in activity. The Saint Gobain (glass industry) 135
plant in Chauny (Fig 1), situated a few km above the sampling site, is particularly interesting 136
5 for this evaluation. This glass manufacture started its activity around 1665, employed large 137
quantities of sulphuric acid and owned several lead chambers (7 in 1850, 22 in 1870). 138
139
In addition, treated wastewater issued from the Seine – Aval waste water treatment plant 140
(WWTP) at Achères (Fig. 1) was sampled during December 2006 (Pernet-Coudrier et al, 141
2008). The Seine – Aval WWTP is connected to 80% of the Paris conurbation area combined 142
sewers (9.5 million inhabitants). 143
144
2. 2. Core dating
145
Details on the dating of the cores, such as depth profiles and sedimentation rates, are 146
given in Le Cloarec et al. (in press). 147
The sediment cores are dated through the measurement of two radionuclides, 137 Cs-148
and 210Pb. Both are strongly adsorbed on the fine fraction of the sediment (Wang and Cornett, 149
1993; Gil-García et al., 2009). Artificial 137Cs is used as an event-tracer, whereas natural 210Pb 150
provides the sediment age. 151
Both radionuclides are gamma emitters and can be analyzed in small quantities of 152
sediments (ca. 50-100 g) without any previous chemical treatment. The sediments are dried at 153
115°C, sieved (< 2 mm), powdered and then placed into air-tight counting boxes. Counting 154
was conducted during ca. 105 s using Germanium gamma-ray detectors (High purity 155
germanium – GeHP, N-type, coaxial model) at the Laboratoire des Sciences du Climat et de 156
l’Environnement (Gif-sur-Yvette, France). Efficiencies and background of the detectors are 157
controlled with internal soil and sediment standards, pure KCl samples, and IAEA standards 158
(i.e., Soil-6, -135 and –375). Activity decay was corrected taking the sediment collection 159
period into account. 160
137
Cs, an artificial radionuclide (t1/2 = 30 years), was produced by the thermonuclear 161
bomb testing conducted between the 1950‟s and the 1980‟s (the maximum input occurred in 162
1964) and the Chernobyl accident in 1986. Measurement of the 137Cs activity in the sediment 163
allows one to distinguish three events: fallout due to the first significant input in the 164
atmosphere in 1954, maximum input in 1964 and fallout due to the Chernobyl accident in 165
1986. 137Cs stock stored in soils decreases by radioactive decay and fine sediment transfer to 166
the rivers. 137Cs is easily identified in gamma spectrometry by a peak at 661 keV. The 167
uncertainty on measurements corresponds to ca. 0.5%. The detection limit reaches 0.3 Bq.kg -168
1 . 169
6 210
Pb, a natural radionuclide (t1/2 = 22.3 years), is a decay product of 238U (t1/2 = 4.5 109 170
years). 238U decays through a series of short-lived nuclides (e.g. 226Ra, 222Rn). 222Rn is a gas 171
that partly remains in situ, forming “supported” 210Pb, and that partly escapes to the 172
atmosphere, forming “excess” 210
Pb. Excess 210Pb is deposited on the soil surface via wet and 173
dry fallout and strongly sticks to the soil particles. The 210Pb activity in “excess” is calculated 174
by subtracting the supported activity (determined using a 238U daughter, i.e. 214Bi from the 175
total activity of 210Pb (Bonté et al., 2000). The uncertainty of the measurements (ca. 10%) is 176
higher than that for 137Cs. 177
178
2.3. Determination of lead concentration
179 180
Details of the determination of lead concentration in totally digested sediment samples 181
are given in Le Cloarec et al. (2009). Samples of about 100 mg are dissolved by successive 182
addition of 65% HNO3 (3 mL) and 30% HCl (7 mL) mixture, 65% HNO3 and 40% HF (5 mL 183
each), and 65% HNO3 and 69-72% HClO4 (6 mL each) in Teflon vessels using a heating 184
block (Digiprep, SCP Science). Ultra pure reagents were used (Normatom grade, VWR, 185
France for HNO3, and HCl, “for trace metal analyses”, Baker, SODIPRO, France, for HF, and 186
HClO4). The solutions were evaporated to dryness, retaken 3 times in 2 mL of HNO3 and then 187
diluted with 50 mL of MilliQ water. Three different analytical techniques were used to 188
determine the lead content: atomic absorption spectrometry (AAS), inductively coupled 189
plasma – atomic emission spectrometry (ICP-AES) and inductively coupled plasma – mass 190
spectrometry (ICP-MS) (Table 1). The accuracy of the Pb concentration determination was 191
evaluated through the analysis of the certified reference material SL-1 (lake sediment, AIEA, 192
Vienna, Austria). The obtained value, 36.6 ± 2.0 mg.kg-1 (n=15), agreed with the certified 193
concentration (37.7 mg.kg-1, certification interval: 30.3 – 45.5 mg.kg-1). For all these methods, 194
the lead concentration determination uncertainty was up to 5%. The procedural “blank” 195
contribution to the Pb concentration ranges from 0.06 % for sediments with high Pb 196
concentration up to 0.4% for sediments with low Pb content. 197
198
Fifty millilitres of bulk water samples (containing 50 mg.L-1 of dry residue) from the 199
Seine-Aval WWTP were evaporated, the residues were totally dissolved with a mixture of 200
HNO3, HCl, HF and HClO4 (Normatom grade, VWR) in Teflon vessels using a heating block 201
(Digiprep, SCP Science). The solutions were evaporated and 2 ml of HNO3 were added 202
afterwards (addition and evaporation sequence repeated three times) and then diluted with 50 203
7 mL of MilliQ water. Pb concentrations were determined by inductively coupled plasma – 204
quadrupole mass spectrometry ICP-QMS (X Series, ThermoElectron, France). Determination 205
of Pb in the reference river water NIST-1640a (National Institute for Standards and 206
Technology, Gaithersburg, USA) falls within 3 % of the certified value (n=9). 207
208
2.4. Lead isotopic measurements.
209
Lead isotope ratios (208Pb/206Pb and 206Pb/207Pb) were measured in the sediment 210
solutions that were also used for lead concentration determinations and were made by ICP-211
QMS (X Series, ThermoElectron, France), following the conditions defined in Gallon et al. 212
(2006). The experimental conditions were: three channels reading; dwell time of 30 ms; 100 213
sweeps; 5 replicates per sample. Mass bias and drift of the isotope ratios were corrected based 214
on repeated measurements of the Pb reference material NIST SRM-981 that were analysed 215
between every three samples. The 2σ-errors of isotopic ratios are 0.23% for the 206Pb/207Pb 216
and 208Pb/206Pb ratio. 206Pb/207Pb ratio of the blank corresponds to 1.168 ± 0.003 (lying in the 217
range of the 206Pb/207Pb ratios of the samples). SRM-981 was also analysed as a sample 218
(n=25) to control the bracketing correction. Values 206Pb/207Pb = 1.0933 ± 0.0015 and 219
208
Pb/206Pb = 2.1681 ± 0.0084 were obtained. Certified values for the SRM-981 are 220
206
Pb/207Pb = 1.09333 ± 0.00039 and 208Pb/206Pb ratio = 2.1681 ± 0.0008. The lead isotopic 221
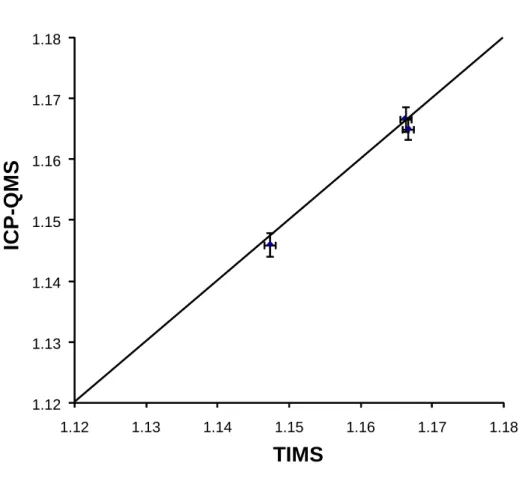
composition of three samples from core B2 were also determined by thermal ionisation mass 222
spectrometry (TIMS, Finnigan Mat 261 in LSCE), following the method described in 223
Doucelance and Manhès, 2001. Even though the data obtained using TIMS are more precise 224
than the data obtained using ICP-QMS, the results obtained with both instruments are 225
consistent (see Fig. 2). 206Pb/207Pb and 208Pb/206Pb ratios were measured. The data are 226
presented in the Supporting Information. Since both ratios are linearly correlated, only the 227
206
Pb/207Pb ratio is used in the text. 228 229 Figure 2 230 231 3. Results. 232
Results are reported in Figure 3. Pb concentrations range from 76 mg.kg-1 up to 460 233
mg.kg-1 in B2 (Bouafles), 73 mg.kg-1 to 421 mg.kg-1 in M1 (Muids), from 36 mg.kg-1 to 342 234
mg.kg-1 in S01 (Oise) and from 41 mg.kg-1 to 90 mg.kg-1 in TR01 (Troyes). In all cores except 235
that from Troyes (TR01) that starts in the 1970‟s, there is a peak of the Pb concentration 236
8 around 1960. The concentration then decreases significantly. In the Oise core, this decrease is 237
preceded by a regular strong increase that occurs between 1916 and 1960. 238
Most of the Pb concentrations mentioned in the previous paragraph are above the 239
natural background level. In the Seine River basin, Pb natural background is highly correlated 240
to the clay content of the sediment, with a Pb/Al ratio of 0.61 mg/g (Thévenot et al., 2007). 241
For the relatively Al-rich (fine grained) samples studied here, it corresponds to a Pb natural 242
background of about 27-40 mg kg-1. 243
244 245
The 206Pb/207Pb ratio varies similarly in the cores B2 and M1: 246
- the 206Pb/207Pb ratio is rather stable between 1920 to 1960, ranging from 1.163 ± 0.003 up to 247
1.166 ± 0.003 248
- between 1960 and 1986/1989, the 206Pb/207Pb ratio decreases to 1.144 ± 0.003 249
- starting from 1986/1989 up to the early 2000‟s, the 206Pb/207Pb ratio increases up to 1.163 ± 250
0.002 in 2000 and 1.166 ± 0.003 in 2003. 251
After 2000, the 206Pb/207Pb ratios in B2 and M1 are similar to that observed before 252
1960, the Pb concentration however is much lower. This is due to the above mentioned 253
general decrease of the Pb concentration. 254
In TR01, the 206Pb/207Pb ratio increases from 1.1521 ± 0.0015 in the 1970‟s to 1.175 ± 255
0.001 in 2001. 256
In S01, the 206Pb/207Pb ratio decreases from 1.181 ± 0.002 in 1916 to 1.166 ± 0.001 in 1952 257
(with the highest variation occurring between 1916 and 1927). In 1960, the highest Pb 258
concentration is accompanied at the same time by a trend towards a higher 206Pb/207Pb ratio 259
(206Pb/207Pb = 1.173 ± 0.003). This higher 206Pb/207Pb ratio then decreases until 1981 260
(206Pb/207Pb = 1.1693 ± 0.0015) and increases again (206Pb/207Pb = 1.181 ± 0.003 in 2003) 261
whereas the Pb concentration decreases. Today‟s lead concentration in the Oise sediment 262
corresponds to 36 mg.kg-1. This value lies close to the geochemical background (27-40 263
mg.kg-1; Thévenot et al., 2007; Meybeck et al., 2007), while in 1960, concentration up to 342 264
mg.kg-1 was recorded (see supporting information). 265 266 267 Figure 3. 268 Table 1 269 270
9 The Seine-Aval combined sewer system at Achères (SIAAP) collects 80% of the urban water 271
originating from the Paris conurbation. The Pb concentration is 0.53 0.01 µg.L-1, this is in 272
agreement with the detailed study of the Seine-Aval effluents composition by Buzier et al., 273
(2006). The treated waste water, sampled during December 2006 (rainy period) is 274
characterized by 206Pb/207Pb = 1.154 0.002 and may represent a mixture of lead originating 275
from different sources (roof and road runoff, domestic and industrial wastewaters). 276 277 278 4. Discussion. 279 280
4.1. Anthropogenic lead sources in the Seine river basin.
281
Lead was widely used in Paris buildings long before leaded gasoline was introduced. 282
Until now, the city of Paris has accumulated huge amounts of Pb. The accumulated lead stock 283
in the Seine river basin corresponds to 594,000 t from 1940 to 2000 (Thévenot et al., 2007). 284
The major part of the anthropogenic lead stock is distributed as follows: 100,000 t in natural 285
soils, 200,000 t in landfills, 110,000 t in pipes, tubes and roofs, 30,000 t in rivers and 286
estuaries. The remaining 154,000 t are divided between different anthropogenic items (cables, 287
glasses, accumulators, etc). The ability of these materials to contaminate the sediment varies 288
from one material to another. In addition, it may be difficult to attribute a specific Pb 289
signature to each of these items, because different ores and recycled lead may have been used 290
at different period. 291
During the second part of the 18th century, the majority of all Pb used in France was 292
imported from Spain, French ores played only a minor role (Lestel, 2007). The major part of 293
Pb imported by France from 1900-1914 came from Spain, Belgium-Luxemburg and United 294
Kingdom, Pb extraction in French mines did not play an important role. Between World War 295
1 and World War 2, Spain, Mexico and Tunisia provided most of the Pb manufactured in 296
France, the proportion of Pb furnished by French mines constantly decreased. After 1945, Pb 297
was mainly imported from Morocco and Tunisia, more recently from the United State of 298
America and the European Union. Today, all manufactured Pb in France originates from 299
recycling. 300
Pb isotopic signatures in the environment are often interpreted as resulting from the 301
mixing of three end-members: natural, industrial and gasoline Pb. The definition and the 302
characterisation of the local natural and leaded gasoline end-members are rather 303
10 straightforward (Table 2). The local natural background signature (206Pb/207Pb = 1.2007 ± 304
0.0011) was determined using a 8000 BP-14C dated sediment (Elbaz-Poulichet et al., 1986). 305
The signature of additives for leaded gasoline (206Pb/207Pb = 1.08 ± 0.02) was determined 306
based on information from Octel Ltd at Paimboeuf, the only provider of leaded additives for 307
French gasoline (Véron et al., 1999). 308
309
Table 2
310 311
The determination of the nature and isotopic signature of the “industrial” end-member 312
is more difficult. Industrial lead is characterized by an isotopic composition that is 313
intermediate between the end-members of natural and leaded gasoline (206Pb/207Pb ≈ 1.146 – 314
1.162; Monna et al., 2000; Véron et al., 1999; Widory et al., 2004) but at the same time it is 315
characterized by significantly higher Pb concentrations. Carignan et al. (2005) suggest to use 316
206
Pb/207Pb = 1.154 ± 0.003 as the best estimate for the average French industrial atmospheric 317
signature emission. Paradoxically, several heavy industries use Pb with isotopic signatures 318
that are quite distinct from the “industrial” Pb signature (Carignan et al., 2005; Nageotte and 319
Day, 1998; Véron et al., 1999). In this section, we discuss the possible sources and 320
characteristics of the so-called “industrial” lead of the Seine basin and we compare it to values 321
from previous studies. While Pb ores with different origins have been used throughout 322
history, some prevailing ore isotopic signatures are relevant (Table 3): 323
European ores: the isotopic signature of most European ores (including French ores) 324
falls in the range 206Pb/207Pb ≈ 1.16 – 1.19. Tunisian ores also lie in this range. 325
Rio Tinto: The isotopic signature of the Spanish ore (206Pb/207Pb ≈ 1.1634 ± 0.0001; 326
Marcoux, 1998) distinctively falls on the low end of the European signature. Ores from 327
Morocco are characterized by a similar signature. 328
Broken Hill: this Australian ore (together with other ores) is specifically used for the 329
production of the leaded gasoline additives. Its low isotopic signature (206Pb/207Pb ≈ 1.040 ± 330
0.001) is due to the old age of the crust from which the ore was formed. 331
Most ores from North American (Mississippi valley, Mexico) have distinctively higher 332
Pb signatures (206Pb/207Pb ≈ 1.20 ± 0.02; Rabinowitz et al., 2005). 333
334
Table 3
335 336
11 B2 and M1 cores
337
The similarity between the temporal evolution of the 206Pb/207Pb ratio of B2 and M1 338
(Fig.3) indicates that both profiles represent a global signal that characterizes the Pb isotopic 339
signature after Paris and that they are not affected by local effects or sample heterogeneity. 340
The minor difference in the concentration observed in the both profiles can be explained by 341
different clay content (Ayrault et al., 2010). 342
It is possible to discriminate distinct Pb sources in a diagram where the 206Pb/207Pb 343
ratio is plotted as a function of 1/[Pb] ratio, where [Pb] is the lead concentration (mg.kg-1). In 344
this diagram, all samples representing a mixing of 2 end-members fall on a straight line (Fig. 345
4). 346
Figure 4
347
Between 1927 and 1968, the lead isotopic signature of B2 and M1 plots in a narrow 348
range that resembles Rio Tinto (and possibly Moroccan) ores, suggesting that these ores 349
represent the most important Pb sources reaching the river. Significant contribution of other 350
European or North American ores would raise the 206Pb/207Pb ratio above the observed values 351
unless it is exactly compensated by addition of Pb from Broken Hill (see Table 3 for ores 352
isotopic lead signatures). This hypothesis is unlikely because the oldest samples from Muids 353
(1927) preceded the introduction of leaded gasoline (1931) and corresponded to a time when 354
road traffic was marginal. Contamination of the 1930 sediments by younger sediments that 355
come from the leaded gasoline period is unlikely, since: 356
- the similarity between the 137Cs profile and the 137Cs fallout history precludes mixing of the 357
sediments (both 137Cs and Pb are particle reactive); 358
- the Pb content is 3-4 times higher in ancient sediments than in the sediments from 1980; 359
- the in situ lead mobility is negligible (Alfonso et al., 2001; Kober et al., 1999). 360
361
Therefore the Rio Tinto signature probably represents the main lead contribution to the 362
Seine River basin. This Rio Tinto ore signature may be the best source estimation for Pb that 363
accumulated over centuries in the Seine River basin and may be called “historical” Parisian 364
lead. Around 1850, English companies took the control of the major Spanish mines including 365
Rio Tinto. Spain began to produce large quantities of lead, sold below the price of lead from 366
British mines, the former biggest provider to Europe. From 1878, with the declining ore 367
reserves in Britain, Spain became the major lead producer in Europe (Fletcher, 1991). 368
Surprisingly, the contribution of Pb from “heavy industries” characterized by a high 369
206
Pb/207Pb ratio cannot be resolved in the average Seine River basin lead, although it can be 370
12 detected locally (i.e., near the Eiffel Tower; Nageotte and Day (1998)). From 1968 to 371
1986/1989, the 206Pb/207Pb ratio decreases from 1.165 (Rio Tinto ~ historical Parisian Pb) to 372
1.145 ± 0.001 (line 1 on Fig. 4). This decrease is clearly coupled with the raise of the leaded 373
gasoline emission in combination with the new environmental regulations which lead to a 374
reduction of other than gasoline anthropogenic lead sources. In 1963, a directive on industrial 375
effluents quality controls was published. Between 1960 and 1980 domestic wastewater 376
treatment plants (WWTP) were gradually implemented. One important WWTP, the Seine-377
Aval combined sewer system at Achères, was operational at the end of the 70‟s. In addition to 378
the reduction of industrial effluents, leaded gasoline reduction started in 1986 and leaded 379
gasoline was completely banned after 2000. This mixing of historical Parisian lead with lead 380
from leaded gasoline produces an “urban” lead signature (previously called “industrial”) will 381
be discussed in more details hereafter. 382
After 1989, the Seine River sediment signature evolves from the urban to the natural 383
end-members (line 2, Fig. 4). Between 2000 and 2003, the 206Pb/207Pb ratio of the sediment is 384
identical to the 1945-1968 sediments but the low Pb concentration in the 2000-2003 385
sediments produces a clear trend towards the natural end-member: lead in the Seine River 386
sediment today represents a mixture of “urban” lead and natural background lead produced by 387
soil erosion. The concentrations and isotopic signature observed for the most recent deposits 388
at Bouafles and Muids are in agreement with the data observed at the Seine River mouth for 389
the same period (Millot et al., 2004). 390
Previous studies have pointed out the decrease of the 206Pb/207Pb ratio in the time 391
interval between 1900 and 1930 in the Lake Constance sediments (Germany) (Kober et al., 392
1999), in the French Alps lake sediments (Arnaud et al., 2004) and in the Mont Blanc ice 393
record (Rosman et al., 2000). As in the case of the early signatures in the Seine sediments 394
(M1), this early trend towards low 206Pb/207Pb ratios cannot be explained by leaded gasoline 395
because leaded gasoline was only introduced on 1931 in France, Italy and Germany. In 396
contrast the increase of industrial Pb uses, combined with the predominant use of Rio Tinto 397
Pb, results in a source of Pb that is characterized by a low 206Pb/207Pb ratio at the European 398 scale. 399 400 TR01 core 401
The samples (covering the 1970-2002 period) fall on the mixing line between urban 402
lead and natural lead, very similar to the samples B2 and M1 after 1990. They lie closer to the 403
natural end-member than the B2 and M1 samples because Pb contamination was less 404
13 significant in this weakly urbanized and industrialized area. Nevertheless, the anthropogenic 405
end-member in Troyes seems to consist of “urban” lead that is also present in B2 and M1. 406
407
S01 core 408
The Oise River had already been strongly polluted in 1916 by heavy industries as 409
indicated by Pb concentrations above the natural background. The 206Pb/207Pb ratio rapidly 410
increases several times and this may be caused by changes of the lead ores used by the 411
industry and/or changes in the industrial activity or recycling. Samples from 1916 to 1952 fall 412
on a mixing line between the natural and the Rio Tinto signature (206Pb/207Pb = 1.1634 ± 413
0.0001). Between 1952 and 1960, there is a clear shift towards higher 206Pb/207Pb ratios 414
(~1.17) in agreement with the use of European, Tunisian or north American ores together with 415
recycled ores. This isotopic shift is associated with the highest Pb concentration in the core. 416
Subsequently the concentrations decrease. And after 1976, the samples tend to be aligned onto 417
the urban/natural mixing line, similar to the other sites for the last 35 years, suggesting that 418
the industrial source characterized by high 206Pb/207Pb ratio has efficiently been removed. 419
The implementation of environmental regulations on industrial waste discharge to the 420
river in the 1970‟s and the decrease of the industrial activity on the Chauny site, associated to 421
the fact that an industrial discharge is a point source that is easier to mitigate than diffuse 422
urban sources, have contributed to the improve the quality of the Oise River environment. The 423
Oise River represents a successful example of river resilience towards water pollution. 424
425
4.2. Industrial lead signature revisited.
426 427
We showed in the previous section that systematic variations of the Pb isotopic 428
signature occurred over the last 75 years in a large urbanised river basin. Until now, these 429
changes were not observed because suitable archives were lacking. Our investigation shades 430
new light on the “industrial” lead signature. Until now the industrial lead signature in France 431
was estimated based on untreated and treated urban wastewater from South France (Monna et 432
al. 2000) and urban incinerators (Cloquet et al., 2006; Widory et al., 2004) that were collected 433
between 1992 and 2001. The observed signatures in this study range from 206Pb/207Pb = 1.146 434
up to 206Pb/207Pb = 1.162. Over this short time span and for these very different sites, the 435
scattering of the data was so high that no significant temporal evolution could be resolved. 436
The significantly lower 206Pb/207Pb ratio for indoor Parisian dust (1971-1981) and roadside 437
14 atmospheric particles (1974): 1.120 ± 0.001 and 1.101 ± 0.001, respectively, registered by 438
Elbaz-Poulichet et al. (1986) are probably due to sample contamination by leaded gasoline. 439
Considering that Pb rejected by the waste water treatment plant (WWTP) directly 440
enters the river and that the waste waters combine most contaminant sources of lead for the 441
river (roofs, pipes, accumulators, and oxide-containing glasses), the signature of the waste 442
waters constitutes the urban lead signature for the river sediments. Indeed the urban lead 443
signature defined by the isotopic signature of the WWTP Seine –Aval at Achères sewage 444
(206Pb/207Pb = 1.154 ± 0.002) is not significantly different from the signature of the three 445
major Parisian municipal solid waste incinerators (1.1550 ± 0.0005; Widory, 2004), the 446
leaded paint chips and the tap water contaminated by lead pipes (Table 2). 447
The urban signature measured nowadays after the complete stop of leaded gasoline in 448
2000 (206Pb/207Pb = 1.154 ± 0.002) is significantly different from the measured signature in 449
the Seine sediments before 1960 (206Pb/207Pb = 1.167 ± 0.002). This suggests that leaded 450
gasoline created an “in-depth” contamination of the environment. As argued in the previous 451
sections, the lead accumulated in the Parisian conurbation is largely dominated by the Rio 452
Tinto ores signature. This domination is enforced by recycling. The contribution of recycled 453
lead in manufacture is significant in France: 50% in 1950 increasing to 70% in 2000 (Lestel, 454
2007). Today all manufactured Pb that is used in France comes from recycling. The large 455
amount of lead accumulated in the urban structures tends to buffer the isotopic signature in 456
the river which is marginally shifted by the leaded gasoline in depth imprint. 457
The “industrial lead” denomination is ambiguous because several heavy industries in 458
the Seine basin and in France show Pb isotopic signatures that are distinct from the “industrial 459
Pb” (see section “TR01 core”). The lead signature of the Oise river sediment, directly issued 460
from industrial activities, is quite distinct (206Pb/207Pb = 1.174 ± 0.003). Therefore the 461
denomination “industrial” attributed to all the signatures but gasoline additives may be 462
abusive. In order to prevent any confusion, we use the term “urban” (206Pb/207Pb = 1.154 ± 463
0.002) for the most common Parisian Pb signatures and “heavy industries” for the relevant 464
industries. 465
466
4.3. Impact of leaded gasoline of the Seine sediment contamination.
467 468
The leaded gasoline represents a small part of the total Pb used in France (5% in the 469
early 1970‟s: 14,000 t for leaded additives over 271,000 t in total in 1974) (Meybeck et al, 470
15 2007). At the same time leaded gasoline represents almost 90% of the anthropogenic 471
atmospheric lead emission (Ferrand et al., 1999), thus raising the possibility that the Seine 472
river catchment suffers from a wide contamination by road traffic. The present data can be 473
used to evaluate the contribution of the leaded gasoline to the Seine contamination. 474
The maximum impact of the leaded gasoline in the Seine sediment contamination was 475
reached in 1986/1989 (Fig. 3), when the 206Pb/207Pb ratio was at its lowest value (1.146 ± 476
0.002). Considering that the lead was a mixture of leaded gasoline (206Pb/207Pb = 1.08 ± 0.02) 477
and historical lead whose signature is defined by the oldest sedimentary deposits (206Pb/207Pb 478
= 1.165 ± 0.002 in 1943 (B2)), as shown by the mixing line 1 on Fig. 4, the fraction of lead 479
issued from the gasoline (fgazoline) in the Seine River sediments is given by Equation 1: 480 481 (Eq. 1) 482 483 484
From Eq. 1, we calculate that the fraction of lead issued from the gasoline in the Seine 485
River sediments is 23 ± 6 % when the impact of the leaded gasoline is on the climax. The 486
choice of the value for the “urban” signature strongly affects the calculated Pb fraction 487
originating from gasoline. If we had assumed as in previous studies, that the 206Pb/207Pb ratio 488
of the urban/industrial end-member is 1.155, the calculated contribution of leaded gasoline 489
would have been only 13 ± 4 %. 490
In any case, the contribution of leaded gasoline to the Seine basin is significantly more 491
important than its contribution to the lead used in France in 1986 (<5% in Lestel, 2007). This 492
implies that Pb from leaded gasoline has a larger environmental mobility than other Pb 493
sources. This is consistent with sequential extraction experiments on soils and soakaway 494
sediments (Kumar et al., 2009). This is not surprising because Pb from combustion of leaded 495
gasoline is directly emitted in the atmosphere whereas the other sources of lead tend to be 496
stored or recycled rather than being directly dispersed into the environment. 497
Although Pb from leaded gasoline is preferentially transported by the Seine River 498
compared to other sources, it does not represent the majority of the lead present in the 499
sediments. As discussed in more detail in section 4.2., important stocks of Pb have been 500 hi s t or i cal gas ol i ne hi s t or i cal s ampl e gaz ol i ne P b P b P b P b P b P b P b P b f 207 206 207 206 207 206 207 206
16 accumulated in the Paris conurbation (soils, buildings, pipes) and their slow release in the 501
environment produces most of the Pb contamination. Leaks also occur in rural areas. The 502
residence time of particles on soil reaches up to 30,000 years at Andrésy, a site located 503
between the Seine-Aval WWTP and Bouafles (Le Cloarec et al., 2007). The strong affinity of 504
Pb for organic matter is responsible for atmospheric lead immobilisation on the uppermost 505
soil layer (Kabata-Pendias and Pendias 1992). Much shorter residence time is found for 506
particles on non-permeable soils, because of runoff washing out. 507
The stock of anthropogenic lead in the soils of Paris area is estimated to lie close to 508
143,000 t (Saby et al., 2006). This stock includes the fallouts issued from the leaded gasoline 509
combustion. Therefore, most Pb issued for the leaded gasoline combustion did not (yet) reach 510
the river. The lead issued from gasoline that is seen in the Seine sediment around 1986 was 511
probably brought to the river by road and roof runoff. The direct contamination of Pb from 512
leaded gasoline in the atmosphere compared to the other sources of Pb also explains that the 513
fraction of Pb from leaded gasoline is lower in the urban lead characterised in the 514
hydrosystem (206Pb/207Pb = 1.146 ± 0.002) than in Parisian aerosols samples approximately at 515
the same period (206Pb/207Pb = 1.1187 – 1.1260 in 1989; Véron et al., 1999). 516
517
4.4. Lead sources today.
518 519
Since runoff has probably washed out the labile lead source (i.e., the lead-520
contaminated particles on non-permeable surfaces) and since the direct inputs of lead from the 521
heavy industries are very low, the lead concentration today in the Seine river sediments 522
represents a mixture of natural and urban lead (line 2 in Fig. 4). Considering the respective 523
signature of the natural lead (206Pb/207Pb = 1.2007 ± 0.0011) and the signature of urban lead 524
(206Pb/207Pb = 1.154 ± 0.002) (line 2 in Fig. 4), we calculate that the lead today (206Pb/207Pb = 525
1.166 ± 0.004) is constituted of 30% of natural lead and 70% of urban lead. This result is 526
compatible with the concentration data, as the natural background concentration is 27-40 mg 527
kg-1 and the total lead sediment concentration is 77 mg kg-1. If the Pb concentration in the 528
urban end-member is much higher than in the natural one, it corresponds to 34% of natural 529
lead and 66% of urban lead. Moreover, these findings are also consistent with the study by 530
Thévenot et al. (2007). These authors evaluate the sources and pathways budget for seven 531
metals including lead in the Seine River basin for the period, 1994 – 2003. The total lead 532
inputs to the river reached 65 t y-1, 14 t y-1 come from erosion (22%). The anthropogenic 533
17 sources of lead to the river (51 t y-1) are mainly located in urban areas (48 t y-1). Thévenot et 534
al. (2007) estimated urban sources to contribute to 74% of the lead input to the river, the 535
urban contribution corresponds to 70% as deduced from the isotopic data. 536
537
5. Conclusion.
538 539
Most studies on the Pb isotopic signature in the Paris area or in France have focussed 540
until today on aerosols, incinerator fumes and waste water treatment plants sewage collected 541
between 1970 and 2005. The present study provides the first continuous record of the Pb 542
isotopic signature for the Paris conurbation between 1930 and 2003. These are the first 543
records that monitor the temporal evolution of riverine Pb contamination in a large urbanised 544
area. In particular, this study allows us to characterize the average isotopic signature of Pb 545
accumulated in the Paris conurbation until 1960 during the “pre-leaded gasoline” period, 546
hence defining the reference value that is used to determine the contribution of leaded 547
gasoline after 1960. This average pre-gasoline signature corresponds to the Rio Tinto ore that 548
has been highly exploited since the middle of the 19th century. As a result, we show that 549
during the 1980‟s, the contribution of leaded gasoline to the Seine River contamination 550
(around 24%) exceeds by far the contribution of the leaded gasoline additives use to the 551
global flux of Pb entering the Seine basin (5% or less). Therefore, the information brought by 552
the 206Pb/207Pb ratio will contribute to revaluate and improve the Pb fluxes in the Seine River 553
basin. 554
The impact of this study goes far beyond the Seine River basin. As the Rio Tinto ore 555
has a 206Pb/207Pb ratio that is lower than most lead ores used in Europe earlier than 1800, 556
increasing use of the Rio Tinto ore during the 19th century could account for the general 557
decrease of the 206Pb/207Pb ratio during the 19th and early 20th century that is observed in 558
various European archives (ice core, lake sediments, peat bog) which remained unexplained 559
until now because it occurred before the “leaded gasoline era”. 560
561 562 563
Acknowledgements. We thank G. Varrault and B. Pernet-Coudrier for their help for the 564
collection of WWTP sediment, and O. Evrard for mapping and land cover data collection. J.-565
M. Mouchel is thanked for his active participation to the sediment core collection and his 566
continuous support to this work. We thank the 2 anonymous reviewers for their thoughtful 567
18 comments. This work has been made possible thanks to funding from the Piren-Seine 568
programme coordinated by J.-M. Mouchel. This is the LSCE contribution number 4517. 569
570
In Supporting Information are reported the lead concentration and lead isotope composition 571
for the four cores. 572
19
REFERENCES.
574
Alfonso, S., Grousset, F., Massé, L., Tastet, J.P. A European lead isotope signal recorded 575
from 6000 to 300 years BP in coastal marshes (SW France). Atmos. Environ. 35 (2001) 576
3595-605. 577
Arnaud, F., Revel-Rolland, M., Bosch, D., Winiarski, T., Desmet, M., Tribovillard, N., 578
Givelet, N. A 300 year history of lead contamination in northern French Alps 579
reconstructed from distant lake sediment records. J. Environ. Monit. 6 (2004) 448-56. 580
Arribas, A., Tosdal, R.M. Isotopic composition of Pb in ore deposits of the Betic Cordillera, 581
Spain: Origin and relationship to other European deposits. Econ. Geol. 88 (1994) 1074-582
93. 583
Ayrault, S., Rianti, C., Evrard, O., Lefèvre, I., Bonté, P. Silver and thallium historical trends 584
in the Seine River basin. J. Environ. Monit. 12 (2010) 2177-85. 585
doi:10.1039/C0EM00153H. 586
Bonté, P., Mouchel, J.M., Thomas, A.J., Le Cloarec, M.F., Dumoulin, J.P., Sogon, S., Tessier, 587
L. Buffering of suspended sediment transport in lowland river during low water stages: 588
quantification in river Seine using environmental radionuclides. Acta Geol. Hisp. 35 589
(2000) 339-55. 590
Buzier ,R., Tusseau-Vuillemin, M.H., Martin dit Meriadec, C., Rousselot, O., Mouchel, J.M. 591
Trace metal speciation and fluxes within a major French wastewater treatment plant: 592
Impact of the successive treatments stages. Chemosphere 65 (2006) 2419–26. 593
Carignan, J., Libourel, G., Cloquet, C., Le Forestier, L. Lead Isotopic Composition of Fly Ash 594
and Flue Gas Residues from Municipal Solid Waste Combustors in France : 595
Implications for Atmospheric Lead Source Tracing. Environ. Sci. Technol. 39 (2005) 596
2018-24. 597
Chillrud, S.N., Bopp, R.F., Ross, J.M., Chaky, D.A., Hemming, S,, Shuster, E.L., Simpson, 598
H.J,, Estabrooks, F. Radiogenic lead isotopes and time stratigraphy in the Hudson 599
River, New York. Water, Air, Soil Pollut. (2003) 469-82. 600
Cloquet, C., Carignan, J., Libourel, G. Atmospheric pollutant dispersion around an urban area 601
using trace metal concentrations and Pb isotopic compositions in epiphytic lichens. 602
Atmos. Environ. 40 (2006) 574–87. 603
Cuming, G.L., Kesler, S.E., Krstic, D. Isotopic composition of lead in Mexican mineral 604
deposits. Econ. Geol. 74 (1979) 1395-407. 605
Dejonghe, L., Boulègue, J., Demaiffe, D., Létolle, R. Isotope geochemistry (S, C, O, Sr, Pb) 606
of the Chaudfontaine mineralization (Belgium). Miner. Deposita 24 (1989) 132-40. 607
Deloule, E., Allègre, C.J,. Doe, B.R. Lead and sulfur isotope microstratigraphy in galena 608
crystals from Mississippi valley-type deposits. Econ. Geol. 81 (1986) 1307-21. 609
De Vleeschouwer, F., Gérard, L., Goormaghtigh, C., Mattielli, N., Le Roux, G., Fagel, N. 610
Atmospheric lead and heravy metal pollution records from a Belgian peat bog spanning 611
the last two millennia: Human impact on a regional to global scale. Sci. Total Environ. 612
377 (2007) 282-95. 613
Doucelance, R., Manhès, G. Reevaluation of precise lead isotope measurements by thermal 614
ionization mass spectrometry: comparison with determinations by plasma source mass 615
spectrometry. Chem. Geol. 176 (2001) 361–77. 616
Elbaz-Poulichet, F., Holliger, P., Martin, J.M,, Petit, D. Stable lead isotopes ratios in major 617
French rivers and estuaries. Sci. Total Environ. 54 (1986) 61-76. 618
Fletcher, S. Lead Mining in Pain in the 19th century: Spanish industry or British adventure? 619
Bulletin Peak District Mines Historical Society 11(4) (1991) 195-202. 620
Ferrand, J.L., Hamelin, B., Monaco, A. Isotopic tracing of anthropogenic Pb inventories and 621
sedimentary fluxes in the Gulf of Lions (NW Mediterranean sea). Cont. Shelf Res. 19 622
(1999) 23-47. 623
20 Gallon, C., Tessier, A., Gobeil, C. Historical perspective of industrial lead emissions to the 624
atmosphere from a Canadian Smelter. Environ. Sci. Technol. 40 (2006) 741-747. 625
Gil-García, C., Rigol, A., Vidal, M. New best estimates for radionuclide solid–liquid 626
distribution coefficients in soils, Part 1: radiostrontium and radiocaesium. J. Environ. 627
Radioact. 100 (2009) 690-6. 628
Kabata-Pendias, A., Pendias, H. Trace Elements in Soils and Plants, 2nd ed. CRC Press, Boca 629
Raton, 1992. 630
Kesler, S.E., Cumming, G.L,, Krstic, D., Appold, M.S. Lead Isotope Geochemistry of 631
Mississippi Valley-Type Deposits of the Southern Appalachians. Econ. Geol. 89 (1994) 632
307-21. 633
Kober, B., Wessels, M., Bollhöfer, A., Mangini, A. Pb isotopes in sediments of Lake 634
Constance, Central Europe constrain the heavy metal pathways and the pollution history 635
of the catchment, the lake and the regional atmosphere. Geochim. Cosmochim. Acta 63, 636
9 (1999) 1293–1303. 637
Kumar, M., Furumai, H., Kurisu, F., Kasuga, I. Understanding the partitioning processes of 638
mobile lead in soakaway sediments using sequential extraction and isotope analysis. 639
Water Sci. Technol. 60.8 (2009) 2085-2091. 640
Krahn, L., Baumann, A. Lead isotope systematics of epigenetic lead-zinc mineralization in the 641
western part of the Rheinisches Schiefergebirge, Germany. Miner. Deposita 31 (1996) 642
225-237. 643
Laurensot, F. Importance de la qualité de l‟eau sur l‟imprégnation saturnine. Identification des 644
sources prépodérantes d‟exposition au plomb. Utilisation de l‟isotopie. Rapport d‟étude. 645
LHRSP, Agence de l‟eau Seine-Normandie. (2001) 52 p. 646
Large, D., Schaeffer, R., Höhndorf, A. Lead Isotope Data from Selected Galena Occurrences 647
in the North Eifel and North Sauerland, Germany. Miner. Deposita 18 (1983) 235-43. 648
Le Cloarec, M.F., Bonté, P., Mouchel, J.M., Lefèvre, I., Colbert, S. Distribution of 210Pb, 7Be 649
and 137Cs in watersheds of different scales in the Seine basin: inventories and residence 650
times. Sci. Total Environ. 375 (2007) 125-39. 651
Le Cloarec, M.F., Bonté, P., Lestel, L., Lefèvre, I., Ayrault, S. Sedimentary record of metal 652
contamination in the Seine River during the last century. Phys. Chem. Earth, in press. 653
Lestel, L. Le cycle du plomb. 2007; hal-00199344, version 1,
http://hal.archives-654
ouvertes.fr/hal-00199344/en/ (in French). 655
Meybeck, M., Lestel, L., Bonté, P., Moilleron, R., Colin, J.L., Rousselot, O., et al. Historical 656
perspective of heavy metals contamination (Cd, Cr, Cu, Hg, Pb, Zn) in the Seine River 657
basin (France) following a DPSIR approach (1950-2005). Sci. Total Environ. 375 658
(2007) 204-31. 659
Millot, R., Allègre, C.J., Gaillardet, J., Roy, S. Lead isotopic systematics of major river 660
sediments: a new estimate of the Pb isotopic composition of the Upper Continental 661
Crust. Chem. Geol. 203 (2004) 75– 90 662
Monna, F., Clauer, N., Toulkeridis, T., Lancelot, J. R. Influence of anthropogenic activity on 663
the lead isotope signature of Thau Lake sediments (southern France): origin and 664
temporal evolution. Appl. Geochem. 15 (2000) 1291-1305. 665
Nageotte, S., Day, J.P. Lead concentrations and isotope ratios in street dust determined by 666
electrothermal atomic absorption spectrometry and inductively coupled plasma mass 667
spectrometry. Analyst 123 (1998) 59-62. 668
Pernet-Coudrier, B., Clouzot, L., Varrault, G., Tusseau-Vuillemin, M.H., Verger, A., 669
Mouchel, J.M. Dissolved organic matter from treated effluent of a major wastewater 670
treatment plant: characterization and influence on copper toxicity. Chemosphere 73 671
(2008) 593-9. 672
21 Marcoux, E. Lead isotope systematics of the giant massive sulphide deposits in the Iberian 673
Pyrite Belt. Miner. Deposita 33 (1998) 45-58. 674
Rabinowitz, M.B. Lead isotopes in soils near five historic American lead smelters and 675
refineries. Sci. Total Environ. 346 (2005) 138– 48. 676
Rosman, K.J.R., Ly, C., Van de Velde, K., Boutron, C.F. A two century record of lead 677
isotopes in high altitude Alpine snow and ice. Earth Planet. Sci. Lett. 176 (2000) 413-678
24. 679
Saby, N., Arrouays, D., Boulonne, L., Jolivet, C., Pochot, A. Geostatistical assessment of Pb 680
in soil around Paris, France. Sci. Total Environ. 367 (2006) 212-21. 681
Sahnoun, O., Schärer, U., Added, A., Fernex, F., Abdeljaoued, S. Metal origin and Pb 682
isotopes in water of the mine-draining Mejerda river system, north Tunisia. Geochem.: 683
Explor. Environ. Anal. 9 (2009) 369-80. 684
Shotyk, W., Weiss, D., Appleby, P., Cheburkin, A., Frei, R., Gloor, M., Kramers, J., Reese, 685
S., Van Der Knapp, W. History of atmospheric lead deposition since 12,370 14C yr BP 686
from peat bog, Jura Mountains, Switzerland. Science (1998) 281, 1635-40. 687
Soster, F.M., Matisoff, G., Whiting, P.J., Fornes, W., Ketterer, M., Szechenyi, S. Floodplain 688
sedimentation rates in an alpine watershed determined by radionuclide techniques. Earth 689
Surf. Proces. Landforms 32 (2007) 2038-51. 690
Thévenot, D.R., Moilleron, R., Lestel, L., Gromaire, M.C., Rocher, V., Cambier, P., Bonté, 691
P., Colin, J.L., de Pontevès, C., Meybeck, M. Critical budget of metal sources and 692
pathways in the Seine River basin (1994-2003) for Cd, Cr, Cu, Hg, Ni, Pb and Zn. Sci. 693
Total Environ. 375 (2007) 180-203. 694
Townsend, A.T., Yu, Z., McGoldrick, P., Hutton, J.A. Precise lead isotope ratios in Australian 695
galena samples by high resolution inductively coupled plasma mass spectrometry. J. 696
Anal. At. Spectrom. 13 (1998) 809-13. 697
Véron, A., Flament, P., Bertho, M.L., Alleman, L., Flegal, R., Hamelin, B. Isotopic evidence 698
of pollutant lead sources in Nothwestern France. Atmos. Environ. 33 (1999) 3377-88. 699
Wang, K., Cornett, R.J. Distribution coefficients of 210Pb and 210Po in laboratory and natural 700
aquatic systems. J. Paleolimnol. 9 (1993) 179-88. 701
Widory, D., Roy, S., Le Moullec, Y., Toupil, G., Cocherie, A., Guerrot, C. The origin of 702
atmospheric particles in Paris: a view through carbon and lead isotopes. Atmos. 703
Environ. 38 (2004) 953-61. 704
Widory, D. Development of a method for characterising contributions of point sources to 705
atmospheric emissions of particles using a multi-isotopic approach: Application to the 706
urban area of Paris. Report BRGM/RP-53335-FR (2004). 707
708 709
22
Tables
710 711
Table 1. Details on the four analysed cores sampled in the Seine River basin.
712 713
Table 2. 206Pb/207Pb signature of samples issued from the Seine River basin. 714
715
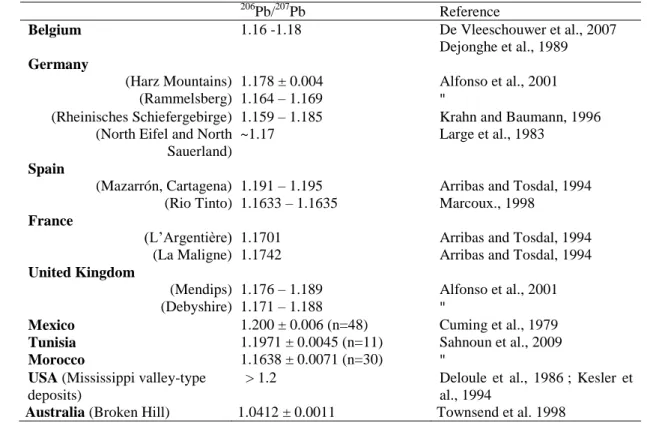
Table 3. 206Pb /207Pb signature of lead in ores potentially imported by France from 1900 to 716 today. 717 718
Figures
719 720Figure 1. Core sampling sites (black circles) in the Seine River basin. The major waste water
721
treatment plant (WWTP) Seine Aval at Achères, downstream Paris, is indicated with a black 722
square. The lined area represents the Paris conurbation that concentrates 80% of the Seine 723
River basin population (14 million inhabitants). 724
725
Figure 2. Lead isotopic composition (206Pb/207Pb) by thermal ionisation mass spectrometry 726
(TIMS) and inductively coupled plasma – mass spectrometry (ICP-QMS) in three sediment 727
samples (2 error bars). 728
729
Figure 3. Lead concentration and isotope ratio in the dated depth profiles in four cores in the
730
Seine River basin. 731
732
Figure 4. Evolution of the lead isotopic composition (206Pb/207Pb) in the Seine River basin 733
sediment: influence of geochemical background, leaded gasoline and heavy industries. 734
Paris
1.12 1.13 1.14 1.15 1.16 1.17 1.18 1.12 1.13 1.14 1.15 1.16 1.17 1.18
TIMS
IC
P
-QM
S
Figure 2. Lead isotopic composition (206Pb/207Pb) by thermal
ionisation mass spectrometry (TIMS) and inductively coupled plasma – mass spectrometry (ICP-QMS) in three sediment samples (2 error bars).
1 1 2 3 4 1910 1920 1930 1940 1950 1960 1970 1980 1990 2000 2010 0 100 200 300 400 500 Lead concentration (mg/g) Ye ar 1.14 1.15 1.16 1.17 1.18 1.19 206Pb/207Pb B2 M1
concentrations isotopic ratios
0 100 200 300 400 500
Lead concentration (mg/g)
1.14 1.15 1.16 1.17 1.18 1.19
206Pb/207Pb
TR01
concentration isotopic ratio
0 100 200 300 400 500 Lead concentration (mg/g) 1.14 1.15 1.16 1.17 1.18 1.19 206Pb/207Pb S01 concentration isotopic ratio Figure
1 1 2 3 4 1.06 1.08 1.10 1.12 1.14 1.16 1.18 1.20 0.00 0.01 0.02 0.03 B2 M1 TR01 1986 B2/M1 2003 B2/M1 geochemical background Rio Tinto 206 P b / 207 Pb historical Paris < 1970 B2/M1 Leaded gazoline 1972 TR01 2003 TR01 1/Pb (g/mg) heavy industry urban lead Eiffel tower aerosols 1/Pb (g/mg) 0.04 Increasing industry 0.01 0.02 0.03 0.04 S01 geochemical background Leaded gazoline 1960 1916 2001 1993 Eiffel tower aerosols heavy industry 0.00 Figure
Table 1. Details on the four analysed cores sampled in the Seine River basin.
Upstream Seine Oise river Downstream Seine
Core reference TR01 S01 B2 M1
More recent strata 2002 2005 2003 2003
More ancient strata 1970 1915 1948 1934
Sedimentation rate (cm yr-1) 2.6 a 1.1 b 1.1 b 1.8 b Lead concentration peak(s) date(s) 1976; 1990 1960 1963; 1994 1938; 1960 Lead concentration determination techniques
AAS ICP-AES AAS & ICP-MS
Population (1940) 130,000 240,000 9,000,000
Population (2000) 180,000 260,000 14,000,000
a 210
Pb-based chronology; b 137Cs-based chronology. AAS: atomic absorption spectrometry; ICP-AES: inductively coupled plasma – atomic emission spectrometry; ICP-MS: inductively coupled plasma – mass spectrometry
Table
Table 2. 206Pb/207Pb signature of samples issued from the Seine River basin.
Sample Sampling date /
sample age
206
Pb/207Pb Reference
Geochemical background 8000 BP 1.2007 ± 0.0011 Elbaz-Poulichet et al. (1986)
Road dust (suburbs) 1978 1.101 ± 0.001 id
Indoor dust (Paris) 1971 – 1981 1.120 ± 0.001 id
Street dust (Paris) 1997 1.151 Nageotte and Day (1998)
Eiffel tower paints 1997 1.174 id
Municipal solid waste incinerators
2001 1.1550 ± 0.0005 a Widory (2004) Urban heating plants
(Paris)
2003
burning oil 1.11 id
burning gas 1.14 – 1.20 id
Leaded gasoline 1980 - 1987 1.10 ± 0.04 Véron et al. (1999)
1987-1992 1.08 ± 0.03 id 1993 1.09 ± 0.02 id 1994-1995 1.06 ± 0.02 id Unleaded paintsb Leaded paints b >> 1940 < 1940 1.1534 ± 0.0066 1.1596 ± 0.0023 Laurensot (2001) id
Tap water (presence of lead pipes, [Pb] = 25 µg/L)
1996 – 1998 1.1561 ± 0.0031 id
Urban waste waters (combined sewer)
2006 1.154 ± 0.002 This work
a
Average of 3 Parisian incinerators (Issy, Ivry-sur-Seine, Saint Ouen). b
Professional use of leaded paint in France was banned in 1926. In-house uses of leaded paints were banned in 1993, while ceruse was progressively replaced with titanium oxides since 1940. A lead diagnostic is mandatory to sell or rent any inhabitation built before 1949.
Table
Table 3. 206Pb /207Pb signature of lead in ores potentially imported by France from 1900 to today.
206
Pb/207Pb Reference
Belgium 1.16 -1.18 De Vleeschouwer et al., 2007
Dejonghe et al., 1989
Germany
(Harz Mountains) 1.178 ± 0.004 Alfonso et al., 2001 (Rammelsberg) 1.164 – 1.169 "
(Rheinisches Schiefergebirge) 1.159 – 1.185 Krahn and Baumann, 1996 (North Eifel and North
Sauerland)
~1.17 Large et al., 1983
Spain
(Mazarrón, Cartagena) 1.191 – 1.195 Arribas and Tosdal, 1994 (Rio Tinto) 1.1633 – 1.1635 Marcoux., 1998
France
(L’Argentière) 1.1701 Arribas and Tosdal, 1994 (La Maligne) 1.1742 Arribas and Tosdal, 1994
United Kingdom
(Mendips) 1.176 – 1.189 Alfonso et al., 2001 (Debyshire) 1.171 – 1.188 "
Mexico 1.200 ± 0.006 (n=48) Cuming et al., 1979
Tunisia 1.1971 ± 0.0045 (n=11) Sahnoun et al., 2009
Morocco 1.1638 ± 0.0071 (n=30) "
USA (Mississippi valley-type
deposits)
> 1.2 Deloule et al., 1986 ; Kesler et al., 1994
Australia (Broken Hill) 1.0412 ± 0.0011 Townsend et al. 1998
Table