HAL Id: hal-00669484
https://hal.archives-ouvertes.fr/hal-00669484
Submitted on 13 Feb 2012HAL is a multi-disciplinary open access
archive for the deposit and dissemination of sci-entific research documents, whether they are pub-lished or not. The documents may come from teaching and research institutions in France or abroad, or from public or private research centers.
L’archive ouverte pluridisciplinaire HAL, est destinée au dépôt et à la diffusion de documents scientifiques de niveau recherche, publiés ou non, émanant des établissements d’enseignement et de recherche français ou étrangers, des laboratoires publics ou privés.
Nanostructure of pyrocarbons : from HRTEM imaging
to 3D atomistic models
Jean-Marc Leyssale, Jean-Pierre da Costa, Christian Germain, Patrick
Weisbecker, Antoine Villesuzanne, Gérard Vignoles
To cite this version:
Jean-Marc Leyssale, Jean-Pierre da Costa, Christian Germain, Patrick Weisbecker, Antoine Ville-suzanne, et al.. Nanostructure of pyrocarbons : from HRTEM imaging to 3D atomistic models. Pro-ceedings of Carbon 2011, Jul 2011, France. 5 p. �hal-00669484�
Nanostructure of pyrocarbons : from HRTEM imaging to 3D atomistic models
Jean-Marc Leyssalea, Jean-Pierre da Costab, Christian Germainb, Patrick Weisbeckera, Antoine Villesuzannec , Gérard Vignolesa
a
Laboratoire des Composites ThermoStructuraux (LCTS), UMR 5801 – CNRS/CEA/Snecma Propulsion Solide/Université Bordeaux 1 – 3 allée de la Boetie, 33600 Pessac, France.
b
Laboratoire d’Intégration du Matériau au Système (IMS), UMR 5218 – Université Bordeaux 1 /ENSEIRB/ENSCPB/ENITAB, 351 Cours de la libération, 33405 Talence Cedex, France.
c
Institut de Chimie de la Matière Condensée de Bordeaux (ICMCB) – CNRS, UPR 9048, 87 avenue du docteur Schweitzer, 33608 PESSAC cedex, France.
Key words: Pyrolytic Carbons, Nanostructure, atomistic modeling
Email address: [email protected]
Introduction:
Atomistic reconstruction methods are nowadays extremely useful tools to build realistic models of materials and correlates their properties to their atomistic structure [1]. However most of them, like the well-known Reverse Monte Carlo method, consists in building a model able to reproduce some orientationally averaged structural quantities like the Pair Distribution Functions (PDF) of the material, which is usually not discriminatory enough to yield a unique solution for systems having pronounced anisotropic nanotextures. For instance, two drastically different models have been reconstructed from the same PDF of a nanoporous carbon [2]. The first one is a perfectly isotropic pack of small Polycyclic Aromatic Hydrocarbons (PAH) [3] while the second one is a perfect stack of identical infinite graphene sheets containing a few percent of non-hexagonal rings [4].
High Resolution Transmission Electron Microscopy is the technique of choice to describe the nanotexture of aromatic carbons [5] and we have recently introduced a new method, the Image Guided Atomistic Reconstruction (IGAR) method, based on a combination of image analysis and synthesis and molecular dynamics simulations, aiming at building realistic atomistic representations of dense nanotextured carbons [6]. In what follows we briefly recall the methodological details of this approach and how we use it to build models of a rough laminar pyrocarbon, as prepared and after a partial graphitization through heat treatment. The models are then discussed in terms of nanotexture (HRTEM images), local average atomic structure (PDFs) as well as in terms structural defects (sp3 hybridations, non-hexagonal rings. Finally, from these structural observations we end up this paper by proposing some new, high stability, defective graphene sheets.
Image Guided Atomistic Reconstruction of pyrocarbons:
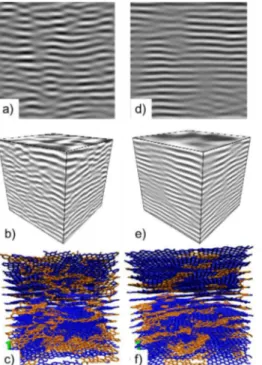
The IGAR procedure starts from some selected lattice fringe HRTEM images of the materials like those of a rough laminar pyrocarbon as prepared and after partial graphitization shown respectively on Figures 1a and 1d. From these images, first (mean, variance, skewness and kurtosis) and second (autocorrelations) order multi-resolution 2D statistical descriptors are collected. Then, these descriptors are extended to 3D according to the orthotropy of the material, in our case the statistical equivalence of every plane by rotation around the main stacking direction (vertical plane on Figure 1).
Figure 1: Illustration of the IGAR reconstruction of an “as prepared” (AP) and a “heat treated” (HT) pyrocarbons. (a): Filtered experimental HRTEM image of the AP pyC; (b) Synthesized 3D HRTEM-like image of the AP pyC; (c) Reconstructed atomistic model of the AP pyC; (d,e,f): equivalent to (a,b,c) for the HT pyC. Blue: Bonds bet w e en
atoms belonging only to hexagonal rings; Orange: Other bonds.
From these 3D statistics, the 2D image synthesis method of Portilla and Simoncelli [7] is easily extended to 3D and 3D HRTEM-like image blocks of the AP and HT pyCs can be obtained (Figures 1b and 1e respectively). These blocks are then filled with carbon atoms at the suited density and a simulated annealing simulation is launched to cool the system from the liquid state (8000 K) to room temperature. In this simulation, molecalur dynamics is used to trace the atomic motions under the combine effects of an interatomic potential UREBO, the second generation REBO potential [8], and of an external potential UHRTEM defined by the 3D image block:
U
HRTEM= k
Im
I(r
i)
i=1N
"
.In this equation, i is an index running over the atoms, I(ri) is the grey level, ranging from 0 (white) to 1 (black) at
position ri and kIm = 2 eV, is an energy conversion factor. This potential has for effect to bring the atoms to sit
between each other. As discussed in ref [6], a non-uniform cooling sequence with the slowest quench rate around the melting point of carbon is used. The models obtained for the two pyrocarbons are shown on Figures 1c and 1f. They are very similar on the “chemical” point of view with around 98 % of three-fold atoms, forming mainly hexagonal rings (around 89 %) with 5 to 6 % of pentagonal and heptagonal rings. Both models also show a structure made of hexagonal rings domains linked together by high defects density areas and screw disclocations. Actually, the main difference between the two model materials is on the nanotexture; the HT pyC model showing extended and flat carbon sheets while the AP one shows smaller and more curved sheets.
Figure 2: HRTEM images of the AP (a) and HT (b) simulated from the atomistic pyC models.
Figure 2 shows the HRTEM images simulated; using the NCEMMS software [9], from the atomistic models of the AP (Fig. 2a) and HT (Fig 2b) pyCs. Comparing these images with the filtered experimental images of Figs 1a and 1d confirms the ability of the procedure to generate a given nanotexture (small and curved fringes for the AP pyC; long and flat for the HT pyC).
Figure 3: Pair Distribution Functions (PDFs ) of an AP pyC. Blue : Neutron scattering; Red: AP pyC model.
Figure 3 shows the reduced atomic pair distribution functions (PDFs) G(r), rG(r) and r2G(r) measured on an AP pyC
powder using Neutron scattering and the corresponding functions computed from the AP model. As can be seen, the model perfectly reproduces the experimental G(r) although the two first peaks are a bit too narrow, probably because of too rigid C-C bonds in the potential model. Plots of rG(r) and r2G(r) highlight the differences between the
experimental and model PDFs at large values of r. As can bee seen, positions of the maxima and minima are extremely well reproduced by the model and the main deviation is that the model’s peaks are slightly less pronounced than the experimental ones at r larger than 1.5 nm.
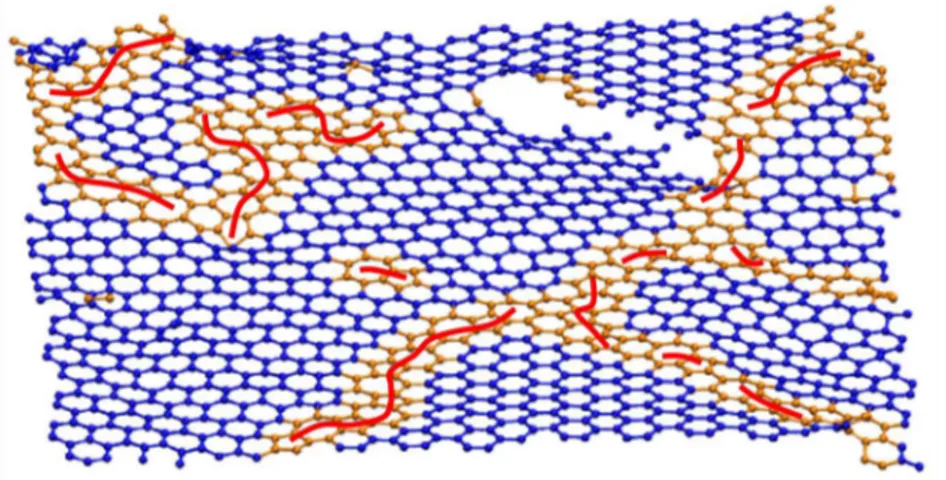
Figure 4: Snapshot of a carbon sheet taken from the HT pyC model. Blue: purely hexagonal C-C bonds; Orange:
other C-C bonds; Red: C5-C7 pairs and chains.
Figure 4 shows a carbon sheet extracted from the HT pyC model. The intra-sheet structure is made of misoriented nanometric graphenic domains (blue) connected by defective grain boundaries (orange) having a high density of pentagonal (C5) and heptagonal (C7) rings. These non hexagonal rings are found in similar proportions (between 5 and
6 %) and form C5-C7 pairs and pair lines (red) explaining the flat shape of the sheets despite this high amounts of
defects. Finally, many inter-sheet connections exist in the materials through screw dislocations as can be seen on the top right side of Figure 4. The structure of the AP pyC is very similar and the main differences are that graphenic domains are smaller, C5-C7 pairs are more scattered in the structure (shorter lines) and that the density of screw
dislocations is higher.
Figure 5: A ne w, stable, defective carbon sheet. a: Snapshot taken from the HT pyC model sho wing (green
rectangle) a defect made of t wo C7, one inverted C6 and t wo C5 rings (2C7iC62C5). b: Carbon sheet built by
Finally, we show on Figure 5a a particularly interesting class of defect observed in our HT pyC model. It is made of two adjacent heptagons (2C7) connected with an inverted hexagon (iC6) which is surrounded by two pentagons (2C5).
This motif allows two build the crystalline sheet shown on Figure 5B. Preliminary DFT calculations on this structure shows that it is more stable than haeckelite[10], the most stable carbon sheet found so far after graphene.
References:
[1] M. T. Dove, M. G. Tucker, S. A. Wells, D. A. Keen, Reverse Monte Carlo methods, EMU Notes in Mineralogy, 4, 59-82, 2002. [2] V. Petkov, R. G. Difrancesco, S. J. L. Billinge, M. Acharya, H. C. Foley. Local structure of nanoporous carbons. Phil. Mag. B, 79, 1519–1530, 1999.
[3] M. Acharya, M. S. Strano, J. P. Mathews, S. J. L. Billinge, V. Petkov, S. Subramoney, H. C. Foley, Simulation of nanoporous carbons: A chemically constrained structure. Phil. Mag. B, 79, 1499–1518, 1999.
[4] M. A. Smith, H. C. Foley, R. F. Lobo, A simple model describes the PDF of a non-graphitizing carbon, Carbon, 42, 2041–2048, 2004. [5] A. Oberlin, Pyrocarbons, Carbon, 40, 7-24, 2002.
[6] J. M. Leyssale, J. P. Da Costa, C. Germain, P. Weisbecker, G. L. Vignoles, An Image Guided Atomistic Reconstruction of pyrolytic carbons, App Phys Lett., 95, 231912, 2009.
[7] J. Portilla, E. P. Simoncelli, A Parametric Texture Model Based on Joint Statistics of Complex Wavelet Coefficients, Int. J. Comput. Vis., 40, 49-70, 2000.
[8] D. W. Brenner, O. A. Shenderova, J. A. Harrison, S. J. Stuart, B. Ni, S. B. Sinnott, A second-generation reactive empirical bond order (REBO) potential energy expression for hydrocarbons, J. Phys.: Condens. Matt., 14, 783–802, 2002.
[9] R. Kilaas, Interactive software for simulation of high resolution TEM images, in : Proceedings of the 22nd Annual Conference of the Microbeam Analysis Society, 1987.
[10] H. Terrones, M. Terrones, E. Hernández, N. Grobert, J.-C. Charlier and P.M. Ajayan, New metallic allotropes of planar and tubular carbon, Phys. Rev. Lett. 84, 1716–1719, 2000.
![Figure 2 shows the HRTEM images simulated; using the NCEMMS software [9], from the atomistic models of the AP (Fig](https://thumb-eu.123doks.com/thumbv2/123doknet/12957025.376438/4.918.326.592.627.926/figure-hrtem-images-simulated-ncemms-software-atomistic-models.webp)