Animal(2012), 6:2, pp 278–291 & The Animal Consortium 2011
doi:10.1017/S1751731111001601
animal
Fusarium
mycotoxin-contaminated wheat containing
deoxynivalenol alters the gene expression in the liver and
the jejunum of broilers
B. Dietrich
1-, S. Neuenschwander
2, B. Bucher
1and C. Wenk
11Nutrition Biology, Institute of Agricultural Sciences, Swiss Federal Institute of Technology (ETHZ), Universita¨tsstrasse 2, CH-8092 Zurich, Switzerland;2Breeding Biology, Institute of Agricultural Sciences, Swiss Federal Institute of Technology (ETHZ), Tannenstrasse 1, CH-8092 Zurich, Switzerland
(Received 1 June 2010; Accepted 19 July 2011; First published online 19 September 2011)
The effects of mycotoxins in the production of animal feed were investigated using broiler chickens. For the feeding trial, naturally
Fusariummycotoxin-contaminated wheat was used, which mainly contained deoxynivalenol (DON). The main effects of DON are
reduction of the feed intake and reduced weight gain of broilers. At the molecular level, DON binds to the 60 S ribosomal subunit and subsequently inhibits protein synthesis at the translational level. However, little is known about other effects of DON, for example, at the transcriptional level. Therefore, a microarray analysis was performed, which allows the investigation of thousands of transcripts in one experiment. In the experiment, 20 broilers were separated into four groups of five broilers each at day 1 after hatching. The diets consisted of a control diet and three diets with calculated, moderate concentrations of 1.0, 2.5 and 5.0 mg DON/kg feed, which was attained by exchanging uncontaminated wheat with naturally mycotoxin-contaminated wheat up to the intended DON concentration. The broilers were held at standard conditions for 23 days. Three microarrays were used per group to determine the significant alterations of the gene expression in the liver (P,0.05), and qPCR was performed on the liver and the jejunum to verify the results. No significant difference in BW, feed intake or feed conversion rate was observed. The nutrient uptake into the hepatic and jejunal cells seemed to be influenced by genes:SLC2A5(fc: 21.54, DON2.5), which facilitates glucose and fructose transport andSLC7A10(fc: 11.49, DON5), a transporter ofD-serine and other neutral amino acids. In the jejunum, the
palmitate transport might be altered bySLC27A4(fc: 21.87, DON5) and monocarboxylates uptake bySLC16A1(fc: 21.47, DON5). The alterations of the SLC gene expression may explain the reduced weight gain of broilers chronically exposed to DON-contaminated wheat. The decreased expressions ofEIF2AK3(fc: 21.29, DON2.5/5) andDNAJC3(fc: 21.44, DON2.5) seem to be related to the translation inhibition. The binding of DON to the 60 S ribosomal subunit and the subsequent translation inhibition might be counterbalanced by the downregulation ofEIF2AK3andDNAJC3. The genesPARP1,MPG,EME1,XPAC,RIF1andCHAF1Bare mainly related to single-strand DNA modifications and showed an increased expression in the group with 5 mg DON/kg feed. The results indicate that significantly altered gene expression was already occurring at 2.5 mg DON/kg feed.
Keywords: deoxynivalenol, liver, broiler, gene expression, microarray
Implications
The mycotoxin deoxynivalenol (DON) is a frequently detected compound produced by moulds, which grow on wheat and other cereals during pre-harvest. The main effects of DON in broilers are reduced feed consumption and weight gain. The measurement of the gene expression in the liver gave indica-tions on the functional mechanism of DON. Genes related to altered nutrient uptake to the cell, detoxification, altered
protein synthesis rate and DNA repair mechanisms could be detected. With the description of new pathways, a better understanding of the effects of DON on the metabolism of broiler chicks can be expected.
Introduction
About 25% of the world’s food crops are contaminated with mycotoxins. The most frequently occurring and widespread mycotoxin in feedstuffs for poultry in European countries is deoxynivalenol (DON) (Awad et al., 2004). The mycotoxin-contaminated wheat used in this study contained mainly
-Present address: Nutrition Biology, Institute of Agricultural Sciences, Swiss Federal Institute of Technology (ETHZ), Universita¨tsstrasse 2, CH-8092 Zurich, Switzerland. E-mail: [email protected]
278
https:/www.cambridge.org/core/terms. https://doi.org/10.1017/S1751731111001601
DON, in addition to a very low contamination with T-2 toxin and zearalenone (ZON) in relation to maximal guidance values in the European Union (EU). DON is a type B trichothecene, a secondary metabolite produced by Fusarium species mainly fromFusarium graminearumandFusarium culmorum. Owing to the growth of the fungi on maize, wheat and other cereals, poultry feed can contain DON (Rotteret al., 1996; Awadet al., 2004). In the EU, the maximal permitted value for feed con-tamination is 5 mg DON/kg feed in poultry nutrition. At that level, no damage to the birds is expected (European Union, 2006). However, decreased feed intake, weight gain and reduced peripheral blood monocytes have been observed in broilers fed 9.3 mg/kg DON in the grower phase (Swamy et al., 2004). DON fed to pigs either in a purified form or in the form of naturally contaminated corn led to reduced weight gain and feed intake. Until the end of the experiment, the animals receiving the purified DON recovered from the growth depression in contrast to the animals receiving naturally contaminated corn. The differences between naturally DON-contaminated feed sources and the feed spiked with purified DON might be caused by fungal components present in the naturally mycotoxin-contaminated feed (Preluskyet al., 1994). We decided to use naturally mycotoxin-contaminated wheat for the experiment to reproduce the effects that occur in the commercial broiler production. It was suggested that the DON tolerance of broilers results from poorer toxin bioavailability and rapid elimination from the body. DON is rapidly absorbed in the upper part of the gastrointestinal tract and is also quickly cleared from the body of the chickens. It has been suggested that an efficient clearance takes place due to a hepatic or renal first-pass effect in chickens. The oral administration of14C-DON to chickens showed high radioactivity in the liver and bile, with more than 90% of the original label occurring in the excreta before 48 h (Awadet al., 2008). Another experiment showed that in hens administered3H-DON, an overwhelming amount of radioactivity was detected in the urine, demonstrating the absorption of DON by the digestive system (Lunet al., 1989). The main DON metabolite detected in urine and faeces was de-epoxy DON (DOM-1) (Yoshizawaet al., 1986). Therefore, the liver, as a direct target of DON, was chosen to analyse the gene expression with microarrays. It has been suggested that cells and tissues with high protein turnover rate, such as the liver and small intestine, are most affected by DON (Awadet al., 2008). It was also observed that fast-growing broilers are more suscep-tible to DON than laying hens (Rotteret al., 1996). Pestka (2007) claimed that DON is metabolised in all species, and that it does not accumulate. The main effect of DON is the binding to the 60 S ribosomal subunit and the subsequent prevention of polypeptide chain initiation or elongation (Ueno, 1984). Further, DON affects the immune system either as an immunosuppres-sive or immunostimulative, depending on the dose and expo-sure regime. The immunosuppression was explained mainly by the binding capacity of DON to the ribosomes and by the inhibition of protein synthesis (Bondy and Pestka, 2000). However, there is little or no information available about the involvement of DON in the pathways of immune suppres-sion, nutritional uptake or detoxification within the living
animal. Most of the studies at the cellular level focused on the acute effects of DON administration. Long-term effects of DON-contaminated cereals seem to be important for animal production because of a regular occurrence of DON-contaminated feed.
The microarrays used in our experiment contained 37 000 probe sets corresponding to more than 28 000 genes. Espe-cially when little is known about the molecular effects of a substance, the use of microarrays as a screening method pro-vides an invaluable starting point. The sequence of the probe sets was designed according to the sequence information from all transcribed genes, including the ones with an unknown function. The profiling of gene expression with microarrays should help gain insight into the effects and metabolism-related genes upon DON administration. In addition, the expression of genes, with a biological relevance to DON administration, was verified with reverse transcription (RT) qPCR in the liver and the jejunum, to cover the main target organs of DON. Possible marker genes and affected pathways should be identified to achieve a better understanding of how chronic and low doses of mycotoxin-contaminated feed uptake affects liver and the small intestine cells in broilers. In addition, the concentration at which DON influences the gene expression in the liver should be reviewed.
Material and methods
Experimental design, birds and diets
Twenty 1-day-old male ROSS 308 broiler chicks were obtained from the commercial hatchery Erb Bru¨terei AG (Oberdiessbach, Switzerland). The birds were weighed at the beginning of the experiment and separated into four treatment groups according to similar group weight. Five broilers per treatment group per cage were raised together for 23 days. A standard diet (Table 1) was formulated according to the National Research Council (1994) and prepared for all groups in the same process. DON (52 mg/kg) was added to the basic feed mixture of the treat-ment groups in the form of mycotoxin-contaminated wheat. DON was determined in the diets using LC–MS/MS; the other mycotoxins were determined in the contaminated wheat because of their low concentration, which was close to or below the detection level in the diet. T-2 toxin and ZON con-centrations of the contaminated wheat were determined using LC–MS/MS; ochratoxin A, fumonisin B1 and B2 and aflatoxin B1, B2, G1 and G2 were determined with HPLC-fluorescence derivatisation in an external laboratory (UFAG; Sursee, Switzerland). The pelleted feed and water were provided ad libitumfrom day 1 onwards. The animal experiment was performed in accordance with the regulations of the canto-nal veterinary office in Zurich.
The total cage weight and feed intake were monitored on a weekly basis. Total water intake per cage was recorded for 4 days a week. Feed samples were taken from the principal components, the control and the treatment diet before and after pelleting and on days 1 and 23 of the experiment. All the feed samples were stored in a 48C cooler. Excreta sam-ples were taken from days 8 to 11 and from days 15 to 18 Fusariummycotoxin-contaminated wheat alters the gene expression of broilers
279
https:/www.cambridge.org/core/terms. https://doi.org/10.1017/S1751731111001601
from all four cages and stored at 2208C. Dry matter, ash, gross energy, crude fat and crude protein content were determined in all feed and excreta samples (Table 1). Apparent metabolisable energy intakes (AME) and nitrogen (N) retention were cal-culated according to the method described by Scott and Hall (1998). After 23 days, broilers were weighed individually and slaughtered by cervical dislocation. Liver samples were removed immediately and washed, and from the middle portion of the left liver lobe, a slice of about 1 cm width was cut and frozen in liquid N. In a similar way, a slice of the jejunum was collected; first 7 cm below the angle of Treitz, a 4-cm-long piece from the jejunum was cut out, and then the lumen was opened and rinsed with 0.9% NaCl before it was also frozen in liquid N.
High-density oligonucleotide array hybridisation
Total RNA was isolated from 12 frozen liver samples with TRIZOL reagent (Invitrogen, Basel, Switzerland). From all four groups, three samples were selected according to the weight of the birds. The heaviest and lightest birds were excluded. The samples were homogenised in a mortar filled
with liquid N. After isolation, RNA concentration and purity were determined with an ND-1000 (NanoDrop Technologies, Wilmington, DE, USA) and further cleaned up with the RNeasy Mini Kit (Qiagen, Hilden, Germany). Before RT, the RNA integrity was determined using a Bioanalyzer 2100 (Agilent Technologies, Basel, Switzerland). The integrity number was calculated using the Bioanalyzer 2100 software with a value between 1 (for totally degraded RNA) and 10 (for undegraded RNA). For the microarray experiments, only samples with a value higher than 9 were taken. Labelled cRNA probes were generated according to the protocol from Affymetrix using the GeneChip One-Cycle cDNA Synthesis Kit (Affymetrix, Santa Clara, CA, USA). The procedure con-sisted of RT of 7 mg total RNA with a T7 oligo (dT) promoter primer and a second-strand cDNA synthesis, followed by an in vitro transcription to biotin-labelled cRNA. Finally, the labelled cRNA was fragmented and hybridised at 458C for 16 h on the Chicken Genome Arrays (Affymetrix, Santa Clara, CA, USA). For every sample a single microarray was used. The arrays were washed and stained using the GeneChip Fluidics Station and scanned with a GeneChip Scanner 3000 according to the manufacturer’s protocol (Affymetrix, Santa Clara, CA, USA). The GeneChip operating software (GCOS, Affymetrix, Santa Clara, CA, USA) controlled the scanner and the fluidics station. The data were analysed with the Microarray Suite version 5.0 (MAS 5.0) using Affymetrix default analysis settings and global scaling as a normalisation method. The image data on each individual chip were scaled to target intensity 500. RT and qPCR
To verify the results from the microarray experiment, the total RNA was extracted from the remaining liver and the jejunum samples. RNA extraction, quantification and quality control were performed in the same manner as the microarray samples. The experiments for 20 samples per tissue were conducted in two steps: first, the RT was performed using the High-Capacity cDNA Reverse Transcription Kit (Applied Bio-systems, Rotkreuz, Switzerland) and then the real-time PCR (qPCR) was conducted with adjusted amounts of cDNA. The genes for the qPCR were selected after the gene expression analysis and the literature review, depending on their possible biological relevance in relation to mycotoxin-contaminated feed. Primers were designed with Primer Express 3.0 soft-ware (Applied Biosystems, Rotkreuz, Switzerland) on two adjoining exons in order to exclude a possible amplification due to genomic DNA contamination. The two endogenous controls mitochondrial ribosomal protein S18A(MRPS18A) andribosomal protein S17(RPS17) turned out to perform the best for adjusting the cDNA concentration, compared with the traditional and other selected control genes such asGAPDH, b-actin, DHRS7, RPS28, APOB and LDHA. Genes and the corresponding primer pairs are indicated in Table 2. The 20-ml qPCR reaction contained 500 nM of forward and reverse primers, 100 ng of sample cDNA and 10 ml Fast SYBR Master Mix (2X; Applied Biosystems, Rotkreuz, Switzerland). The PCR amplification was performed on the 7500 Fast real-time PCR System with SDS Software 1.3.1 (Applied Biosystems,
Table 1Broiler diets
Control DON1 DON2.5 DON5
DON (mg/kg) 0 1 2.5 5 Ingredients (%) Corn 17.5 Soybean meal 48% 25.0 Potato protein 2.5 Rapeseed oil 5.0 Salt 0.15 DL-methionine 0.26 Limestone grit 0.90 Lysine-HCL 0.17 DCP 38/40 1.20 Na-bicarbonate 0.30 Celite 545 1.52 Premix1 0.50 Contaminated wheat 0 1.92 4.80 9.62 Uncontaminated wheat 45.00 43.08 40.19 35.39 Analyzed parameters DON (mg/kg) 0.32 0.88 2.21 4.42 T-2 toxin (mg/kg) 0 1.0 2.5 5.1 ZON (mg/kg) 0 6.7 16.8 33.7 Dry matter (%) 90.9 90.9 91.2 91.2 G.E. (MJ/kg) 15.85 15.85 15.94 15.74 Crude fat (%) 6.81 6.97 7.03 6.97 Crude protein (%) 20.76 20.73 20.86 20.88 Ash (%) 6.47 6.57 6.70 6.66
DON 5 deoxynivalenol; DCP 5 di-basic calcium phosphate; ZON 5 zearalenone; G.E. 5 gross energy.
Contaminated wheat (52 mg DON/kg), uncontaminated wheat (0.58 mg DON/kg). Maximal allowed contamination per kg feed of poultry in European Union (2006; percentage in group DON5 of maximal allowed concentration): DON: 5 mg/kg (88.5%), T-2: 150 mg/kg (3.4%), ZON: no recommendations. Mycotoxins below the detection limits: aflatoxin B1, B2, G1, G2 (1.3 mg/kg feed), ochratoxin A (1 mg/kg feed) and fumonisin B1, B2 (10 mg/kg feed).
1Premix: diet from Aeschbacheret al. (2005).
Dietrich, Neuenschwander, Bucher and Wenk
280
https:/www.cambridge.org/core/terms. https://doi.org/10.1017/S1751731111001601
Rotkreuz, Switzerland) and repeated four times separately. The cycling programme was 20 s at 958C and then 40 cycles of the following: denaturation for 3 s at 958C, annealing and extension at 608C for 30 s. The results were evaluated with the comparative Ct method (2244Ct) with the SDS software. Statistical analysis
The alterations in the expression profiles between the control and the treatment groups were analysed using the GeneSpring 7.3 software (Agilent Technologies, Basel, Switzerland). Nor-malisation was carried out with GeneSpring 7.3 and the default settings as follows: values below 0.01 were set to 0.01; each measurement was divided by the 50th percentile of all mea-surements in that sample and each gene was divided by the 50th percentile of its measurements in all the samples. The pre-filtering was performed according to Pepperet al. (2007) as follows: the genes had to be present or marginal in all samples, and the raw value had to be above the 50th percentile, of all present and marginal genes, in all samples of a group to remove genes with a low signal strength. The gene lists from the four groups were merged together, and Student’st-test was performed between the control and each treatment group (P,0.05). Further, genes were grouped into seven subgroups: first, genes with significant changed expression in only one group (DON1, DON2.5, DON5) compared with the control group; then, genes within two groups (DON1/2.5, DON2.5/5, DON1/5) compared with the control group and genes within all three groups (DON1/2.5/5) compared with the control. Finally, for every subgroup at-test was performed and theP-values are indicated in Tables 4 and 5. The fold changes were listed for every comparison. The final gene list was separated into groups of up- and downregulated genes. The microarray raw data have been deposited into the Gene Expression Omnibus (National
Center for Biotechnology Information, http://www.ncbi.nlm. nih.gov/geo) with accession number GSE25185. Genes with an average raw value above the 80th percentile, of all present and marginal genes, in the group with the significantly changed expression are indicated with an asterisk (Tables 4 and 5). The average raw value was indicated to estimate the importance of a gene in cellular processes. All the other measured parameters were analysed using Student’s t-test to determine significance (P,0.05).
Results
Diet characterisation and performance of broilers
The DON concentration of the control diet was 0.32 mg/kg feed, which was close to the detection level of 0.2 mg DON/ kg. The DON concentration in DON1 was 0.89 mg/kg, 2.21 mg/kg for DON2.5 and 4.43 mg/kg for DON5. The cal-culated T-2 toxin and ZON concentrations in group DON5 were low, with values of 5.1 and 34.6 mg/kg feed, respec-tively. The other measured mycotoxin concentrations were below the detection limit. The performance of the broilers within the groups was balanced, and they did not show an abnormal behaviour or other indications due to DON con-tamination. The progression of growth and the feed intake were within the range of expectation (Table 3). No behav-ioural or macroscopic pathological alterations were detected in the appearance of liver, stomach, intestine, spleen, heart, muscles and lungs of the broilers receiving the mycotoxin-contaminated feed.
The parameters for the RNA quality and quantity, as well as the microarray quality parameters, were within the requirements. In Tables 4 and 5, a summary of genes with an altered expression are sorted according to the DON groups.
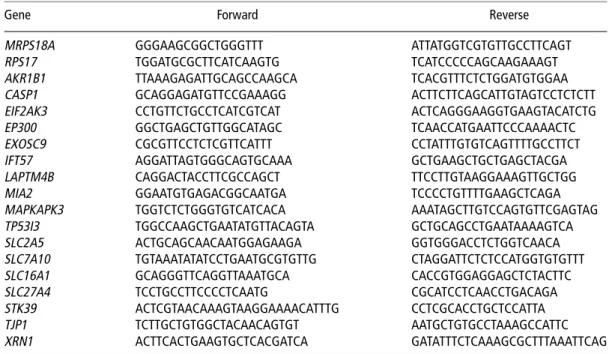
Table 2Primer sequence for qPCR
Gene Forward Reverse
MRPS18A GGGAAGCGGCTGGGTTT ATTATGGTCGTGTTGCCTTCAGT
RPS17 TGGATGCGCTTCATCAAGTG TCATCCCCCAGCAAGAAAGT
AKR1B1 TTAAAGAGATTGCAGCCAAGCA TCACGTTTCTCTGGATGTGGAA
CASP1 GCAGGAGATGTTCCGAAAGG ACTTCTTCAGCATTGTAGTCCTCTCTT
EIF2AK3 CCTGTTCTGCCTCATCGTCAT ACTCAGGGAAGGTGAAGTACATCTG
EP300 GGCTGAGCTGTTGGCATAGC TCAACCATGAATTCCCAAAACTC
EXOSC9 CGCGTTCCTCTCGTTCATTT CCTATTTGTGTCAGTTTTGCCTTCT
IFT57 AGGATTAGTGGGCAGTGCAAA GCTGAAGCTGCTGAGCTACGA
LAPTM4B CAGGACTACCTTCGCCAGCT TTCCTTGTAAGGAAAGTTGCTGG
MIA2 GGAATGTGAGACGGCAATGA TCCCCTGTTTTGAAGCTCAGA
MAPKAPK3 TGGTCTCTGGGTGTCATCACA AAATAGCTTGTCCAGTGTTCGAGTAG
TP53I3 TGGCCAAGCTGAATATGTTACAGTA GCTGCAGCCTGAATAAAAGTCA
SLC2A5 ACTGCAGCAACAATGGAGAAGA GGTGGGACCTCTGGTCAACA
SLC7A10 TGTAAATATATCCTGAATGCGTGTTG CTAGGATTCTCTCCATGGTGTGTTT
SLC16A1 GCAGGGTTCAGGTTAAATGCA CACCGTGGAGGAGCTCTACTTC
SLC27A4 TCCTGCCTTCCCCTCAATG CGCATCCTCAACCTGACAGA
STK39 ACTCGTAACAAAGTAAGGAAAACATTTG CCTCGCACCTGCTCCATTA
TJP1 TCTTGCTGTGGCTACAACAGTGT AATGCTGTGCCTAAAGCCATTC
XRN1 ACTTCACTGAAGTGCTCACGATCA GATATTTCTCAAAGCGCTTTAAATTCAG
50–30direction.
Fusariummycotoxin-contaminated wheat alters the gene expression of broilers
281
https:/www.cambridge.org/core/terms. https://doi.org/10.1017/S1751731111001601
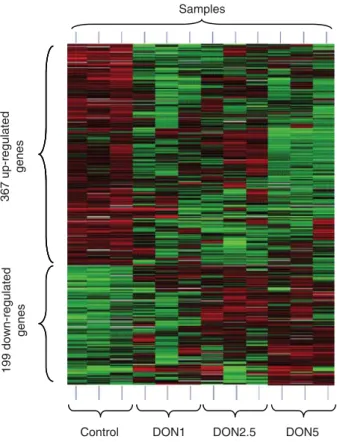
The expression of a total of 566 genes was significantly altered in DON groups compared with the control group (supplementary files). The heatmap of the cluster analysis of all significantly altered genes between the control and the DON-containing groups is shown in Figure 1.
The entire list of up- and downregulated genes is available in the section of supplementary files. In the DON groups, 367 genes were upregulated. Of these, 230 genes have been specified in relation to their function or structure, and for 138 genes only the transcript sequence is known. The average expression of 152 upregulated genes, or 41% of the upre-gulated genes, was above the 80th percentile of the raw value of all genes, which is indicated by an asterisk (*) in the column ‘Fold change’ (Tables 4 and 5). The fold change of 28 genes was above two. Venn diagrams are presented in the section of supplementary files with the distribution of significantly altered genes between the treatment groups. A summary of discussed genes with an upregulated expre-ssion in the DON groups is presented in Table 4.
In Table 5, the most important and significantly down-regulated genes are indicated according to the DON groups. Of 199 significantly downregulated genes, the function of 139 genes was known. Sixty genes were unknown or no function could be assigned to them; 14 genes had a fold change higher than two; and 45 genes, or 32% of the downregulated genes, had a raw value above the 80th percentile.
RT and qPCR
The results from the microarray experiment were verified with RT qPCR, and the results are shown in Table 6. The alterations could be confirmed for 9 of the 15 genes in the liver. A total of 10 of 17 genes showed a significantly altered expression in the liver and the jejunum. The correlation between the fold changes of the qPCR experiment and the microarray analysis in group DON5 was 0.75. XRN1 and SLC16A1 expression were measured because of their bio-logical relevance. The genes AKR1B1, MIA2, SLC2A5, SLC7A10and LAPTM4Bwere significantly regulated in the liver, measured with qPCR and microarrays, as well as in the jejunum tissues. SLC27A4, CASP1 and EP300 had a sig-nificant altered expression in the microarray experiment in the liver and in the qPCR experiment in the jejunum. The alteration of the expression for the genes EXOSC9, TJP1,
EIF2AK3and IFT57could be confirmed only in the liver by qPCR. SLC16A1 was not significantly altered in any mea-surement in the liver, but showed a decreased expression in the jejunum groups. The reduced expression ofXRN1did not reach significance in the microarray analysis (P,0.08), but was significantly reduced in the qPCR measurement. The expression alteration of the genes MAPKAPK3,STK39 and TP53I3 could not be confirmed with qPCR in any tissues. Taking the liver and jejunum groups together, 14 of 17 expression alterations could be confirmed with qPCR. Discussion
The use of naturally mycotoxin-contaminated wheat resulted primarily in a high DON contamination (4.425 mg/kg) and a low calculated contamination with T-2 (5.1 mg/kg) and ZON (33.7 mg/kg) in the final feed mixture of DON5. Because of the low calculated concentrations of T-2 and ZON approxi-mately or below the detection level, they were measured in naturally mycotoxin-contaminated wheat. The other mea-sured mycotoxins in the mycotoxin-contaminated wheat were below the detection limit. The maximal allowed con-centration for DON in poultry feed is 5 mg/kg feed and 150 mg/kg feed for T-2. No maximal guidance values exist for ZON (bovine: 500 mg/kg feed), because of the high tolerance of poultry. The maximal permitted mycotoxin concentrations are related to the level at which no damage to the birds is expected (EFSA, 2004). The mycotoxin analysis in the final feed mixture showed, in comparison with the maximal permitted concentration, a proportion of 88.5% of DON, 3.4% of T-2 and 6.7% of ZON (bovine guidance value) in the feed of group DON5. Because of the high proportion of DON and the low amount of T-2 and ZON, we considered the observed alterations at the transcriptional level due to the effects of DON. Most of the reported effects have been investigated mainly in cell cultures or model organisms such as mice. In our experiment, we showed for the first time similar alterations in the gene expression in broilers.
The growth, feed intake and feed conversion rates were within the normal range in our experiment. Although BW and feed intake were numerically the lowest in group DON5 and the highest in group DON2.5, this was statistically not significant. It has been mentioned by Awadet al. (2008) that
Table 3Performance parameters
Control % DON 1 % DON 2.5 % DON 5 %
BW day 22 (g) 6 s.e. 1118 6 36.0 1140 6 19.8 1201 6 30.1 1084 6 80.4 FI week 3 (g) 807 839 908 771 FCR (g/g) 1.50 1.53 1.60 1.54 AME P1 (MJ/kg)/(%) 15.27 100 14.97 98.1 15.44 101.2 14.75 96.6 AME P2 (MJ/kg)/(%) 14.74 100 14.73 99.9 14.89 101.1 13.87 94.1 N retention P1 (%) 67.74 100 64.72 95.5 69.26 102.3 66.47 98.1 N retention P2 (%) 65.08 100 63.64 97.8 63.79 98.0 59.20 91.0
DON 5 deoxynivalenol; FI 5 feed intake; FCR 5 feed conversion rate (g gain/g feed); AME P1/2 5 apparent metabolisable energy in MJ/kg dry matter and % relative to the control; P1/2 5 period 1 or 2.
Dietrich, Neuenschwander, Bucher and Wenk
282
https:/www.cambridge.org/core/terms. https://doi.org/10.1017/S1751731111001601
Table 4Upregulated genes in DON group
Systematic name Name Fc P Description Function
Upregulated in DON 1, DON 2.5 and DON 5
Affx.10275.1.S1_at SAMD12 1.9, 1.9, 2.0 0.033 Sterile alpha motif domain containing 12 Signalling 9157.1.S1_at COX19 1.4, 1.7, 1.6 0.016 Cytochromec oxidase assembly homologue Metal transport
Affx.11292.2.S1_s_at LOC425649 1.9, 1.5, 1.4 0.006 Similar to rhomboid family 1 Epidermal growth factor receptor 3382.1.S1_at PPIB 1.4, 1.2, 1.4 0.015 Peptidylprolyl isomerase B (cyclophilin B) Immune system
Affx.1528.1.S1_at MAPKAPK3 1.5, 1.3, 1.3 0.001 Mitogen-activated protein kinase APK3 p38 MAPK pathway Upregulated DON 2.5 and DON 5
Affx.24663.2.S1_s_at IFT57 2.0, 3.0 0.004 Intraflagellar transport 57 homologue Regulation of Apoptosis Affx.4365.1.S1_at LOC416968 1.9, 2.0 0.012 Similar to presenilin-like protein 4 Peptidase
2529.2.S1_a_at IL1RL1 1.7, 1.7 0.024 Interleukin 1 receptor-like 1 Innate immune response
9700.2.S1_a_at TSPAN7 1.4, 1.4 0.017 Tetraspanin 7 Signal transduction
Upregulated in DON 1 and DON 2.5
Affx.12452.1.S1_s_at KLF11 2.5, 2.1* 0.015 Kruppel-like factor 11 Neg. regulation of cell proliferation Upregulated in DON 1 and DON 5
16554.2.S1_a_at LAPTM4B 4.2, 3.1 0.013 Lysosomal associated prot. Transmem. 4b
10204.1.S1_s_at CASP1 1.8, 2.2 0.006 Caspase 1 Apoptosis/interleukin 1 convert.
11819.1.S1_at CENPQ 1.6, 1.8 0.032 Centromere protein Q Centromeric complex
Affx.10735.1.S1_at MITD1 1.6, 1.7 0.005 Microtubule interact./transp. dom. cont. 1 Protein transport
2952.1.S1_at CLDN3 1.6, 1.6 0.031 Claudin 3 Leukocyte transendothelial migrat.
Affx.12447.1.S1_at SLC16A9 2.0, 1.6 0.002 Solute carrier fam. 16, mem. 9 Monocarboxylic acid transporter 3364.2.S1_at LOC425437 1.7, 1.5 0.025 Similar to phosphatidylinositol glycan B Glycolipid mannosyltransf. activity 2252.1.S1_s_at RAB33B 1.5, 1.4 0.018 RAB33B, member RAS oncogene family Protein transport
Affx.11111.1.S1_s_at GDPD5 2.1, 1.4 0.017 Glycerophosphodiester phosphodiester. 5 Glycerol metabolic process Upregulated in DON 5
12857.1.S1_s_at TP53I3 2.646 0.025 Tumor protein p53 inducible protein 3 Apoptosis by oxidative stress Gga.13986.1.S1_at IFT57 2.617 0.003 Intraflagellar transport 57 homologue Regulaiton of apoptosis
4124.1.S1_at LOC395933 2.597* 0.028 Sulfotransferase Sulfotransferase activity
4332.1.S1_at HSPCB 1.972 0.030 Heat shock 90kDa protein 1, beta Response to unfolded protein
635.1.S1_at GLRX 1.901* 0.031 Glutaredoxin (thioltransferase) Cell redox homeostasis
Affx.7092.1.S1_at GNPAT 1.869* 0.029 Glyceronephosphate O-acyl-transferase Fatty acid metabolic process Affx.12177.1.S1_s_at MCM5 1.832 0.022 Minichromosome maintenance complex 5 DNA replication, cell cycle Affx.8046.1.S1_s_at SLC41A2 1.832 0.032 Solute carrier family 41, member 2 Cation transport
Affx.24672.1.S1_s_at PROS1 1.812* 0.011 Protein S (alpha) Blood coagulation
3251.1.S1_at NDUFS1 1.802 0.013 NADH dehydrogenase Fe-S protein 1 ATP metabolic process
Affx.12875.1.S1_at VPS29 1.779 0.037 Vacuolar protein sorting 29 homologue Protein transport 11184.1.S1_at KCTD12 1.757 0.016 Potassium channel tetram. dom. cont. 12 Potassium ion transport 7164.1.S1_at LOC421110 1.724 0.025 Similar to DNA replication initiator protein DNA replication initiation
5235.1.S1_at HYOU1 1.695* 0.005 Hypoxia upregulated 1 Response to hypoxia
Affx.5663.1.S1_at SMAD7 1.684 0.022 SMAD family member 7 Signalling
8338.1.S1_at NIP7 1.667* 0.047 Nuclear import 7 homologue Ribosome assembly
Affx.21723.1.S1_at GPSM1 1.645 0.001 G-protein signalling modulator 1 Cell differentiation
Fusarium mycotoxin-contaminated wheat alters the gene expression of broilers 283 https:/www.cambridge.org/core/terms . https://doi.org/10.1017/S1751731111001601 Downloaded from https:/www.cambridge.org/core
. University of Basel Library
, on
30 May 2017 at 18:03:39
Table 4 Continued
Systematic name Name Fc P Description Function
Affx.4506.2.S1_s_at RAB3IL1 1.634 0.014 RAB3A interacting protein (rabin3)-like 1 Guanylnucleotide exchange factor
7843.1.S1_at SYPL1 1.626* 0.016 synaptophysin-like 1 Transport
13290.1.S1_at RNFT1 1.582* 0.002 Ring finger protein, transmembrane 1 Metal ion binding
11918.1.S1_at NSUN3 1.582 0.009 NOL1/NOP2/Sun domain family 3 Transferase activity
Affx.12146.1.S1_at SNRPA1 1.558 0.033 Small nuclear ribonucleoprotein A RNA splicing
Affx.13032.1.S1_s_at KIF23 1.550 0.014 Kinesin family member 23 Mitotic spindle elongation
6206.1.S1_s_at CHMP6 1.536 0.028 Chromatin modifying protein 6 Protein transport
Affx.12982.1.S1_s_at COPB1 1.536* 0.027 Coatomer protein complex, subunit b 1 Vesicle-mediated transport Affx.8553.1.S1_s_at PBX4 1.524 0.042 Pre-B-cell leukaemia homeobox 4 Transcription regulation
Affx.13133.1.S1_s_at BPGM 1.520 0.038 2,3-bisphosphoglycerate mutase Glycolysis
Affx.23087.1.S1_at NUBPL 1.515 0.037 Nucleotide binding protein-like Chromosome partitioning
8478.1.S1_s_at OTOA 1.513* 0.029 Otoancorin Transport
7249.1.S1_a_at CDT1 1.473 0.024 Chromatin licensing/DNA replication 1 Reg. of DNA replication initiation
Affx.20694.1.S1_s_at ORMDL1 1.468* 0.013 ORM1-like 1 Protein folding
2136.3.S1_at RHOU 1.437 0.017 Ras homologue gene family, member U Signal transduction
4314.1.S1_at P50 1.435 0.018 Dynamitin Microtubule-based process
8862.1.S1_s_at CHAF1B 1.435 0.033 Chromatin assembly factor 1, subunit B DNA replication Affx.23168.1.S1_at ALDH6A1 1.429* 0.042 Aldehyde dehydrogenase 6 family A1 Propanoate metabolism 1737.1.S1_at SLC27A4 1.427* 0.027 Solute carrier family 27, member 4 Fatty acid transporter
6330.3.A1_at RNF7 1.425 0.030 Ring finger protein 7 Ubiquitin cycle Apoptosis
4774.1.S1_at LOC422278 1.422* 0.027 Nonhistone chrom. protein HMG-14A DNA binding
229.1.S1_at HINT1 1.414* 0.025 histidine triad nucleotide binding protein 1 Signal transduction 5209.1.S2_at ADPRT 1.410* 0.005 Poly (ADP-ribose) polymerase family 1 Base excision repair
840.2.S1_a_at P08296 1.406 0.003 Myosin alkali light chain mRNA Motor activity
Affx.22246.1.S1_at MPG 1.406 0.031 N-methylpurine-DNA glycosylase DNA repair
Affx.12559.1.S1_s_at SLC10A7 1.399 0.030 Solute carrier family 10, member 7 Sodium/bile acid cotransporter
Affx.21403.1.S1_s_at EME1 1.366 0.048 Essential meiotic endonuclease 1 DNA repair
2794.1.S1_at EP300 1.321* 0.029 E1A binding protein p300 Signal transduction
3310.1.S1_at XPAC 1.279* 0.046 Xeroderma pigmentosum, compl. A Nucleotide-excision repair
Affx.2936.1.S1_at SLC7A10 1.263 0.031 Solute carrier family 7, member 10 Neutral amino acid transporter 7684.1.S1_at MRPL46 1.256* 0.029 Mitochondrial ribosomal protein L46 Ribosomal protein
5561.1.S1_at RIF1 1.235 0.001 RAP1 interacting factor homologue Response DNA damage stimulus
Upregulated in DON 2.5
554.1.S1_at HGF 2.105 0.003 Hepatocyte growth factor Growth factor activity
7604.2.S1_a_at PLSCR1 1.812 0.012 Phospholipid scramblase 1 Phospholipid scrambling
5517.1.S1_s_at LOC421267 1.799 0.031 Similar to nuclear DNA-binding protein Apoptosis inducing Affx.24639.1.S1_at FILIP1L 1.762 0.035 Filamin A interacting protein 1-like Cell proliferation
3674.1.S1_at STK39 1.650 0.001 Serine threonine kinase 39 Response to cellular stress
6223.1.S1_at ADAM33 1.621 0.014 ADAM metallopeptidase domain 33 Proteolysis
Affx.3622.2.S1_s_at ABCG2 1.600* 0.031 ATP-binding cassette, sub-family G 2 Response to drug biomarker Affx.7445.2.S1_s_at CSTF3 1.560 0.029 Cleavage stimulation factor, 30pre-RNA 3 mRNA processing
Dietrich, Neuenschw ander , Bucher and W enk 284 https:/www.cambridge.org/core/terms . https://doi.org/10.1017/S1751731111001601 Downloaded from https:/www.cambridge.org/core
. University of Basel Library
, on
30 May 2017 at 18:03:39
moderately high concentration levels of DON can even have growth-promoting effects. Further, the increased s.e. in BW of group DON5 indicates that different sensitivity towards DON-contaminated feed might exist, depending on the genetic background of the animals.
Nutrient transport
The gene expression analysis has shown that the nutrient uptake into the cell seems to be influenced by the mycotoxin-contaminated feed. The passiveD-fructose transporter with a
very low glucose affinity, SLC2A5 (fc: 21.259, DON2.5), had a decreased expression in the liver (fc: 21.54, DON2.5) and the jejunum (fc: 21.94, DON2.5/5). The numerical decrease in AME by 5.9% might be a further indication of a reduced monosaccharide uptake in the jejunum. Maresca et al. (2002) showed in their study that fructose uptake into the cell and corresponding transporter SLC2A5 were inhibited by 42% in the intestinal cell line HT-29-D4 cells because of DON administration. Our findings indicate that similar effects occur in the jejunum of broilers in the living animal, and to a lesser extent in the liver. The gene SLC27A4 (fc: 11.427, DON5) is a palmitate transporter and the increased expres-sion could not be confirmed with qPCR in the liver. However, the expression was significantly reduced in the jejunum (fc: 21.87, DON5). In primary enterocytes treated with SLC27A4 antisense, palmitate and oleate uptake were reduced simultaneously (Stahl et al., 1999). Maresca et al. (2002) reported an increased palmitate uptake by 35% in their study after challenging HT-29-D4 cells with DON. We assume that chronic exposure to DON can invert the regulation or that another functional mechanism on the transport activity is responsible for the discrepancy between the decreased expression ofSLC27A4in the jejunum and the increased palmitate uptake reported by Maresca et al. (2002). The SLC7A10 protein (fc: 11.26, DON5) transports
D-serine, glycine andL-isomers of alanine, serine, threonine
and cysteine (Nakauchiet al., 2000). The expression change was confirmed with qPCR in the liver (fc: 11.49, DON5) and the jejunum (fc: 12.52, DON5). Further, the N retention was numerically reduced by 9%, which gives an indication on the amino acid uptake. The decrease inL-serine uptake in the cell
culture study by Marescaet al. (2002) is in disagreement with our observation that SLC7A10 showed an upregulated expression, but is in agreement with the reduced N retention in group DON5. The discrepancy could indicate a direct inhibition of thisL-serine transporter by DON, resulting in the
upregula-tion of SLC7A10. SLC7A5 (fc: 21.218, DON5) is a transporter of neutral amino acids with branched or aromatic side chains such as leucine (Kanaiet al., 1998). In an incorporation study with mice, the 14C leucine incorporation into the liver was decreased at 20 mg DON/kg feed. It was assumed that DON inhibited the protein synthesis, and therefore the reduction of the 14C leucine amount occurred (Robbana-Barnat et al., 1987). The addition of 0.5 and 5 mg DON/ml to Caco-2 cells led to a decreased [3H] leucine incorporation and a parallel decrease of cellular protein content (De Walleet al., 2010). The extent to which leucine uptake into the cell is responsible for
Table 4 Continued Systematic name Name Fc P Description Function 16921.1.S1_at Tcp11 1.558* 0.042 t-complex 11 (mouse)-lik e 2 Multicellular organismal develp . 2439.1.S1_at TMED10 1.511* 0.018 Transmembrane emp24-lik e trafficking10 V esicle-mediated transport Affx.26112.1.S1_at FUCA1 1.511 0.016 Fucosidase , alpha-L-1 N-Glycan degradation Affx.6854.2.S1_s_at C8A 1.431* 0.016 Complement component 8, alpha Complement activ ation Affx.5975.1.S1_at RAD51L1 1.395 0.028 RAD51-lik e 1 (Saccharomyces cerevisiae ) DNA repair DON 5 deoxyn iv alenol; Fc 5 fold change of groups DON1, DON 2.5 and DON 5; P 5 P -v alue of Stude nt’ s t -test. Th e systematic name of the prob e sets in chick en is the sp ecies code Gga., follow ed by the identifie r (e .g. GgaAffx.59 75.1.S 1_at or Gga .2439.1 .S1_at) . *Raw value abo ve 80th percentile .
Fusariummycotoxin-contaminated wheat alters the gene expression of broilers
285
https:/www.cambridge.org/core/terms. https://doi.org/10.1017/S1751731111001601
the decrease of the protein synthesis remains unclear. In a related, unpublished study, SLC16A1 expression was significantly altered, and therefore the test was also used to verify the expression in the jejunum in this study. SLC16A1 (fc: 21.87, DON5) had a decreased expression in the jejunum, and it transports monocarboxylates such as butyrate, lactate and pyruvate (Lambertet al., 2002). It has been suggested that effects of DON on membrane transport is a result of specific modulation of the transporters and is not due to cell damage (Marescaet al., 2002), which is supported by our observations, especially becauseSLC7A10was upregulated. The alteration
of these five gene expression levels influences the nutrient uptake into the cell and might have implications for the growth rate of birds.
Detoxification
AKR1B1(fc: 23.511, DON2.5 and 5) had a decreased expres-sion in the liver, measured with microarray and qPCR experi-ments (fc: 22.5, DON2.5 and 5), as well as in the jejunum (fc: 22.49, DON5). AKR1B1 reduces reactive aldehydes and ketones to primary and secondary alcohols. Reactive oxygen species also target polyunsaturated fatty acids that form lipid
Table 5Downregulated genes in DON groups
Systematic name Name Fc P Description Function
Downregulated in DON 1, DON 2.5 and DON 5
19878.1.S1_at ARID1A 1.7, 1.7, 1.6 0.006 AT rich interactive domain 1A Andro./estrogen receptor signalling 14829.1.S1_at Mlh3 1.2, 1.3, 1.2 0.006 Sim. to DNA repair protein Mlh3 DNA repair
Downregulated in DON 2.5 and DON 5
Affx.26.1.S1_at LOC427047 1.6, 2.1 0.021 Sim. to breast cancer-associated antigen 1 Transcription regulation Affx.12182.1.S1_at ODF2 2.0, 1.7 0.01 Outer dense fibre of sperm tails 2 Cell differentiation Affx.5339.1.S1_at EXOC4 1.9, 1.7 0.005 Exocyst complex component 4 Protein transport Affx.25933.3.S1_s_at PITPNC1 1.7, 1.6 0.006 Phosphatidylinositol transfer protein 1 Lipid transport 15747.2.S1_s_at APRIN 1.6, 1.5 0.017 Androgen-induced proliferation inhibitor Cell cycle Downregulated in DON 1 and DON 2.5
6220.5.S1_a_at ICER 1.6, 2.0 0.006 ICER protein Transcription regulation Affx.25502.2.S1_at SLC2A5 1.6, 1.3* 0.004 Solute carrier family 2, member 5 Glucose/fructose transport Downregulated in DON 5
9580.2.S1_a_at AKR1B1 3.948* 0.047 Aldo-keto reductase family 1, member B1 Response to stress 12430.1.S1_at MIA2 2.544 0.013 Melanoma inhibitory activity 2 Inflammation
Affx.6850.1.S1_at BTBD7 1.769 0.001 BTB (POZ) domain containing 7 Related to tumourigenesis 14891.1.S1_s_at RBBP6 1.651 0.039 Retinoblastoma binding protein 6 Protein ubiquitination 9934.1.S1_s_at ANKRD13A 1.631 0.037 Ankyrin repeat domain 13A Probably DNA damage related 13135.2.S1_a_at ZCRB1 1.586 0.023 Zinc finger CCHC-type, RNA binding 1 RNA splicing
9603.1.S1_s_at USP8 1.529 0.021 Ubiquitin specific peptidase 8 Cell proliferation 12626.2.S1_s_at HCFC2 1.524 0.003 Host cell factor C2 Transcription regulation Affx.26072.2.S1_s_at TJP1 1.52 0.025 Tight junction protein 1 (zona occludens 1) Intercellular junction assembly 3068.1.S1_at Trap150 1.511* 0.028 Sim. to thyroid hormone receptor-associ. Androgen receptor signalling Affx.20095.1.S1_at EXOSC9 1.503 0.010 Exosome component 9 Immune response
Affx.26106.6.S1_s_at LOC428354 1.48 0.036 Sim. to Jumonji domain cont. protein 2B Transcription regulation 16149.1.S1_s_at ANKMY1 1.474 0.024 Ankyrin repeat and MYND domain 1 Protein binding
Affx.7493.1.S1_s_at LOC422658 1.473* 0.037 Sim. to UDP-glucuronosyltransferase 2A1 Detection of chemical stimulus Affx.8082.2.A1_at ELOVL2 1.472* 0.030 Elongation of very long chain fatty acid L2 Fatty acid biosynthesis Affx.21354.1.S1_at YPEL1 1.438* 0.039 Yippee-like 1 (Drosophila) Cell morphology
Affx.13221.1.S1_s_at MTPN 1.425 0.003 Myotrophin Cell growth
11668.1.S1_at NDRG1 1.395* 0.029 N-myc downstream regulated gene 1 Response to metal ion Affx.12896.1.S1_at SLC7A5 1.218 0.003 Solute carrier family 7, A5 Cationic amino acid transporter Downregulated in DON 2.5
12243.1.S1_at RWDD2B 1.891 0.023 RWD domain containing 2B Unknown 10529.1.S1_at LOC770294 1.702 0.008 Similar to RNase H, putative DNA integration
6038.1.S1_at LOC417856 1.649 0.045 Sim. to TMEM19 protein Multi-pass membrane protein 8763.1.S1_at YTHDC1 1.565 0.025 YTH domain containing 1 RNA splicing
Affx.21020.1.S1_s_at BAZ1B 1.541 0.035 Bromodomain adjacent to zinc finger 1B Chromatin remodelling Affx.13074.1.S1_at DNAJC3 1.435 0.040 DnaJ (Hsp40) homologue, sub-family C3 Defense response
10975.1.S1_s_at ARID1B 1.407 0.040 Sim. to AT rich interactive dom. 1B, 1 Chromatin-med. transcription Affx.10171.1.S1_at EIF2AK3 1.286 0.010 Eukary. Transl. initiation fact. 2-a kinase 3 Negative regulation of translation
DON 5 deoxynivalenol; Fc 5 fold change of groups DON1, DON2.5 and DON5;P5P-value of Student’st-test.
The systematic name of the probe sets in chicken is the species code Gga., followed by the identifier (e.g. GgaAffx.5975.1.S1_at or Gga.2439.1.S1_at). *Raw value above the 80th percentile.
Dietrich, Neuenschwander, Bucher and Wenk
286
https:/www.cambridge.org/core/terms. https://doi.org/10.1017/S1751731111001601
hydroperoxides, which are finally decomposed to form reactive lipid aldehydes, which are highly mutagenic. AKR1B1 detoxifies those lipid aldehydes that can react with bases in DNA to form etheno- and heptano-etheno-DNA adducts (Jin and Penning, 2007). The downregulation ofAKR1B1by chronic DON expo-sure might also be in relation to several upregulated DNA repair genes, which are discussed in the section below. In the human hepatoma-derived cell line HepG2, the expression ofAKR1B1 was significantly reduced after the cells were challenged with a series of cytotoxic substances (Kawataet al., 2007). In conclu-sion,AKR1B1seems to be an interestingin vivobiomarker for DON-induced alteration of gene expression.
DNA repair
Six genes were significantly upregulated in DON5 and one in DON2.5, which are responsible for DNA damage repair and recognition, showing a possible effect of DON on DNA integrity. The six genes correspond to 4.1% of significantly altered genes, with a known function, in group DON5. The protein is involved in DNA repair and has a critical role in signalling DNA single-strand breaks (Plummer and Calvert, 2007). Shifrin and Anderson (1999) showed that the addition of DON to the Jurkat human lymphoid cell line led to the activation of pro-caspase-3, leading to a higher cleavage of PARP1, a substrate of caspase-3. In murine macrophages, J774A.1, an increased amount of PARP1 and significantly
increased amount of cleaved PARP1 protein resulted after the challenge with DON (Marzoccoet al., 2009). The upregulation of PARP1 therefore shows that similar effects might occur in the liver of broilers. MPG (fc: 11.406, DON5) is responsible for the recognition and excision of alkylated purine bases (O’Brien and Ellenberger, 2004). EME1 (fc: 11.366, DON5) cleaves branched DNA structures. In the absence of EME1, chromosomal aberrations occurred and led to genomic instability (Abraham et al., 2003). The gene RAD51L1 (fc: 11.395, DON2.5) functions in homologous recombination and DNA double-strand break repair (Miller et al., 2002). CHAF1B (fc: 1 1.435, DON5) is part of the complex CAF-1 and the only subunit available on the Chicken Genome Array. The complex is related to nucleotide excision repair and to the repair of single-strand breaks (Mello et al., 2002). RIF1 (fc: 11.235, DON5) functions as a DNA damage response factor (Silverman et al., 2004). XPAC (fc: 11.279, DON5) is involved in nucleotide excision repair (Shimamotoet al., 1995). In male broiler chickens fed with 10 mg DON/kg feed, a comet assay was performed in spleen leukocytes, which detected aberrations, and a significantly higher amount of DNA breaks were found (Frankic et al., 2006). Interestingly, all the DNA repair-related genes mentioned above were only upregulated in group DON5 with the exception of RAD51L1, which was upregulated in DON2.5. Genes such asPARP1,MPG,EME1, XPACandCHAF1Bbelong either to the base excision repair or to the nucleotide excision repair pathway. Under reduced activity of AKR1B1, the anchorage of lipid aldehydes to the DNA might have occurred with a higher frequency, and therefore the discussed single-strand repair genes might have shown a higher expression in the group DON5. A single-strand break or modified nucleotides do not lead necessarily to double-strand breaks or, as a result, to detection in the comet assay. Continuing, it seems that the activation of DNA damage-related genes is induced only by a concentration of 4.42 mg DON/kg feed.
Translation initiation
The expression decrease ofEIF2AK3(fc: 21.286, DON2.5/5) could be confirmed in the liver with qPCR (fc: 21.70). EIF2AK3 is a target for transcriptional upregulation of the unfolded protein response and phosphorylates eIF2a, a translation initiator (Yanget al., 2000). The phosphorylation of eIF2a inhibits translation initiation and protein synthesis. EIF2AK3activation and the subsequent eIF2a phosphoryla-tion prevent the cell from the accumulaphosphoryla-tion of incorrectly folded or unfolded proteins (Ron, 2002).DNAJC3(fc: 21.435, DON2.5) is induced during endoplasmic reticulum (ER) stress (van Huizen et al., 2003).DNAJC3binds toEIF2AK3 and disrupts the activity of EIF2AK3. Subsequently, eIF2a phosphorylation by EIF2AK3 is reduced, stimulating the eIF2a-induced protein synthesis (Galeet al., 1998). Our results are consistent with the publication of Yanget al. (2000), which showed reduced expression level of DNAJC3 after 24 h in murine thymoma cell line EL-4 treated with DON. The bind-ing of DON to the 60 S ribosomal subunit and the sub-sequent translation inhibition might be counterbalanced by
Samples
367 up-regulated
genes
Control DON1 DON2.5 DON5
199 down-regulated
genes
Figure 1 Heatmap of cluster analysis. Heatmap: green, upregulated genes; black, normal expression; red, down-regulated genes. The regulation is displayed according to significant alterations between control group and DON-containing groups. Each horizontal line corresponds to a normalised expression of a gene from the respective sample.
Fusariummycotoxin-contaminated wheat alters the gene expression of broilers
287
https:/www.cambridge.org/core/terms. https://doi.org/10.1017/S1751731111001601
the downregulation ofEIF2AK3andDNAJC3. Pestka (2010) assumed thatEIF2AK3might have an important role in the signalling after the challenge with DON, because of influenced up- and downstream signal transducers. The downregulation ofEIF2AK3in our experiment confirms this assumption. The ribotoxic stress response seems to have some pathway ele-ments similar to the ER stress response, but with inverse gene expression regulation.
Stabilisation of mRNA
The expression change ofEXOSC9(fc: 21.503, DON5) was confirmed with qPCR (fc: 21.61) in the liver. EXOSC9 is a subunit of the exosome, a 30–50 exoribonuclease complex.
This complex processes ribosomal and small nuclear RNAs and degrades mRNAs. In HeLa extracts, the addition of RNA containing an adenylate/uridylate-rich element (ARE) increased their 30–50 exonucleolytic decay rate. The inactivation of
EXOSC9 highly decreased the efficiency of the exonucleolytic decay, showing the central role of EXOSC9 in mRNA decay (Mukherjeeet al., 2002). In human HEp-2 cells, it has been shown that the knockdown of EXOSC9 led to a twofold increase inb-globulincontaining an ARE (van Dijket al., 2007). The 50–30 exoribonuclease XRN1 (fc: 21.796, DON5) was
numerically downregulated in the microarray experiment and significantly downregulated in qPCR experiment (fc: 21.25) in the liver. XRN1 is a component of the alternative 50–30mRNA
decay pathway (Schilders et al., 2006). The knockdown of XRN1 led to a 3.5-fold increase ofthe b-globulin-AREmRNA.
Therefore, EXOSC9 and XRN1 seem to be involved in the turnover of ARE-containing transcripts (van Dijket al., 2007). In his review, Pestka (2008) summarised the genes with a lower mRNA decay rate upon DON administration, which areCOX-2, tumour necrosis factor (TNF)-a and interleukin (IL)-6in macro-phages andIL-2in EL-4T-cells. It has been reported that all four mRNAs are stabilised by ARE in the 30 untranslated region
(Chen et al., 2001, Paschoud et al., 2006, Rajasingh et al., 2006). The downregulation ofEXOSC9andXRN1might be the reason for increased mRNA stability of several ARE-containing genes in DON-challenged cell cultures. Further, the reduced mRNA depletion, due toXRN1andEXOSC9downregulation, might have also led to higher mRNA levels in general. In the final gene list (supplementary files), a disequilibrium exists with 367 upregulated genes and 199 downregulated genes. The possible higher mRNA amount might compensate for the pos-sibly reduced translation, due to binding to the 60 S ribosomal subunit by DON. EXOSC9 andXRN1 seem to be interesting biomarkers for mRNA stabilisation and the decay rate of ARE-containing mRNA.
Tight junctions
Cells are connected by intercellular complexes such as tight junctions and adherens junctions. In Caco-2 cells, it has been shown that the transepithelial electrical resistance (TEER) decreased to 30% after 24 h of DON incubation at a concentration of 2 mg/ml. It was mentioned that TEER reflects the functional tight junctions made of transmembrane proteins
Table 6RT qPCR results
Liver Jejunum
Microarray Don 2.5 Don 5 Don 2.5 Don 5
Gene name Fc Fc P Fc P Fc P Fc P AKR1B11 23.511 22.08 ** 22.50 * 21.36 NS 22.49 *** LAPTM4B 13.058 11.23 NS 11.77 * 11.31 * 21.05 NS EIF2AK3 21.286 21.64 * 21.70 * 21.18 NS 21.34 NS MIA2 22.544 21.54 * 21.65 * 21.14 NS 21.35 * EXOSC9 21.503 11.36 NS 21.61 * 11.14 NS 21.24 NS TJP1 21.520 11.66 NS 21.66 * 11.15 NS 21.24 NS XRN1 NS (P , 0.08) 11.03 NS 21.25 * 21.02 NS 21.14 * SLC7A10 11.263 21.42 NS 11.49 * 21.76 NS 12.52 * SLC2A51 21.259 21.54 ** 21.05 NS 21.72 ** 21.94 ** SLC16A1 NS 21.11 NS 21.10 NS 21.37 * 21.47 * SLC27A4 11.424 21.43 NS 21.18 NS 21.68 NS 21.87 * IFT57 11.953 11.78 ** 11.33 NS 11.38 NS 11.41 NS CASP1 12.198 21.13 NS 11.04 NS 21.43 ** 21.39 ** EP3001 11.321 21.26 NS 21.60 NS 21.52 *** 21.17 NS MAPKAPK3 11.299 21.32 NS 21.28 NS 21.15 NS 21.15 NS STK39 11.650 21.03 NS 21.53 NS 21.22 NS 21.01 NS TP53I3 12.646 21.07 NS 11.06 NS 11.20 NS 21.14 NS
RT 5reverse transcription; DON 5 deoxynivalenol; Fc 5 fold change;P5P-value of Student’st-test.
n55 animals per treatment group.
Fc andPwere measured between control and the corresponding DON-containing group. 1Raw value above 80th percentile.
*P,0.05; **P,0.01; ***P,0.001.
Dietrich, Neuenschwander, Bucher and Wenk
288
https:/www.cambridge.org/core/terms. https://doi.org/10.1017/S1751731111001601
(Sergentet al., 2006). Among the proteins mentioned was TJP1 (fc: 21.52, DON5), which was downregulated in our experi-ment in the liver, which was also measured with qPCR (fc: 21.66). In porcine intestinal epithelial cells (IPEC-1) and -J2 cells, the treatment with 2 mg DON/ml led to disintegrated TJP1 structure and the total amount of TJP1 moderately decreased, which was measured with the Western blot analysis (Diesing et al., 2011). It was reported that TJP1 interacts with CLDN3 (fc: 11.637, DON1/5; Harhaj and Antonetti, 2004). Pintonet al. (2009) have shown a decreased CLDN3 protein amount in IPEC-1 after the treatment with DON for 48 h with a parallel decrease of TEER. Therefore, the upregulation ofCLDN3might counterbalance the reduction caused by DON over a feedback mechanism. The decrease of TEER shows the acute effects in cell cultures. The extent to which the chronic administration of DON leads to the same effects has not been reported. The significant expression change of TJP1 and CLDN3 indicates that similar effects, such as the decreased TEER in cell cultures, might also occur in the liver of living animals.
Immune-related genes
The expression of MIA2 (fc: 22.544, DON5) was sig-nificantly decreased, measured with qPCR in the liver (fc: 21.70) and the jejunum (fc: 21.35).MIA2expression is regulated by IL-6 and transforming growth factor-beta, which increased the expression level of MIA2 in human hepatocytes and in HepG2 cells (Bosserhoffet al., 2003). The downregulation ofMIA2 in the liver and the jejunum may indicate a reduced amount of IL-6 in the liver cells of broilers. In murine macrophages, it has been shown that IL1RL1 (fc: 11.661, DON2.5/5) exerted anti-inflammatory effects by the negative regulation of the IL-6 production (Takezakoet al., 2006), which affirmed the previous results with the decreased MIA2 expression. In vitro experiments with the addition of DON exhibited that the half-life of the ARE-containing IL-6 and TNF-a mRNA and the amount of the respective proteins were increased within 24 h (Wong et al., 2001). IL-6 seems to be critical for the regulation of immunoglobulin (Ig)A. In broilers fed with 7 to 9.2 mg DON/kg feed, the biliary IgA concentration was decreased (Swamy et al., 2002). Azcona-Oliveraet al. (1995) showed an increased expression ofIL-1b, IL-6andTNF-amRNA in mice exposed to a 25 mg DON/kg diet. Four hours after the administration of DON, the cytokines were again only slightly upregulated in the liver (Azcona-Oliveraet al., 1995). This may also explain the findings that IL-1b,IL-6andTNF-amRNA were unchanged in our experi-ment. IL1RL1 might be an antagonist to DON by stabilising IL-6 and TNF-a levels. Especially in long-term administration of DON, the normalisation of the mRNA and cytokine levels might be economical. The upregulation of pro- and anti-inflammatory factors may influence the sensitivity of the immune system and act as immune stimulators.LAPTM4B(13.058, DON1/5) expres-sion increase could be confirmed in the liver (fc: 11.77, DON5) and the jejunum (fc: 11.31, DON2.5). LAPTM4B is a tetra-transmembrane glycoprotein localised on endosomes and lysosomes (Liuet al., 2009). LAPTM4B was also upre-gulated in the early phase of liver regeneration in rats
(Xu et al., 2005). Therefore, LAPTM4B might be used as a biomarker for liver regeneration.
Conclusion
We could confirm several results in the living animal from previous studies, which were performed mainly in cell cul-tures. The main effects with economic impact might be the altered expression of the solute carrier transcripts, which transportD-glucose/D-fructose, palmitic acid, monocarboxylates, L-serine, leucine and other amino acids. Further, the translation
initiation-related genes EIF2AK3andDNAJC3, as well as the mRNA stabilisation genes, could have an important influence on the protein synthesis rate and on the growth of broilers. The upregulation of DNA repair proteins indicates possible muta-genic effects of DON or its decomposition products. The detoxification enzyme AKR1B1 is an indicator that, at 2.21 mg DON/kg feed, the concentration might be high enough to show cytotoxic effects. The verification of the results in the jejunum from the microarray and the qPCR analysis in the liver increases the reliability of the DON-regulated genes. In general, effects on the level of RNA expression cannot be directly transposed from one organ to the other. Therefore, the parallel alterations in the liver and the jejunum might indicate a general functional mechanism of DON on the different relative amounts of tran-scripts. The maximum-allowed DON contamination in poultry feed in the European Union (2006) is 5 mg DON/kg feed. Significantly altered gene expression was observed at a con-centration of 2.21 mg DON/kg feed.
Acknowledgements
The authors thank Dr Ruth Messikommer, Dr Christine Zuberbu¨hler, Dr Peter Spring, Dr Hannes Jo¨rg, Prof. Peter Vo¨geli, Rolf Bickel, Birgit Prause, Monika Haubitz and Urs Schuler for their expert assistance in the animal experiment, and to Claude Chaubert for the help with the mycotoxin analysis. The authors also thank Dr Ulrich Wagner and Andrea Patrignani from the Functional Genomics Center, Zurich for their invaluable help with the microarray experiments and bioinformatics. This study was funded by Alltech Inc., Nicholasville, KY, USA.
References
Abraham J, Lemmers B, Hande MP, Moynahan ME, Chahwan C, Ciccia A, Essers J, Hanada K, Chahwan R, Khaw AK, McPherson P, Shehabeldin A, Laister R, Arrowsmith C, Kanaar R, West SC, Jasin M and Hakem R 2003. Eme1 is involved in DNA damage processing and maintenance of genomic stability in mammalian cells. EMBO Journal 22, 6137–6147.
Aeschbacher K, Messikommer R, Meile L and Wenk C 2005. Bt176 corn in poultry nutrition: physiological characteristics and fate of recombinant plant DNA in chickens. Poultry Science 84, 385–394.
Awad WA, Bohm J, Razzazi-Fazeli E, Hulan HW and Zentek J 2004. Effects of deoxynivalenol on general performance and electrophysiological properties of intestinal mucosa of broiler chickens. Poultry Science 83, 1964–1972. Awad WA, Ghareeb K, Bohm J, Razzazi E, Hellweg P and Zentek J 2008. The impact of the Fusarium toxin deoxynivalenol (DON) on poultry. International Journal of Poultry Science 7, 827–842.
Azcona-Olivera JI, Ouyang Y, Murtha J, Chu FS and Pestka JJ 1995. Induction of cytokine mRNAs in mice after oral exposure to the trichothecene vomitoxin Fusariummycotoxin-contaminated wheat alters the gene expression of broilers
289
https:/www.cambridge.org/core/terms. https://doi.org/10.1017/S1751731111001601
(deoxynivalenol): relationship to toxin distribution and protein synthesis inhibition. Toxicology and Applied Pharmacology 133, 109–120.
Bondy GS and Pestka JJ 2000. Immunomodulation by fungal toxins. Journal of Toxicology and Environmental Health, Part B: Critical Reviews 3, 109–143. Bosserhoff AK, Moser M, Scholmerich J, Buettner R and Hellerbrand C 2003. Specific expression and regulation of the new melanoma inhibitory activity-related gene MIA2 in hepatocytes. Journal of Biological Chemistry 278, 15225–15231.
Chen CY, Gherzi R, Ong SE, Chan EL, Raijmakers R, Pruijn GJ, Stoecklin G, Moroni C, Mann M and Karin M 2001. AU binding proteins recruit the exosome to degrade ARE-containing mRNAs. Cell 107, 451–464.
De Walle JV, Sergent T, Piront N, Toussaint O, Schneider YJ and Larondelle Y 2010. Deoxynivalenol affects in vitro intestinal epithelial cell barrier integrity through inhibition of protein synthesis. Toxicology and Applied Pharmacology 245, 291–298.
Diesing AK, Nossol C, Panther P, Walk N, Post A, Kluess J, Kreutzmann P, Danicke S, Rothkotter HJ and Kahlert S 2011. Mycotoxin deoxynivalenol (DON) mediates biphasic cellular response in intestinal porcine epithelial cell lines IPEC-1 and IPEC-J2. Toxicology Letters 200, 8–18.
EFSA 2004. Opinion of the Scientific Panel on Contaminants in the Food Chain on a request from the Commission related to Deoxynivalenol as undesirable substance in animal feed. The EFSA Journal 89, 1–35.
European Union 2006. 2006/576/EC: Commission Recommendation of 17 August 2006 on the presence of deoxynivalenol, zearalenone, ochratoxin A, T-2 and HT-2 and fumonisins in products intended for animal feeding. Official Journal – European Union Legislation 49, 7–9.
Frankic T, Pajk T, Rezar V, Levart A and Salobir J 2006. The role of dietary nucleotides in reduction of DNA damage induced by T-2 toxin and deoxynivalenol in chicken leukocytes. Food and Chemical Toxicology 44, 1838–1844.
Gale M Jr, Blakely CM, Hopkins DA, Melville MW, Wambach M, Romano PR and Katze MG 1998. Regulation of interferon-induced protein kinase PKR: modulation of P58IPK inhibitory function by a novel protein, P52rIPK. Molecular and Cellular Biology 18, 859–871.
Harhaj NS and Antonetti DA 2004. Regulation of tight junctions and loss of barrier function in pathophysiology. International Journal of Biochemistry & Cell Biology 36, 1206–1237.
Jin Y and Penning TM 2007. Aldo-keto reductases and bioactivation/ detoxication. Annual Review of Pharmacology and Toxicology 47, 263–292. Kanai Y, Segawa H, Miyamoto K, Uchino H, Takeda E and Endou H 1998. Expression cloning and characterization of a transporter for large neutral amino acids activated by the heavy chain of 4F2 antigen (CD98). Journal of Biological Chemistry 273, 23629–23632.
Kawata K, Yokoo H, Shimazaki R and Okabe S 2007. Classification of heavy-metal toxicity by human DNA microarray analysis. Environmental Science and Technology 41, 3769–3774.
Lambert DW, Wood IS, Ellis A and Shirazi-Beechey SP 2002. Molecular changes in the expression of human colonic nutrient transporters during the transition from normality to malignancy. British Journal of Cancer 86, 1262–1269. Liu X, Xiong F, Wei X, Yang H and Zhou R 2009. LAPTM4B-35, a novel tetratransmembrane protein and its PPRP motif play critical roles in proliferation and metastatic potential of hepatocellular carcinoma cells. Cancer 100, 2335–2340.
Lun AK, Moran ET Jr, Young LG and McMillan EG 1989. Absorption and elimination of an oral dose of 3H-deoxynivalenol in colostomized and intact chickens. Bulletin of Environmental Contamination and Toxicology 42, 919–925.
Maresca M, Mahfoud R, Garmy N and Fantini J 2002. The mycotoxin deoxynivalenol affects nutrient absorption in human intestinal epithelial cells. Journal of Nutrition 132, 2723–2731.
Marzocco S, Russo R, Bianco G, Autore G and Severino L 2009. Pro-apoptotic effects of nivalenol and deoxynivalenol trichothecenes in J774A.1 murine macrophages. Toxicology Letters 189, 21–26.
Mello JA, Sillje HH, Roche DM, Kirschner DB, Nigg EA and Almouzni G 2002. Human Asf1 and CAF-1 interact and synergize in a repair-coupled nucleosome assembly pathway. EMBO Reports 3, 329–334.
Miller KA, Yoshikawa DM, McConnell IR, Clark R, Schild D and Albala JS 2002. RAD51C interacts with RAD51B and is central to a larger protein complex in vivo exclusive of RAD51. Journal of Biological Chemistry 277, 8406–8411.
Mukherjee D, Gao M, O’Connor JP, Raijmakers R, Pruijn G, Lutz CS and Wilusz J 2002. The mammalian exosome mediates the efficient degradation of mRNAs that contain AU-rich elements. EMBO Journal 21, 165–174.
Nakauchi J, Matsuo H, Kim DK, Goto A, Chairoungdua A, Cha SH, Inatomi J, Shiokawa Y, Yamaguchi K, Saito I, Endou H and Kanai Y 2000. Cloning and characterization of a human brain Na(1)-independent transporter for small neutral amino acids that transports D-serine with high affinity. Neuroscience Letters 287, 231–235.
National Research Council 1994. Nutrient requirements of poultry. National Academy Press, Washington, DC.
O’Brien PJ and Ellenberger T 2004. Dissecting the broad substrate specificity of human 3-methyladenine-DNA glycosylase. Journal of Biological Chemistry 279, 9750–9757.
Paschoud S, Dogar AM, Kuntz C, Grisoni-Neupert B, Richman L and Kuhn LC 2006. Destabilization of interleukin-6 mRNA requires a putative RNA stem-loop structure, an AU-rich element, and the RNA-binding protein AUF1. Molecular and Cellular Biology 26, 8228–8241.
Pepper SD, Saunders EK, Edwards LE, Wilson CL and Miller CJ 2007. The utility of MAS5 expression summary and detection call algorithms. BMC Bioinformatics 8, 273.
Pestka JJ 2007. Deoxynivalenol: toxicity, mechanisms and animal health risks. Animal Feed Science and Technology 137, 283–298.
Pestka JJ 2008. Mechanisms of deoxynivalenol-induced gene expression and apoptosis. Food Additives and Contaminants, 1–13.
Pestka JJ 2010. Deoxynivalenol: mechanisms of action, human exposure, and toxicological relevance. Archives of Toxicology 84, 663–679.
Pinton P, Nougayrede JP, Del Rio JC, Moreno C, Marin DE, Ferrier L, Bracarense AP, Kolf-Clauw M and Oswald IP 2009. The food contaminant deoxynivalenol, decreases intestinal barrier permeability and reduces claudin expression. Toxicology and Applied Pharmacology 237, 41–48.
Plummer ER and Calvert H 2007. Targeting poly(ADP-ribose) polymerase: a two-armed strategy for cancer therapy. Clinical Cancer Research 13, 6252–6256.
Prelusky DB, Gerdes RG, Underhill KL, Rotter BA, Jui PY and Trenholm HL 1994. Effects of low-level dietary deoxynivalenol on haematological and clinical parameters of the pig. Natural Toxins 2, 97–104.
Rajasingh J, Bord E, Luedemann C, Asai J, Hamada H, Thorne T, Qin G, Goukassian D, Zhu Y, Losordo DW and Kishore R 2006. IL-10-induced TNF-alpha mRNA destabilization is mediated via IL-10 suppression of p38 MAP kinase activation and inhibition of HuR expression. FASEB Journal 20, 2112–2114.
Robbana-Barnat S, Loridon-Rosa B, Cohen H, Lafarge-Frayssinet C, Neish GA and Frayssinet C 1987. Protein synthesis inhibition and cardiac lesions associated with deoxynivalenol ingestion in mice. Food Additives and Contaminants 4, 49–56.
Ron D 2002. Translational control in the endoplasmic reticulum stress response. Journal of Clinical Investigation 110, 1383–1388.
Rotter BA, Prelusky DB and Pestka JJ 1996. Toxicology of deoxynivalenol (vomitoxin). Journal of Toxicology and Environmental Health 48, 1–34. Schilders G, van Dijk E, Raijmakers R and Pruijn GJ 2006. Cell and molecular biology of the exosome: how to make or break an RNA. International Review of Cytology 251, 159–208.
Scott TA and Hall JW 1998. Using acid insoluble ash marker ratios (diet : digesta) to predict digestibility of wheat and barley metabolizable energy and nitrogen retention in broiler chicks. Poultry Science 77, 674–679.
Sergent T, Parys M, Garsou S, Pussemier L, Schneider YJ and Larondelle Y 2006. Deoxynivalenol transport across human intestinal Caco-2 cells and its effects on cellular metabolism at realistic intestinal concentrations. Toxicology Letters 164, 167–176.
Shifrin VI and Anderson P 1999. Trichothecene mycotoxins trigger a ribotoxic stress response that activates c-Jun N-terminal kinase and p38 mitogen-activated protein kinase and induces apoptosis. Journal of Biological Chemistry 274, 13985–13992.
Shimamoto T, Tanimura T, Yoneda Y, Kobayakawa Y, Sugasawa K, Hanaoka F, Oka M, Okada Y, Tanaka K and Kohno K 1995. Expression and functional analyses of the Dxpa gene, the Drosophila homolog of the human excision repair gene XPA. Journal of Biological Chemistry 270, 22452–22459.
Dietrich, Neuenschwander, Bucher and Wenk
290
https:/www.cambridge.org/core/terms. https://doi.org/10.1017/S1751731111001601
Silverman J, Takai H, Buonomo SB, Eisenhaber F and de Lange T 2004. Human Rif1, ortholog of a yeast telomeric protein, is regulated by ATM and 53BP1 and functions in the S-phase checkpoint. Genes and Development 18, 2108–2119. Stahl A, Hirsch DJ, Gimeno RE, Punreddy S, Ge P, Watson N, Patel S, Kotler M, Raimondi A, Tartaglia LA and Lodish HF 1999. Identification of the major intestinal fatty acid transport protein. Molecular Cell 4, 299–308.
Swamy HV, Smith TK, Karrow NA and Boermans HJ 2004. Effects of feeding blends of grains naturally contaminated with Fusarium mycotoxins on growth and immunological parameters of broiler chickens. Poultry Science 83, 533–543. Swamy HV, Smith TK, Cotter PF, Boermans HJ and Sefton AE 2002. Effects of feeding blends of grains naturally contaminated with Fusarium mycotoxins on production and metabolism in broilers. Poultry Science 81, 966–975. Takezako N, Hayakawa M, Hayakawa H, Aoki S, Yanagisawa K, Endo H and Tominaga S 2006. ST2 suppresses IL-6 production via the inhibition of IkappaB degradation induced by the LPS signal in THP-1 cells. Biochemical and Biophysical Research Communications 341, 425–432.
Ueno Y 1984. Toxicological features of T-2 toxin and related trichothecenes. Fundamental and Applied Toxicology 4, S124–S132.
van Dijk EL, Schilders G and Pruijn GJ 2007. Human cell growth requires a functional cytoplasmic exosome, which is involved in various mRNA decay pathways. RNA 13, 1027–1035.
van Huizen R, Martindale JL, Gorospe M and Holbrook NJ 2003. P58IPK, a novel endoplasmic reticulum stress-inducible protein and potential negative regulator of eIF2alpha signaling. Journal of Biological Chemistry 278, 15558–15564. Wong S, Schwartz RC and Pestka JJ 2001. Superinduction of TNF-alpha and IL-6 in macrophages by vomitoxin (deoxynivalenol) modulated by mRNA stabiliza-tion. Toxicology 161, 139–149.
Xu CS, Chang CF, Yuan JY, Li WQ, Han HP, Yang KJ, Zhao LF, Li YC, Zhang HY, Rahman S and Zhang JB 2005. Expressed genes in regenerating rat liver after partial hepatectomy. World Journal of Gastroenterology 11, 2932–2940. Yang GH, Li S and Pestka JJ 2000. Down-regulation of the endoplasmic reticulum chaperone GRP78/BiP by vomitoxin (Deoxynivalenol). Toxicology and Applied Pharmacology 162, 207–217.
Yoshizawa T, Cote LM, Swanson SP and and Buck WB 1986. Confirmation of DOM-1, a de-epoxidation metabolite of deoxynivalenol, in biological fluids of lactating cows. Agricultural and Biological Chemistry 50, 227–229.
Fusariummycotoxin-contaminated wheat alters the gene expression of broilers
291
https:/www.cambridge.org/core/terms. https://doi.org/10.1017/S1751731111001601