HAL Id: hal-00296326
https://hal.archives-ouvertes.fr/hal-00296326
Submitted on 7 Sep 2007
HAL is a multi-disciplinary open access
archive for the deposit and dissemination of
sci-entific research documents, whether they are
pub-lished or not. The documents may come from
teaching and research institutions in France or
abroad, or from public or private research centers.
L’archive ouverte pluridisciplinaire HAL, est
destinée au dépôt et à la diffusion de documents
scientifiques de niveau recherche, publiés ou non,
émanant des établissements d’enseignement et de
recherche français ou étrangers, des laboratoires
publics ou privés.
atmosphere: wet and dry discharged spores,
carbohydrates, and inorganic ions
W. Elbert, P. E. Taylor, M. O. Andreae, U. Pöschl
To cite this version:
W. Elbert, P. E. Taylor, M. O. Andreae, U. Pöschl. Contribution of fungi to primary biogenic aerosols
in the atmosphere: wet and dry discharged spores, carbohydrates, and inorganic ions. Atmospheric
Chemistry and Physics, European Geosciences Union, 2007, 7 (17), pp.4569-4588. �hal-00296326�
www.atmos-chem-phys.net/7/4569/2007/ © Author(s) 2007. This work is licensed under a Creative Commons License.
Chemistry
and Physics
Contribution of fungi to primary biogenic aerosols in the
atmosphere: wet and dry discharged spores, carbohydrates, and
inorganic ions
W. Elbert1, P. E. Taylor2,3, M. O. Andreae1, and U. P¨oschl1
1Max Planck Institute for Chemistry, Biogeochemistry Department, PO Box 3060, 55020 Mainz, Germany 2Chemistry and Chemical Engineering, California Institute of Technology, Pasadena, CA 91125, USA
3Centre for Cellular and Molecular Biology, School of Life and Environmental Sciences, Deakin University, 221 Burwood
Highway, Burwood, Victoria, 3125, Australia
Received: 20 September 2006 – Published in Atmos. Chem. Phys. Discuss.: 15 November 2006 Revised: 17 August 2007 – Accepted: 28 August 2007 – Published: 7 September 2007
Abstract. Biogenic aerosols play important roles in atmo-spheric chemistry physics, the biosphere, climate, and public health. Here, we show that fungi which actively discharge their spores with liquids into the air, in particular actively wet spore discharging Ascomycota (AAM) and actively wet spore discharging Basidiomycota (ABM), are a major source of primary biogenic aerosol particles and components. We present the first estimates for the global average emission rates of fungal spores.
Measurement results and budget calculations based on in-vestigations in Amazonia (Balbina, Brazil, July 2001) indi-cate that the spores of AAM and ABM may account for a large proportion of coarse particulate matter in tropical rain-forest regions during the wet season (0.7–2.3 µg m−3). For the particle diameter range of 1–10 µm, the estimated pro-portions are ∼25% during day-time, ∼45% at night, and ∼35% on average. For the sugar alcohol mannitol, the bud-get calculations indicate that it is suitable for use as a molec-ular tracer for actively wet discharged basidiospores (ABS). ABM emissions seem to account for most of the atmospheric abundance of mannitol (10–68 ng m−3), and can explain the observed diurnal cycle (higher abundance at night). ABM emissions of hexose carbohydrates might also account for a significant proportion of glucose and fructose in air par-ticulate matter (7–49 ng m−3), but the literature-derived ra-tios are not consistent with the observed diurnal cycle (lower abundance at night). AAM emissions appear to account for a large proportion of potassium in air particulate mat-ter over tropical rainforest regions during the wet season (17–43 ng m−3), and they can also explain the observed di-urnal cycle (higher abundance at night). The results of our investigations and budget calculations for tropical
rainfor-Correspondence to: W. Elbert
(elbert@mpch-mainz.mpg.de)
est aerosols are consistent with measurements performed at other locations.
Based on the average abundance of mannitol reported for extratropical continental boundary layer air (∼25 ng m−3),
we have also calculated a value of ∼17 Tg yr−1 as a first
estimate for the global average emission rate of ABS over land surfaces, which is consistent with the typically observed concentrations of ABS (∼103–104m−3; ∼0.1–1 µg m−3). The global average atmospheric abundance and emission rate of total fungal spores, including wet and dry discharged species, are estimated to be higher by a factor of about three, i.e. ∼1 µg m−3 and ∼50 Tg yr−1. Comparisons with esti-mated rates of emission and formation of other major types of organic aerosol (∼47 Tg yr−1 of anthropogenic primary or-ganic aerosol; 12–70 Tg yr−1of secondary organic aerosol) indicate that emissions from fungi should be taken into ac-count as a significant global source of organic aerosol. The effects of fungal spores and related chemical components might be particularly important in tropical regions, where both physicochemical processes in the atmosphere and bio-logical activity at the Earth’s surface are particularly intense, and where the abundance of fungal spores and related chem-ical compounds are typchem-ically higher than in extratropchem-ical re-gions.
1 Introduction
Biogenic aerosols are ubiquitous in the Earth’s atmosphere and they influence atmospheric chemistry and physics, the biosphere, climate, and public health. They play an impor-tant role in the spread of biological organisms and reproduc-tive materials, and they can cause or enhance human, animal, and plant diseases. Moreover, they influence the Earth’s en-ergy budget by scattering and absorbing radiation, and they
can initiate the formation of clouds and precipitation as cloud condensation and ice nuclei (Dingle, 1966; Schnell and Vali, 1972; Cox and Wathes, 1995; Andreae and Crutzen, 1997; Hamilton and Lenton, 1998; Andreae et al., 2002; Ariya and Amyot, 2004; Taylor and Jonsson, 2004; Jaenicke, 2005; Lohmann and Feichter, 2005; P¨oschl, 2005; Dusek et al., 2006; McFiggans et al., 2006; Sun and Ariya, 2006; and ref-erences therein). The composition, abundance, and origin of biogenic aerosol particles and components are, however, still poorly understood and quantified.
Primary biogenic aerosol (PBA) particles and components are emitted directly from the biosphere to the atmosphere. Examples of PBA particles are pollen, bacteria, fungal and fern spores, viruses, and fragments of animals and plants (Si-moneit and Mazurek, 1982; Matthias-Maser and Jaenicke, 1992; Artaxo and Hansson, 1995; Bauer et al., 2005; De-spr´es et al., 2007). PBA components comprise the non- or semi-volatile chemical substances contained in PBA parti-cles as well as the biogenic substances contained in other types of aerosol particles such as soil dust, sea spray, etc. (Wu et al., 2004; Fuzzi et al., 2006; Kellogg and Griffin, 2006). Matthias-Maser et al. (2000) have determined PBA mass concentrations of ∼6.5 µg m−3for the aerosol particle size range 0.2–50 µm in extratropical continental air, and Penner (1995) has estimated that plant fragments and microorgan-isms contribute 56 Tg yr−1to the global emission rate of fine particulate matter (D<2.5 µm). Recently, Jaenicke (2005) has estimated that PBA emission from the biosphere may amount to ∼1000 Tg yr−1.
The occurrence and dispersion of microorganisms and spores in the air has been discussed and investigated very early in the history of aerosol science (Ehrenberg, 1830; Pas-teur, 1860a, b). Since then, aircraft, balloon, and rocket measurements have shown that PBA particles are not only ubiquitous over land and oceans but also transported to high altitudes (up to 80 km) and over long distances (Schepper-grell, 1924; Proctor, 1934; Meier, 1935; Rogers and Meier, 1936; Pady et al., 1950; Hirst et al., 1967b; Gregory, 1978; Imshenetsky et al., 1978; Watson and DeSousa, 1983; Griffin et al., 2001; McCarthy, 2001; Brown and Hovmoller, 2002; Yeo and Kim, 2002; Wainwright et al., 2003; Griffin, 2004; Prospero et al., 2005).
Pollen grains, fern spores, large fungal spores, and other large PBA particles typically belong to the coarse fraction of air particulate matter, with aerodynamic diameters up to one hundred micrometers. PBA particles and components are, however, also found in intermediate and fine fractions of air particulate matter, with aerodynamic diameters less than 10 µm (PM10), 2.5 µm (PM2.5), and 1 µm (PM1), re-spectively: most fungal spores, small fragments and excre-tions of plants and animals, bacteria, viruses (G´orny et al., 2002; Taylor et al., 2004; Pringle et al., 2005a); carbohy-drates, proteins, waxes, ions, etc. are in this size range (Fish, 1972; Beauford et al., 1975; Miguel et al., 1999; Zhang and Anastasio, 2003; Franze et al., 2005; P¨oschl, 2005). So far,
however, the biological, chemical, and physical effects and mechanisms involved in the emission and dispersion of PBA particles and components have received little attention in bio-geoscience and atmospheric research.
Here, we address the active (forcible) discharge of fungal spores, which is accompanied by the emission of aqueous droplets containing carbohydrates and inorganic ions. We summarize the information on the atmospheric abundance of wet and dry discharged fungal spores that is available from earlier scientific studies made at various locations around the world, and we present new measurement results and bud-get calculations for aerosol samples from tropical rainforests in Amazonia. Finally, we derive the first estimates for the global atmospheric emission rates of actively wet discharged basidiospores and of total fungal spores.
2 Fungal species and discharge of fungal spores
The number of different fungal species existing on Earth is assumed to be in the range of 1–1.5 million. Some 80 000 to 120 000 have been described to date (Hawksworth, 2003; Levetin, 2004; Webster and Weber, 2007), but only about 40 000 are well-characterized (Rossman, 1994). Species in the biological kingdom of Fungi (Eumycota) can be grouped into the four divisions (phyla) Ascomycota (AM), Basid-iomycota (BM), ChytridBasid-iomycota (CM), and Zygomycota (ZM) (Webster and Weber, 2007). Most of the fungal species found in the biosphere and atmosphere belong to AM and BM (Gregory and Sreeramulu, 1958; Chatterjee and Harg-reave, 1974; Calderon et al., 1995; Decco et al., 1998; New-son et al., 2000; Kendrick, 2001; Troutt and Levetin, 2001; Helbling et al., 2002; Boreson et al., 2004; Hasnain et al., 2004; Fang et al., 2005; Hasnain et al., 2005; Zoppas et al., 2006; Butinar et al., 2007). CM and ZM are less frequently detected in the atmosphere.
Fungi are able to survive harsh environmental conditions, and viable forms have been found in deserts, hot biomass burning plumes, hailstones, subglacial ice of Arctic glaciers, glacial melt water, soils of snowcapped tundra, and deep sea sediments (Novozhilova and Popova, 1969; Mandrioli et al., 1973; Ma et al., 2000; Schadt et al., 2003; Boreson et al., 2004; Hasnain et al., 2004; Mims and Mims, 2004; Butinar et al., 2007; de Garcia et al., 2007).
Fungi can be pleomorphic, i.e. they can exist in two or more forms (morphs). Many well-known species of AM and BM occur in two morphs: a sexually reproducing form called the teleomorph (perfect state) and an asexually reproducing form termed the anamorph (imperfect state). The latter was formerly designated as Deuteromyces or Fungi Imperfecti. Molecular genetic methods, however, have enabled the un-ambiguous assignment of asexual anamorphs to the divisions specified above, and it has been suggested to discontinue us-ing the terms Deuteromyces and Fungi Imperfecti (Kurtzman
and Fell, 1998; Ribes et al., 2000; Hawksworth, 2004; Web-ster and Weber, 2007).
The reproduction of fungi proceeds via budding (asexual) or sporulation (sexual or asexual), and fungal spores or coni-dia (asexual spores generated by mitosis) are dispersed via a variety of mechanisms (Buller, 1909-1950; Ingold, 1971; Lacey, 1996; Ingold, 1999). In this study, the term “spores” refers to both sexual spores and asexual spores (conidia), un-less mentioned otherwise.
In the following, we concentrate on those species of As-comycota and Basidiomycota that actively discharge their spores with liquid jets or droplets into the air. We desig-nate these species as “actively wet spore discharging As-comycota” (AAM) and “actively wet spore discharging Ba-sidiomycota” (ABM), which account for a major fraction of the known AM and BM, respectively (Ingold, 2001a, b; Pringle et al., 2005b)
2.1 Actively wet spore discharging Ascomycota (AAM) AAM exist as saprophytes on dead biomass as well as en-dophytes or parasites in/on living organisms. In combina-tion with algae, they form lichens which live as epiphytes on plants or on other surfaces, such as rocks, house walls etc. They are found in most regions and climate zones of the world.
The spores of AAM, which we designate as actively wet discharged ascospores (AAS), are typically 2–20 µm in aero-dynamic diameter (Buller, 1909; Ingold, 2001b) and mature within apothecia. These are composed of small sacks (asci) filled with epiplasmic fluids, and they contain a mix of or-ganic and inoror-ganic solutes. For example, a mature ascus of
Giberella zeae holds a liquid volume of ∼7×10⁻¹⁵m3with mannitol (4.7±2.2×10⁻¹²g), potassium (4.6×10⁻¹¹g), and chloride (1.4×10⁻¹¹g) as the main solutes (Trail et al., 2005). Glycerol and proline (37±6 and 8±3 mmol/L, respec-tively) were found in the ascus sap of Ascobolus immersus (Fischer et al., 2004). To our knowledge, other data on the chemical composition of ascus sap are not available.
The asci are pressurized osmotically and, upon discharge, spores and droplets of epiplasmic fluid are vigorously ejected through a narrow aperture at the tip of the bursting asci (Buller, 1909; Ingold, 2001a; Trail et al., 2002). The size and number of the ejected aqueous droplets are similar to the size and number of spores (twice as many droplets in the case of Giberella zeae, Trail et al., 2002). The discharge dis-tance ranges from about one to several hundred millimeters in still air (Buller, 1909; Ingold, 1971; Meredith, 1973). In-gold (1971) pointed out that “in the great majority of As-comycetes, the largest group of the Fungi, the ascus is a turgid cell that finally bursts in a regular manner violently liberating its contained ascospores”.
Raynal (1990) found that individual apothecia of
Sclero-tinia trifoliorum ejected up to 4.7×10⁶AAS over their entire life cycle. Ingold (1971) reported that individual apothecia of
Cookeina sulcipes can discharge 3–24×106AAS, and Hong and Michailides (1998) determined a release of 2–37×106 AAS per AAM fruiting body of Monilinia fructicola. Venette (1998) reported that a single apothecium of Sclerotinia
scle-rotiorum can discharge 2–30×106AAS over a period of sev-eral days and estimated a potential spore load of 0.2–3×10¹² AAS for this fungus per ha of grain field (Table A1). For
Ven-turia inaequalis, AAS emission fluxes of 102–104m−2s−1 have been reported from a grass field in Connecticut, USA (Aylor and Flesch, 2001; de Jong et al., 2002).
2.2 Actively wet spore discharging Basidiomycota (ABM) ABM comprise a large number of mushrooms, bracket and jelly fungi, smut and rust fungi, as well as basidiomyce-tous yeasts (∼30 000 known species, Pringle et al., 2005b). The actively wet discharged basidiospores (ABS) emitted by these fungi grow on little pedestals called basidia (Buller, 1909; Gregory, 1973). In the literature, a variety of different terms have been used for ABS: ballistospores, ballistosporic basidiospores, ballistoconidia, ballistosporic conidia, sec-ondary ballistospores, secsec-ondary spores, or secsec-ondary coni-dia (Buller, 1909–1950; Buller, 1934; Taylor, 1970; Ingold, 1971; Mims and Richardson, 1990; Boekhout, 1991; Han-lin, 1994; Bauer and Oberwinkler, 1997; Kurtzman and Fell, 1998; Piepenbring et al., 1998; Nakase, 2000; Carlile et al., 2001; Ingold, 2001b; Barnett and Robinow, 2002; Davoli and Weber, 2002; Scorzetti et al., 2002; Pringle et al., 2005b).
The aerodynamic diameters of ABS typically range from 2 to 10 µm (Boekhout, 1991; Lin and Li, 1996; Golubev, 1999; Takashima and Nakase, 2001; Ingold, 2001b; Bai et al., 2002; Burge, 2002; Zhao et al., 2003; Wu et al., 2004). Their active discharge was already noted in the 19t hcentury, but only recently was the discharge mechanism elucidated and termed “surface tension catapult” (Turner and Webster, 1991; Pringle et al., 2005b). It involves an aqueous droplet near the basal end of the spore called the “Buller’s drop” (Buller, 1915, 1922; Buller and Vanterpool, 1925), and a thin liquid film on the distal end of the spore. At high relative humidity they both grow by hygroscopic uptake of water va-por. Upon reaching a size comparable to the spore, Buller’s drop and the liquid film merge, and the generated momen-tum propels the spore, enveloped by the liquid, away from the basidium – typically over distances of 0.1–1.5 mm (Web-ster et al., 1989; Turner and Web(Web-ster, 1995; Ingold, 1997, 1999; Pringle et al., 2005b) (http://www.anbg.gov.au/fungi/ spore-discharge-mushrooms.html).
The solutes found in Buller’s drops of the basidiomycetous yeast Itersonilia perplexans are mainly hexoses and manni-tol (3.8 and 5.3 pg per spore, respectively) plus smaller (but not quantified) quantities of inorganic ions like phosphate, sodium and potassium (Webster et al., 1995). To our knowl-edge, other data on the chemical composition of the Buller’s drop are not available.
Buller (1909) reported that a single fruiting body of a mushroom (basidiocarp) can discharge as many as 4–10×107 ABS per hour (Psalliota campestris and Coprinus
coma-tus), 6.8×10⁸ABS per week (Daedalea confragosa), or 1– 10×1010ABS per year (Polyporus squamosus), respectively (Table A1). Meredith (1973) reported discharge rates of 3×10¹⁰ABS per day over periods up to 6 months for artist’s conk (Ganoderma applanatum).
Several other fungal species also actively discharge their propagating units with liquid jets or droplets, but not via the mechanisms specified above, e.g., Basidiobolus,
Coni-diobolus, Entomophtora, Pilobolus (ZM) and Sphaerobolus stellatus (BM) (Buller, 1909; Couch, 1939; Page, 1964;
In-gold, 1999; Ribes et al., 2000). The chemical composition of these liquids is, however, not known, and the occurrence of spores from these species in air samples has been reported much less frequently. Therefore, these species are not con-sidered any further in this study. In the budget calculations presented below, we also do not consider the potential re-lease of additional chemical compounds from inside the fun-gal spores, as their walls are not easily ruptured under the conditions usually applied for the extraction of aerosol fil-ter samples for chemical analysis (Weijman, 1979; Suzuki and Nakase, 1988; Davoli and Weber, 2002; Graham et al., 2002; Solomon et al., 2006). Nevertheless, these aspects may merit further investigation in future studies aimed at fully un-raveling the primary biogenic components of air particulate matter.
2.3 Dry spore discharging fungi
Several fungi do not actively discharge spores with liquid jets or droplets into the air. Their spores are dislodged by air currents or detached by other external forces. Some species are thought to actively support the detachment of spores (conidia) by a process called hygroscopic twisting movement (HTM) which occurs upon drying (Meredith, 1963). In any case, the spores of these fungi are discharged without accom-panying liquids and can be summarized under the term “dry discharged spora” (DDS), which is comparable to the terms “dry air spora” or “fine weather spores” used by Gregory (1971) and Levetin (2004), respectively. Prominent repre-sentatives of dry spore discharging fungi are species of the genera Aspergillus, Aureobasidium, Penicillium (AM) and
Cladosporium (BM).
3 Abundance of fungal spores and related chemical components in air particulate matter
3.1 Wet and dry discharged spores
The abundance of fungal spores in the air is highly vari-able, and is dependent upon location, season, time of day, and weather. Air masses with low concentrations of spores can be intercepted by plumes with very high concentrations
(Hirst et al., 1967b; Chatterjee and Hargreave, 1974; Burch and Levetin, 2002).
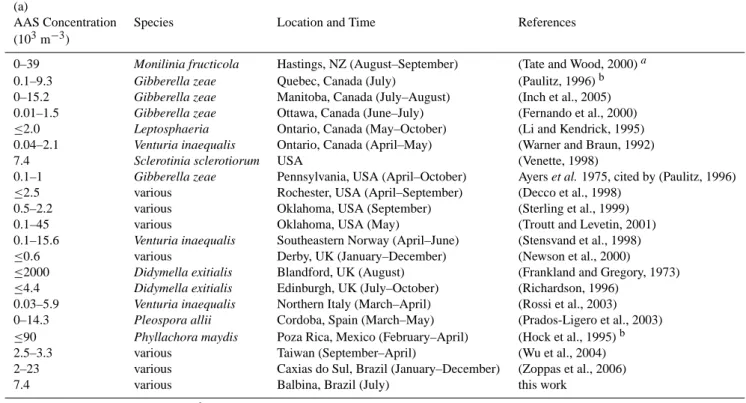
Table A2 summarizes ambient concentrations of AAS (a) and ABS (b) reported in earlier studies, and the results of our microscopic investigations of aerosol filter samples col-lected in the tropical rainforest of Amazonia. Overall, the concentrations range from zero to ∼104m−3, with excep-tional maximum values up to ∼106m−3(Gregory and Sreer-amulu, 1958; Frankland and Gregory, 1973). Most of the concentrations reported for AAS and ABS, including the few data available from tropical regions (Brazil, Mexico, Tai-wan), range between 103m−3and 104m−3.
Precipitation appears to be required for the release of spores from many AAM, and AAS concentrations have been found to increase during and after rainstorms. The release and resultant airborne concentrations of ABS, on the other hand, appear to be more directly correlated with relative hu-midity rather than precipitation (Gregory and Hirst, 1957; Gregory and Sreeramulu, 1958; Hirst et al., 1967a; In-gold, 1971; Meredith, 1973; Chatterjee and Hargreave, 1974; Stephen et al., 1990; Gottwald et al., 1997; Burch and Lev-etin, 2002; Zoppas et al., 2006).
DDS are mostly emitted when dry, warm, and windy con-ditions prevail; the wind speed required for the discharge of DDS is typically on the order of ∼1 m s−1(Meredith, 1963; Meredith, 1973; Shaner, 1981; Lacey, 1996; Timmer et al., 1998; Byrne et al., 2000; Aylor et al., 2001; Carlile et al., 2001; Burch and Levetin, 2002; G´orny et al., 2002; Glovsky et al., 2003). The atmospheric concentrations reported for DDS in the size range of 2–10 µm are mostly on the or-der of 103–104m−3, i.e. comparable to the average
concen-trations of ABS and AAS (Gregory and Hirst, 1957; Gre-gory and Sreeramulu, 1958; Adams et al., 1968; Chatterjee and Hargreave, 1974; Kramer and Eversmeyer, 1984; Li and Kendrick, 1995; Newson et al., 2000; Troutt and Levetin, 2001; Levetin, 2004; Wu et al., 2004; Fang et al., 2005; Ho et al., 2005; Zoppas et al., 2006).
The above data for AAS, ABS, and DDS are consistent with recent studies investigating total concentrations of fun-gal spores in alpine air (∼103m−3; Mt. Rax, Austria) and urban air (8–26×103m−3; Vienna, Austria), corresponding to 2–6 % of the organic carbon fraction and up to 1.3% of the total mass of air particulate matter (Bauer et al., 2002; Bauer et al., 2005). In rural air over an agricultural region, Burch and Levetin (2002) recorded concentrations of total fungal spores in the range of 2–17×104m−3(Bixby/Tulsa,
USA). They also reported that dry discharged fungal spores (DDS) were enhanced during warm, dry weather conditions, whereas actively wet discharged AAS and ABS concentra-tions tend to be enhanced during humid condiconcentra-tions, such as those at night and in the early morning. Most studies of total fungal spores in continental air around the world have re-ported concentrations on the order of 104m−3(Newson et al., 2000; Troutt and Levetin, 2001; Wu et al., 2004; Ho et al., 2005; Zoppas et al., 2006).
3.2 Tropical rainforest aerosol samples
The air samples used in our own experimental investigations were collected at the beginning of the dry season at Balbina, Amazonia, Brazil, (1◦55′S, 59◦24′W, 174 m above sea level)
on a pasture site adjacent to pristine tropical rainforest. Sam-ples for microscopic examination were taken with a rotating impactor and with an isokinetic 2-stage jet impactor posi-tioned 2 m above the ground. Air samples for the determi-nation of inorganic ions in fine particulate matter (≤2 µm) and coarse particles (2–10 µm) were taken with two-stage stacked filter units (SFU). Sugars and sugar alcohols were determined in aerosol particle samples collected with a di-chotomous high-volume (HiVol) sampler: fine (≤2.5 µm) and coarse (≥2.5 µm). Both the SFU and the HiVol sam-plers were positioned 4 m above the ground (Graham et al., 2003a; Graham et al., 2003b; Moura et al., 2004).
AAS and ABS were determined by detailed microscopic investigation of two exemplary samples collected with the jet impactor on 22 July 2001 (local time of sampling: 09:10– 09:48 and 23:55–01:05). The samples were mounted and directly observed with a Nikon 80i light microscope at up to 1500x magnification. Fungal spore types were identified based on their morphology in 200 fields of view for each sample. Counts were expressed per cubic meter of air sam-pled.
Fungal spores (2–20 µm) were generally most abundant in night-time samples when the relative humidity was close to 100%, whereas the concentration of larger fern spores and pollen was typically higher in day-time samples (Graham et al., 2003a). The night-time concentrations were ∼7400 m−3 for AAS and ∼12 800 m−3for ABS (∼3600 m−3from rust fungi and ∼9150 m−3 from smut fungi); the day-time con-centrations were ∼3000 m−3 for AAS and ∼1800 m−3 for ABS (almost exclusively from rust fungi). The results are consistent with the general trends and concentrations of AAS, ABS, and total fungal spores observed in earlier in-vestigations (as outlined above), in a recent study of colony-forming spores sampled from a tropical rainforest in Aus-tralia (Gilbert and Reynolds, 2005), and in a study conducted in a tropical pluvial location in the south of Brazil (Zoppas et al., 2006).
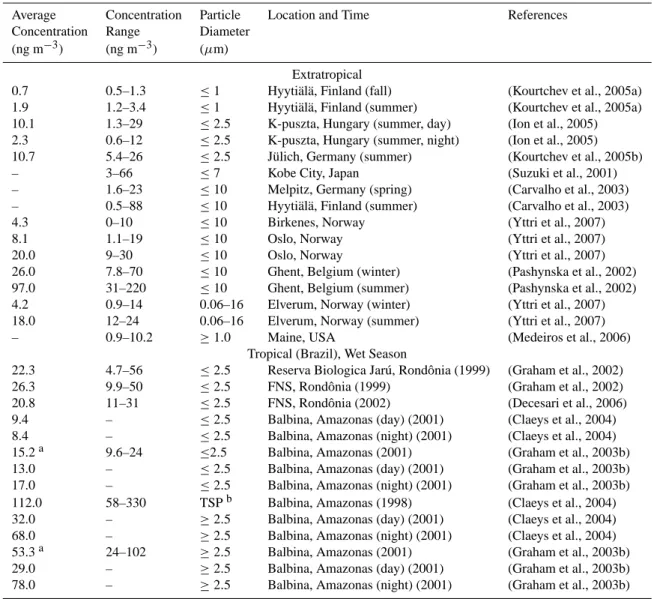
3.3 Carbohydrates: mannitol, glucose, and fructose Table A3 gives an overview of the concentrations reported for the sugar alcohol mannitol (C6H14O6) in atmospheric
aerosols. At extratropical locations, the average concentra-tions of mannitol were 1–11 ng m−3 for particles ≤2.5 µm and 4–97 ng m−3 for particles ≥2.5 µm. In aerosol sam-ples from Amazonia and Rondˆonia (Brazil), average man-nitol concentrations were 2–3 times higher than at extratrop-ical locations: 8–26 ng m−3for particles ≤2.5 µm, and 29– 112 ng m−3for particles ≥2.5 µm. Investigations with sep-arate day-time and night-time samples of particles ≥2.5 µm
showed that the night-time concentrations of mannitol were higher by factors of 2–3 (Graham et al., 2002; Graham et al., 2003b; Claeys et al., 2004). Recent investigations with an 11-stage MOUDI aerosol impactor showed that the mass size distribution of mannitol in tropical rainforest aerosols (Rondˆonia, Brazil) exhibited a maximum at particle diam-eters around 5 µm. The maximum was particularly pro-nounced (up to three orders of magnitude higher than the lowest values of the size distribution function) during nights of the dry season and throughout the transition and wet sea-sons (Decesari et al., 2006; Fuzzi et al., 2007). In the wet season the total aerosol mass size distribution function was also dominated by a pronounced maximum at particle diam-eters around 5 µm (Fuzzi et al., 2007).
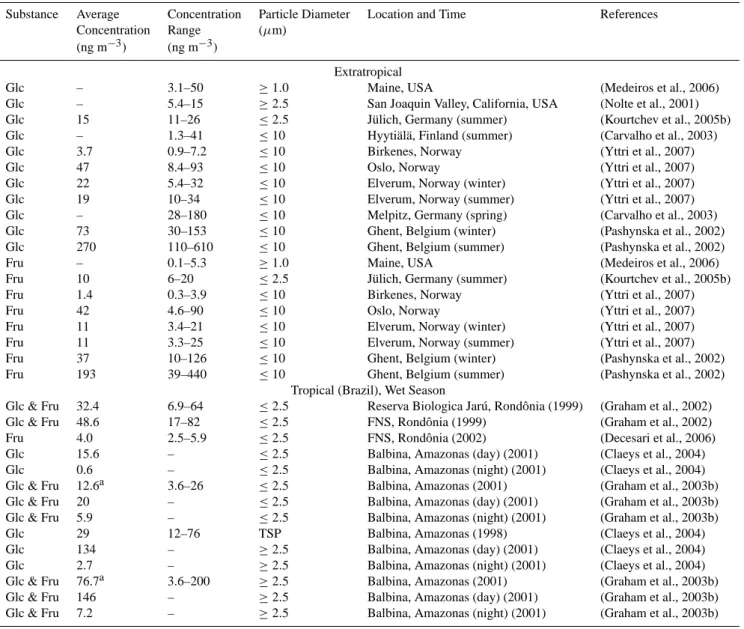
Table A4 gives an overview of the atmospheric con-centrations observed for the hexose sugars, glucose and fructose (C6H12O6). In contrast to mannitol, the
aver-age glucose and fructose concentrations determined in sam-ples of air particulate matter from Amazonia and Rondˆonia (Brazil), were not higher than at extratropical locations: 1– 49 ng m−3(≤2.5 µm) and 3–146 ng m−3(≥2.5 µm) at trop-ical locations; 10–15 ng m−3(≤2.5 µm) and 1–270 ng m−3 (≥2.5 µm) at extratropical locations. Moreover, studies with separate day-time and night-time sampling at tropical sites showed a diurnal cycle opposite to that of mannitol: glucose and fructose concentrations were strongly enhanced during day-time (up to 50 times higher than at night) (Graham et al., 2003b).
4 Contribution of AAM and ABM emissions to the con-centration and composition of Amazonian rainforest aerosols
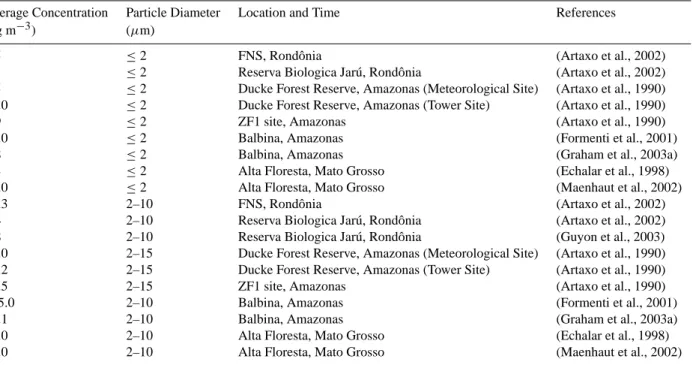
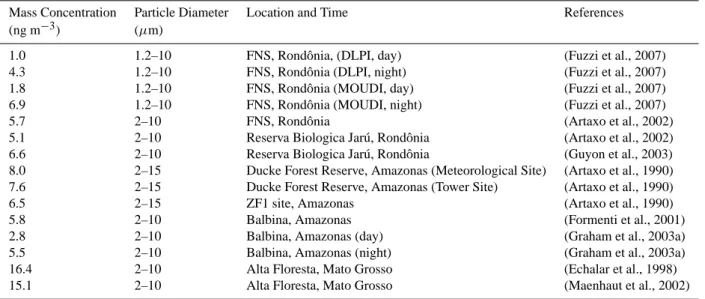
Tables A5 and A6 give an overview of potassium and chlo-ride ion concentrations in atmospheric aerosols observed dur-ing the wet season at various locations in Amazonia. The concentrations of potassium were typically in the range of 18–220 ng m−3for particles ≤2 µm and 14–270 ng m−3for particles in the size range of 1–15 µm, respectively, and night-time concentrations generally exceeded day-time con-centrations (Graham et al., 2003a; Fuzzi et al., 2007). The chloride concentrations were in the range of 5–65 ng m−3for particles ≤2 µm and 8–155 ng m−3for particles with diam-eters of 2–15 µm, respectively. Table A7 lists total particle mass concentrations recorded during the wet season at vari-ous locations in Amazonia. Long-term average values for the particle size range of 2–10 µm were typically 5–16 µg m−3
(Artaxo et al., 1990; Formenti et al., 2001; Guyon et al., 2003). Studies with separate day- and night-time sampling showed that particle mass concentrations were 2–4 times higher at night (Graham et al., 2003a; Fuzzi et al., 2007).
To calculate an estimate of the relative contribution of fun-gal emissions to the chemical composition of coarse air par-ticulate matter (particle diameters 1–2 µm to 10–15 µm) in
Table 1. Liquid concentrations of species ejected with AAS (Trail
et al., 2005) and ABS (Webster et al., 1995) taken as representative average values for budget calculations.
Species Buller’s Drop Ascus Sap
(pg/Spore) (pg/Ascus) Mannitol 5.3 4.7 Hexoses 3.8 nd Potassium nd 45.9 Chloride nd 14.3 Solutes 9.1 64.9 nd: not determined
the tropical rainforest of Amazonia during the wet season, we used the parameters listed in Table 1, which have been derived from the literature (Webster et al., 1995; Trail et al., 2005). For the average mass of AAS we assumed a value of 200 pg for AAS, corresponding to a volume equivalent diam-eter of ∼7 µm and density of ∼1 g cm−3(Trail et al., 2005).
For ABS we assumed an average mass of 65 pg, correspond-ing to a volume equivalent diameter of ∼5 µm and density of ∼1 g cm−3(Buller, 1909; Ingold, 1971; Lin and Li, 1996; Ingold, 2001b; Wu et al., 2004) and consistent with the maxi-mum of mannitol and PM size distributions observed in trop-ical rainforest aerosols during the wet season (Fuzzi et al., 2007). This is a lower estimate compared to the 840 pg per ABS of I. perplexans reported by Turner and Webster (1991), which would correspond to a volume equivalent diameter of ∼12 µm at ∼1 g cm−3. For AAS, the number of spores per ascus can vary over a range of about 1–100. Nevertheless, an average number of 8 spores per ascus has been determined for the majority of AAM and was used in our calculations (Ingold, 1971).
By multiplication of the parameters outlined above with the measured number concentrations of AAS and ABS, we obtained the mass concentration estimates listed in Table 2 and illustrated in Figs. 1–4.
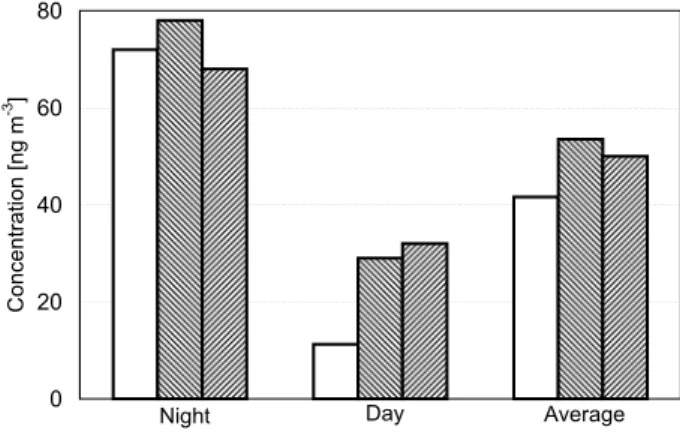
For mannitol (Fig. 1), the estimated fungal emissions are dominated by ABS and account for 100% of the night-time, 35 % of the day-time, and 80% of the average concentra-tions, which have been determined in two independent mea-surements at the same location and period of time (Balbina: 19–28 July 2001, (Graham et al., 2003b); 25–28 July 2001, (Claeys et al., 2004); particle diameters ≥2.5 µm).
For the hexoses (Fig. 2), the fungal emission estimate (re-lated to ABS only) exceeds the measured night-time concen-trations of glucose and fructose by a factor of 10. During day-time the estimated fungal emissions would account for only ∼10%, and averaged over 24 h they would account for ∼60% of the observed concentrations.
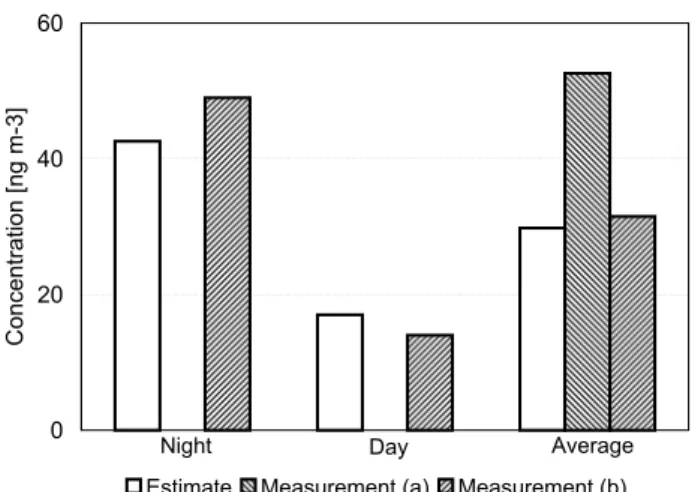
For potassium (Fig. 3), the estimated fungal emissions (re-lated to AAS only) account for ∼60 % of the average con-centration measured at the same location and period of time
0 20 40 60 80 C o n ce n tra ti o n [ n g m -3]
Estimate Measurement (a) Measurement (b)
Night Day Average
Fig. 1. Mannitol concentrations in ambient air in Amazonia
(Bal-bina, Brazil; wet season): estimate from spore counts (this study) compared to measurements of (a) Graham et al. (2003b; plotted: mean values of 6 samples; night-time standard deviation (SD):
±15 n m−3; day-time SD: ±8 ng m−3; concentration range: 24–
102 ng m−3) and (b) Claeys et al. (2004; plotted: mean values).
(Balbina: 16–28 July 2001, (Graham et al., 2003a); parti-cle diameters 2–10 µm; separate day- and night-time val-ues not available). Compared to measurement data from a different place and time during the wet season in Ama-zonia (FNS: Fazenda Nossa Senhora Aparecida, near Ouro Preto do Oeste, Rondˆonia) (Fuzzi et al., 2007), the day- and night-time estimates would account for practically all of the potassium in the investigated aerosol particle size range (1– 10 µm) and are consistent with the observed diurnal cycle.
For chloride (Tables A6 and 2), the estimated fungal emis-sions (related to AAS only) account for ∼15% of the average concentration measured at the same location and period of time (Balbina: 16–28 July 2001, (Graham et al., 2003a; par-ticle diameters 2–10 µm; separate day- and night-time values not available).
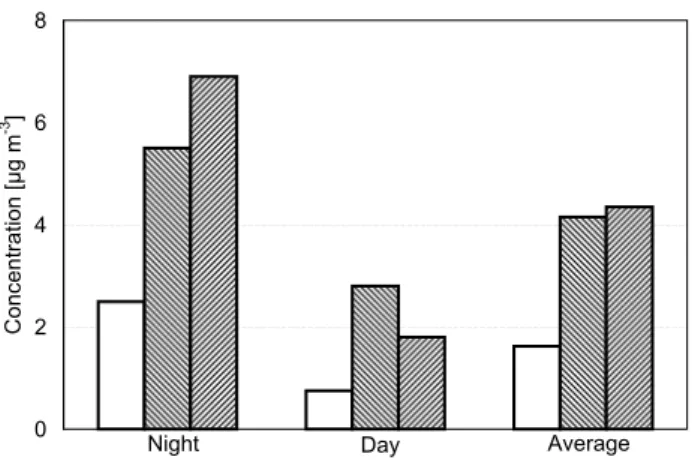
For total mass of particulate matter (Fig. 4), the estimated emissions by actively wet spore discharging fungi are domi-nated by the spores rather than the solutes (solute mass frac-tion only 5–10%) and account for ∼45% of the night-time, ∼25% of the day-time, and ∼35% of the average concen-trations measured at the same location and period of time (Balbina: 22–25 July 2001, Graham et al., 2003a); particle diameters 2–10 µm). Compared to measurement data from FNS (Fuzzi et al., 2007), the estimated proportion of fungal emissions in particles sized 1–10 µm in diameter would be slightly lower at night, higher during the day, and similar on average.
Table 2. Measured and calculated concentrations of spores and related chemical components in air particulate matter from Balbina: measured
number concentrations of ABS and AAS; calculated mass concentrations of solutes and spores (calculations as detailed in Sect. 4).
ABS AAS AAS + ABS
Day Night Day Night Day Night Average
Spores (m−3) 1800 12 772 2964 7416 4764 20 188 12 476 Mannitol (ng m−3) 9.5 67.7 1.7 4.3 11.2 72 41.6 Hexoses (ng m−3) 6.8 48.5 nd nd 6.8 48.5 27.7 Potassium (ng m−3) nd nd 17.3 43.3 17.3 43.4 29.8 Chloride (ng m−3) nd nd 5.3 13.3 5.3 13.3 9.3 Solute Mass (ng m−3) 16.4 116 24.3 60.9 40.7 177 108 Spore Mass (ng m−3) 118 835 592 1483 710 2318 1514 nd: not determined 0 40 80 120 160 C o n ce n tra ti o n [ n g m-3 ]
Estimate Measurement (a) Measurement (b) Night Day Average
Fig. 2. Hexose (glucose and fructose) concentrations in ambient
air in Amazonia (Balbina, Brazil; wet season): estimate from spore counts (this study) compared to measurements of (a) Graham et al. (2003b; plotted: mean values of 6 samples; night-time SD:
±5 ng m−3; day-time SD: ±45 ng m−3; concentration range: 4–
200 ng m−3) and (b) Claeys et al. (2004; plotted: mean values).
5 Global emission estimates for ABS and total fungal spores
As outlined above (Sect. 3.1, Table A2), the knowledge about the abundance and activity of fungi in the global biosphere is very limited. To our knowledge, regional or global estimates for the emission rates and fluxes of wet and dry discharged fungal spores are not available in the literature.
Here, we calculate a first estimate for the global average emission rate of ABS over land surfaces based on the follow-ing first-order approximations and assumptions:
1. The abundance of mannitol in the atmosphere is as-sumed to be dominated by emissions from ABM, which is supported by the literature data and results outlined above (Table A2: similar abundance of AAS and ABS; Table 1: higher amount of mannitol emitted with one
0 20 40 60 C o n ce n tra ti o n [ n g m-3 ]
Estimate Measurement (a) Measurement (b) Night Day Average
Fig. 3. Potassium concentrations in ambient air in Amazonia (wet
season): estimate from spore counts at Balbina (this study) com-pared to measurements at (a) Balbina (Graham et al., 2003a;
plot-ted: mean value of 8 samples; SD of diurnal average: ±29 ng m−3)
and (b) FNS, Rondˆonia (Fuzzi et al., 2007; plotted: mean values;
night-time SD: ±36 ng m−3; day-time SD: ±10 ng m−3).
ABS per Buller’s drop compared to eight AAS per as-cus; Table 2 and Fig. 1: consistency of exemplary cal-culations).
2. The literature-derived value of 5 pg mannitol emitted per ABS (Table 1) is assumed to be representative for ABM, which is supported by the results outlined above (Table 2 and Fig. 1: consistency of exemplary calcula-tions).
3. The average value of mannitol concentrations reported for PM with particle diameters up to 10 µm or more at extratropical measurement locations (25 ng m−3, Ta-ble A3, lines 11–17) is assumed to be representative for a well-mixed continental boundary layer (CBL) with an average height of ∼1 km (Seinfeld and Pan-dis, 1998; Strawbridge and Snyder, 2004; Elbert, 2006).
0 2 4 6 8 C o n ce n tra ti o n [ µ g m -3 ]
Estimate Measurement (a) Measurement (b) Night Day Average
Fig. 4. Aerosol mass concentration in ambient air in Amazonia
(wet season): estimate from spore counts at Balbina (this study) compared to measurements at (a) Balbina (Graham et al., 2003a; plotted: mean values) and (b) FNS, Rondˆonia (Fuzzi et al., 2007;
plotted: mean values; night-time SD: ±5.2 µg m−3; day-time SD:
±1.3 µg m−3).
The following evidence supports these assumptions as conservative: significantly higher mannitol concentra-tions reported from tropical regions (Table A3); signif-icantly higher and well-mixed day-time CBLs in trop-ical regions (Graham et al., 2003b); observation of el-evated spore concentrations in the upper part of the CBL (Meier and Artschwager, 1938; Hirst et al., 1967b; Linskens and Jorde, 1986).
4. The average size and residence times of ABS in the CBL are assumed to be on the order of 5 µm and 1 day, respectively, which is supported by the literature data and results outlined above (Table 2 and Fig. 4: consis-tency of exemplary calculations) and by the basic con-cepts of atmospheric aerosol cycling (rapid sedimenta-tion and wet deposisedimenta-tion of coarse particles).
Dividing the average mannitol concentration of 25 ng m−3by 5 pg (amount of mannitol emitted per ABS) we obtain a value of 5×10³m−3as a first-order estimate for the global average number concentration of ABS in the continental boundary layer, which is consistent with the observations summarized in Table A2b and discussed in Sect. 3.1. Multiplication with an average spore mass of 65 pg yields a value of an average contribution of 0.3 µg m−3to the concentration of air partic-ulate matter, which is also consistent with the observations reported in Sect. 3.1. As demonstrated above, the total mass concentration of actively wet discharged spores (ABS and AAS) and related substances observed in tropical rainforest regions during the wet season are significantly higher, sup-porting the above values as conservative estimates.
Multiplication of the average number concentration with an average CBL height of ∼1000 m and division by an av-erage residence time on the order of ∼1 day yields an
es-timate of ∼60 m−2s−1 for the globally averaged land
sur-face emission flux of ABS. By multiplication with an aver-age spore mass of ∼65 pg, the global land surface area of 1.5×10¹⁴m2 and the duration of one year we obtain an es-timate of ∼17 Tg yr−1for the global emission rate of ABS. Based on the similar magnitudes of the atmospheric abun-dances of ABS, AAS, and DDS (Sect. 3.1), we estimate that the global land surface emission flux and emission rate of total fungal spores are on the order of ∼200 m−2s−1 and ∼50 Tg yr−1, respectively.
This is only a small fraction of the total PBA emission rate of 1000 Tg yr-1 estimated by Jaenicke (2005), but it is of similar magnitude as current estimates of the rates of emission and formation of other types of continental air par-ticulate matter: ∼47 Tg yr−1for anthropogenic primary or-ganic aerosols (POA) made up of 35 Tg yr−1 from
vegeta-tion fires, 9 Tg yr−1from biofuel combustion, 3 Tg yr−1from
fossil fuel combustion; 3–25 Tg yr−1for anthropogenic
sec-ondary organic aerosols (SOA) (Volkamer et al., 2006); and 12–70 Tg yr−1for biogenic SOA (mostly from terpene oxi-dation) (Kanakidou et al., 2005).
Gregory and Sreeramulu (1958) have reported high emis-sions of fungal spores from a marine estuary. On a global scale, however, the oceans appear to be a negligibly small source of fungal spores. A rough estimate of potential emis-sions of fungal spores/cells can be obtained by scaling the global emission rate of sea salt aerosol (∼103–104Tg yr−1; (Seinfeld and Pandis, 1998; Raes et al., 2000; Stier et al., 2005; Textor et al., 2006) with reported proportions of fungal cells and sea salt in surface ocean water (102–103cells per liter corresponding to 10−8–10−7g/kg; sea salt: ∼35 g/kg;
(Novozhilova and Popova, 1969; Yamasato et al., 1974; Gadanho et al., 2003)). The resulting value of ∼10 t yr−1is
six orders of magnitude smaller than the land surface emis-sion estimate, and even a significant enrichment during sea spray formation is unlikely to result in a large global marine source of fungal material.
6 Conclusions and outlook
In this study we have shown that actively wet spore discharg-ing Ascomycota (AAM) and Basidiomycota (ABM) are a major source of primary biogenic aerosol (PBA). These pri-mary biogenic components of coarse air particulate matter (characteristic size range 1–10 µm) may influence the for-mation of clouds and precipitation as cloud condensation and ice nuclei, and they affect the spread and reproduction of or-ganisms in the biosphere. The effects of fungal emissions might be particularly important in tropical regions where both physicochemical processes in the atmosphere and bio-logical activity at the Earth’s surface are particularly intense. In pristine tropical rainforest air, fungal spores indeed ac-count for a major fraction of coarse particulate matter (up to ∼45%).
Using the chemical tracer mannitol and measurement data from around the world, we have derived first estimates for the global average emission rates of fungal spores. The es-timated emission rate of total fungal spores (∼50 Tg yr−1) is of similar magnitude as current estimates of the rates of emission and formation of other types of continental air par-ticulate matter (primary and secondary organic aerosols).
The use of fungi as biocontrol agents might lead to a man-made increase of airborne spores (Burge, 2002; de Jong et al., 2002). Moreover, global warming and increasing CO2
concentrations may enhance the spread of fungi and emis-sion of fungal spores (Klironomos et al., 1997; Høye et al., 2007; Raupach et al., 2007). An increase of fungal spores acting as cloud condensation and ice nuclei may influence the hydrological cycle and provide either positive or negative
feedbacks to climate change.
For further insight and understanding of seasonal and re-gional variations, vertical profiles, and long-range transport of fungal spores and related aerosol components, additional ground-based and airborne measurements of these species will be required. Moreover, a reliable assessment of the overall role of bioaerosols in the climate system and of the relative importance of fungal emissions will require similar investigations for other abundant primary biogenic aerosol particles such as pollen and bacteria. To capture the high bio-logical diversity and the high temporal and spatial variability of airborne fungal spores and other PBA particles, advanced molecular biological analyses and online measurement tech-niques will be needed (P¨oschl, 2005; Despr´es et al., 2007; Treutlein and P¨oschl, 2007).
Appendix A
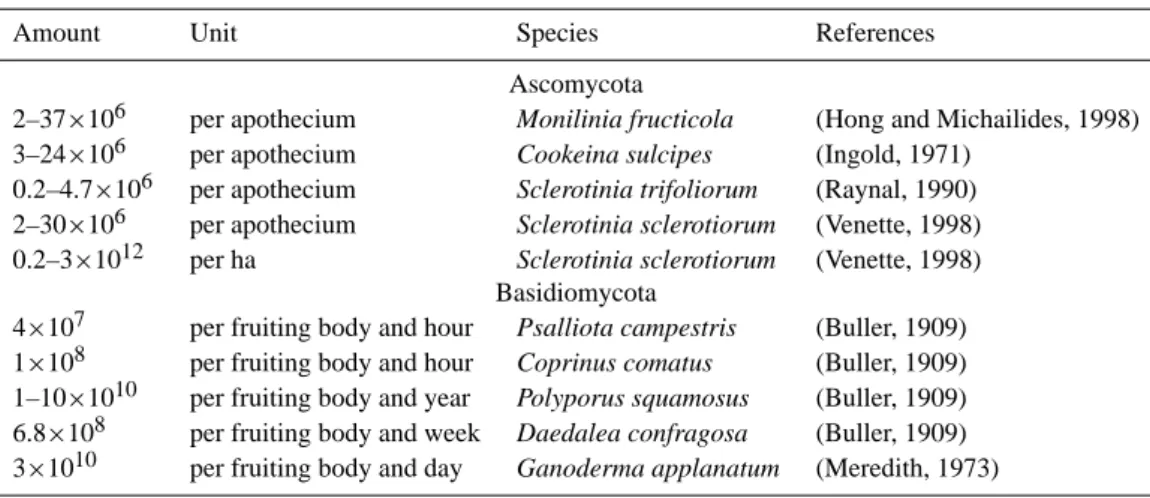
Table A1. Active wet discharge of spores by Ascomycota (AAM) and Basidiomycota (ABM).
Amount Unit Species References
Ascomycota
2–37×106 per apothecium Monilinia fructicola (Hong and Michailides, 1998)
3–24×106 per apothecium Cookeina sulcipes (Ingold, 1971)
0.2–4.7×10⁶ per apothecium Sclerotinia trifoliorum (Raynal, 1990)
2–30×106 per apothecium Sclerotinia sclerotiorum (Venette, 1998)
0.2–3×10¹² per ha Sclerotinia sclerotiorum (Venette, 1998)
Basidiomycota
4×10⁷ per fruiting body and hour Psalliota campestris (Buller, 1909)
1×10⁸ per fruiting body and hour Coprinus comatus (Buller, 1909)
1–10×1010 per fruiting body and year Polyporus squamosus (Buller, 1909)
6.8×10⁸ per fruiting body and week Daedalea confragosa (Buller, 1909)
Table A2. Number concentrations of actively wet discharged ascospores, AAS (a), and actively wet discharged basidiospores, ABS (b),
observed in ambient air. (a)
AAS Concentration Species Location and Time References
(103m−3)
0–39 Monilinia fructicola Hastings, NZ (August–September) (Tate and Wood, 2000)a
0.1–9.3 Gibberella zeae Quebec, Canada (July) (Paulitz, 1996)b
0–15.2 Gibberella zeae Manitoba, Canada (July–August) (Inch et al., 2005)
0.01–1.5 Gibberella zeae Ottawa, Canada (June–July) (Fernando et al., 2000)
≤2.0 Leptosphaeria Ontario, Canada (May–October) (Li and Kendrick, 1995)
0.04–2.1 Venturia inaequalis Ontario, Canada (April–May) (Warner and Braun, 1992)
7.4 Sclerotinia sclerotiorum USA (Venette, 1998)
0.1–1 Gibberella zeae Pennsylvania, USA (April–October) Ayers et al. 1975, cited by (Paulitz, 1996)
≤2.5 various Rochester, USA (April–September) (Decco et al., 1998)
0.5–2.2 various Oklahoma, USA (September) (Sterling et al., 1999)
0.1–45 various Oklahoma, USA (May) (Troutt and Levetin, 2001)
0.1–15.6 Venturia inaequalis Southeastern Norway (April–June) (Stensvand et al., 1998)
≤0.6 various Derby, UK (January–December) (Newson et al., 2000)
≤2000 Didymella exitialis Blandford, UK (August) (Frankland and Gregory, 1973)
≤4.4 Didymella exitialis Edinburgh, UK (July–October) (Richardson, 1996)
0.03–5.9 Venturia inaequalis Northern Italy (March–April) (Rossi et al., 2003)
0–14.3 Pleospora allii Cordoba, Spain (March–May) (Prados-Ligero et al., 2003)
≤90 Phyllachora maydis Poza Rica, Mexico (February–April) (Hock et al., 1995)b
2.5–3.3 various Taiwan (September–April) (Wu et al., 2004)
2–23 various Caxias do Sul, Brazil (January–December) (Zoppas et al., 2006)
7.4 various Balbina, Brazil (July) this work
aoriginal data normalized by time;bdata from infested plots.
(b)
ABS Concentration Species Location and Time References
(103m−3)
≤2.8 various Ontario, Canada (May–October) (Li and Kendrick, 1995)
0–0.05 Rusts Rochester, USA (April–September) (Decco et al., 1998)
0–0.25 Smuts Rochester, USA (April–September) (Decco et al., 1998)
0–0.5 various Rochester, USA (April–September) (Decco et al., 1998)
0.1–5.5 various Oklahoma, USA (May) (Troutt and Levetin, 2001)
0.6–1.6 various Oklahoma, USA (September) (Sterling et al., 1999)
≤3 various Oklahoma, USA (May–November) (Levetin, 1990)
≤30 various Harpenden, UK (July–September) (Gregory and Hirst, 1952)
0.3–1000 various Chichester, UK (July) (Gregory and Sreeramulu, 1958)
≤10 various Cardiff, UK (June–October) (Adams et al., 1968)
5.4 various Derby, UK (January–December) (Newson et al., 2000)
≤3 various Bern, Switzerland (June–October) (Helbling et al., 2002)
0.5–6 various Saudi Arabia (January–December) (Hasnain et al., 2005)
0–0.15 Rusts Saudi Arabia (January–December) (Hasnain et al., 2005)
0.5–4 Smuts Saudi Arabia (January–December) (Hasnain et al., 2005)
≤4.6 various Mexico City, Mexico (January–November) (Calderon et al., 1995)
1.3–2.9 various Taiwan (April–September) (Wu et al., 2004)
0.06 Rusts Taiwan (September–April) (Wu et al., 2004)
0.5 Smuts Taiwan (September–April) (Wu et al., 2004)
2.5–24 various Caxias do Sul, Brazil (January–December) (Zoppas et al., 2006)
3.6 Rusts Balbina, Brazil (July) this work
Table A3. Mannitol mass concentrations in ambient air observed for different ranges of aerosol particle size (aerodynamic diameter),
sampling locations, and seasons.
Average Concentration Particle Location and Time References
Concentration Range Diameter
(ng m−3) (ng m−3) (µm)
Extratropical
0.7 0.5–1.3 ≤1 Hyyti¨al¨a, Finland (fall) (Kourtchev et al., 2005a)
1.9 1.2–3.4 ≤1 Hyyti¨al¨a, Finland (summer) (Kourtchev et al., 2005a)
10.1 1.3–29 ≤2.5 K-puszta, Hungary (summer, day) (Ion et al., 2005)
2.3 0.6–12 ≤2.5 K-puszta, Hungary (summer, night) (Ion et al., 2005)
10.7 5.4–26 ≤2.5 J¨ulich, Germany (summer) (Kourtchev et al., 2005b)
– 3–66 ≤7 Kobe City, Japan (Suzuki et al., 2001)
– 1.6–23 ≤10 Melpitz, Germany (spring) (Carvalho et al., 2003)
– 0.5–88 ≤10 Hyyti¨al¨a, Finland (summer) (Carvalho et al., 2003)
4.3 0–10 ≤10 Birkenes, Norway (Yttri et al., 2007)
8.1 1.1–19 ≤10 Oslo, Norway (Yttri et al., 2007)
20.0 9–30 ≤10 Oslo, Norway (Yttri et al., 2007)
26.0 7.8–70 ≤10 Ghent, Belgium (winter) (Pashynska et al., 2002)
97.0 31–220 ≤10 Ghent, Belgium (summer) (Pashynska et al., 2002)
4.2 0.9–14 0.06–16 Elverum, Norway (winter) (Yttri et al., 2007)
18.0 12–24 0.06–16 Elverum, Norway (summer) (Yttri et al., 2007)
– 0.9–10.2 ≥1.0 Maine, USA (Medeiros et al., 2006)
Tropical (Brazil), Wet Season
22.3 4.7–56 ≤2.5 Reserva Biologica Jar´u, Rondˆonia (1999) (Graham et al., 2002)
26.3 9.9–50 ≤2.5 FNS, Rondˆonia (1999) (Graham et al., 2002)
20.8 11–31 ≤2.5 FNS, Rondˆonia (2002) (Decesari et al., 2006)
9.4 – ≤2.5 Balbina, Amazonas (day) (2001) (Claeys et al., 2004)
8.4 – ≤2.5 Balbina, Amazonas (night) (2001) (Claeys et al., 2004)
15.2a 9.6–24 ≤2.5 Balbina, Amazonas (2001) (Graham et al., 2003b)
13.0 – ≤2.5 Balbina, Amazonas (day) (2001) (Graham et al., 2003b)
17.0 – ≤2.5 Balbina, Amazonas (night) (2001) (Graham et al., 2003b)
112.0 58–330 TSPb Balbina, Amazonas (1998) (Claeys et al., 2004)
32.0 – ≥2.5 Balbina, Amazonas (day) (2001) (Claeys et al., 2004)
68.0 – ≥2.5 Balbina, Amazonas (night) (2001) (Claeys et al., 2004)
53.3a 24–102 ≥2.5 Balbina, Amazonas (2001) (Graham et al., 2003b)
29.0 – ≥2.5 Balbina, Amazonas (day) (2001) (Graham et al., 2003b)
78.0 – ≥2.5 Balbina, Amazonas (night) (2001) (Graham et al., 2003b)
Table A4. Hexose (glucose & fructose) mass concentrations in ambient air observed for different ranges of aerosol particle size (aerodynamic
diameter), sampling locations, and seasons.
Substance Average Concentration Particle Diameter Location and Time References
Concentration Range (µm)
(ng m−3) (ng m−3)
Extratropical
Glc – 3.1–50 ≥1.0 Maine, USA (Medeiros et al., 2006)
Glc – 5.4–15 ≥2.5 San Joaquin Valley, California, USA (Nolte et al., 2001)
Glc 15 11–26 ≤2.5 J¨ulich, Germany (summer) (Kourtchev et al., 2005b)
Glc – 1.3–41 ≤10 Hyyti¨al¨a, Finland (summer) (Carvalho et al., 2003)
Glc 3.7 0.9–7.2 ≤10 Birkenes, Norway (Yttri et al., 2007)
Glc 47 8.4–93 ≤10 Oslo, Norway (Yttri et al., 2007)
Glc 22 5.4–32 ≤10 Elverum, Norway (winter) (Yttri et al., 2007)
Glc 19 10–34 ≤10 Elverum, Norway (summer) (Yttri et al., 2007)
Glc – 28–180 ≤10 Melpitz, Germany (spring) (Carvalho et al., 2003)
Glc 73 30–153 ≤10 Ghent, Belgium (winter) (Pashynska et al., 2002)
Glc 270 110–610 ≤10 Ghent, Belgium (summer) (Pashynska et al., 2002)
Fru – 0.1–5.3 ≥1.0 Maine, USA (Medeiros et al., 2006)
Fru 10 6–20 ≤2.5 J¨ulich, Germany (summer) (Kourtchev et al., 2005b)
Fru 1.4 0.3–3.9 ≤10 Birkenes, Norway (Yttri et al., 2007)
Fru 42 4.6–90 ≤10 Oslo, Norway (Yttri et al., 2007)
Fru 11 3.4–21 ≤10 Elverum, Norway (winter) (Yttri et al., 2007)
Fru 11 3.3–25 ≤10 Elverum, Norway (summer) (Yttri et al., 2007)
Fru 37 10–126 ≤10 Ghent, Belgium (winter) (Pashynska et al., 2002)
Fru 193 39–440 ≤10 Ghent, Belgium (summer) (Pashynska et al., 2002)
Tropical (Brazil), Wet Season
Glc & Fru 32.4 6.9–64 ≤2.5 Reserva Biologica Jar´u, Rondˆonia (1999) (Graham et al., 2002)
Glc & Fru 48.6 17–82 ≤2.5 FNS, Rondˆonia (1999) (Graham et al., 2002)
Fru 4.0 2.5–5.9 ≤2.5 FNS, Rondˆonia (2002) (Decesari et al., 2006)
Glc 15.6 – ≤2.5 Balbina, Amazonas (day) (2001) (Claeys et al., 2004)
Glc 0.6 – ≤2.5 Balbina, Amazonas (night) (2001) (Claeys et al., 2004)
Glc & Fru 12.6a 3.6–26 ≤2.5 Balbina, Amazonas (2001) (Graham et al., 2003b)
Glc & Fru 20 – ≤2.5 Balbina, Amazonas (day) (2001) (Graham et al., 2003b)
Glc & Fru 5.9 – ≤2.5 Balbina, Amazonas (night) (2001) (Graham et al., 2003b)
Glc 29 12–76 TSP Balbina, Amazonas (1998) (Claeys et al., 2004)
Glc 134 – ≥2.5 Balbina, Amazonas (day) (2001) (Claeys et al., 2004)
Glc 2.7 – ≥2.5 Balbina, Amazonas (night) (2001) (Claeys et al., 2004)
Glc & Fru 76.7a 3.6–200 ≥2.5 Balbina, Amazonas (2001) (Graham et al., 2003b)
Glc & Fru 146 – ≥2.5 Balbina, Amazonas (day) (2001) (Graham et al., 2003b)
Glc & Fru 7.2 – ≥2.5 Balbina, Amazonas (night) (2001) (Graham et al., 2003b)
Table A5. Potassium mass concentrations in ambient air observed for different ranges of aerosol particle size (aerodynamic diameter) during
the wet season in Brazil.
Average Concentration Particle Diameter Location and Time References
(ng m−3) (µm)
24.0 0.05–1.2 FNS, Rondˆonia (day) (Fuzzi et al., 2007)
68.0 0.05–1.2 FNS, Rondˆonia (night) (Fuzzi et al., 2007)
33.5 ≤2 FNS, Rondˆonia (Artaxo et al., 2002)
26.2 ≤2 Reserva Biologica Jar´u, Rondˆonia (Artaxo et al., 2002)
27.1 ≤2 Reserva Biologica Jar´u, Rondˆonia (Guyon et al., 2003)
32.1 ≤2 Ducke Forest Reserve, Amazonas (Meteorological Site) (Artaxo et al., 1990)
26.3 ≤2 Ducke Forest Reserve, Amazonas (Tower Site) (Artaxo et al., 1990)
24.2 ≤2 ZF1 site, Amazonas (Artaxo et al., 1990)
18.0 ≤2 Balbina, Amazonas (Formenti et al., 2001)
29.2 ≤2 Balbina, Amazonas (Graham et al., 2003a)
94.0 ≤2 Alta Floresta, Mato Grosso (Echalar et al., 1998)
220.0 ≤2 Alta Floresta, Mato Grosso (Maenhaut et al., 2002)
14.0 1.2–10 FNS, Rondˆonia (day) (Fuzzi et al., 2007)
49.0 1.2–10 FNS, Rondˆonia (night) (Fuzzi et al., 2007)
76.7 2–10 FNS, Rondˆonia (Artaxo et al., 2002)
73.7 2–10 Reserva Biologica Jar´u, Rondˆonia (Artaxo et al., 2002)
107.6 2–10 Reserva Biologica Jar´u, Rondˆonia (Guyon et al., 2003)
112.1 2–15 Ducke Forest Reserve, Amazonas (Meteorological Site) (Artaxo et al., 1990)
94.6 2–15 Ducke Forest Reserve, Amazonas (Tower Site) (Artaxo et al., 1990)
87.3 2–15 ZF1 site, Amazonas (Artaxo et al., 1990)
69.0 2–10 Balbina, Amazonas (Formenti et al., 2001)
52.6 2–10 Balbina, Amazonas (Graham et al., 2003a)
270.0 2–10 Alta Floresta, Mato Grosso (Echalar et al., 1998)
240.0 2–10 Alta Floresta, Mato Grosso (Maenhaut et al., 2002)
Table A6. Chloride mass concentrations in ambient air observed for different ranges of aerosol particle size (aerodynamic diameter) during
the wet season in Amazonia.
Average Concentration Particle Diameter Location and Time References
(ng m−3) (µm)
5.5 ≤2 FNS, Rondˆonia (Artaxo et al., 2002)
5.1 ≤2 Reserva Biologica Jar´u, Rondˆonia (Artaxo et al., 2002)
9.5 ≤2 Ducke Forest Reserve, Amazonas (Meteorological Site) (Artaxo et al., 1990)
13.0 ≤2 Ducke Forest Reserve, Amazonas (Tower Site) (Artaxo et al., 1990)
8.9 ≤2 ZF1 site, Amazonas (Artaxo et al., 1990)
65.0 ≤2 Balbina, Amazonas (Formenti et al., 2001)
4.8 ≤2 Balbina, Amazonas (Graham et al., 2003a)
2.3 ≤2 Alta Floresta, Mato Grosso (Echalar et al., 1998)
37.0 ≤2 Alta Floresta, Mato Grosso (Maenhaut et al., 2002)
14.3 2–10 FNS, Rondˆonia (Artaxo et al., 2002)
9.4 2–10 Reserva Biologica Jar´u, Rondˆonia (Artaxo et al., 2002)
7.8 2–10 Reserva Biologica Jar´u, Rondˆonia (Guyon et al., 2003)
55.0 2–15 Ducke Forest Reserve, Amazonas (Meteorological Site) (Artaxo et al., 1990)
33.2 2–15 Ducke Forest Reserve, Amazonas (Tower Site) (Artaxo et al., 1990)
52.5 2–15 ZF1 site, Amazonas (Artaxo et al., 1990)
155.0 2–10 Balbina, Amazonas (Formenti et al., 2001)
59.1 2–10 Balbina, Amazonas (Graham et al., 2003a)
41.0 2–10 Alta Floresta, Mato Grosso (Echalar et al., 1998)
Table A7. Total particulate matter mass concentrations in ambient air observed for particles with aerodynamic diameters of 1–2 µm to 10–15 µm during the wet season in Amazonia.
Mass Concentration Particle Diameter Location and Time References
(ng m−3) (µm)
1.0 1.2–10 FNS, Rondˆonia, (DLPI, day) (Fuzzi et al., 2007)
4.3 1.2–10 FNS, Rondˆonia (DLPI, night) (Fuzzi et al., 2007)
1.8 1.2–10 FNS, Rondˆonia (MOUDI, day) (Fuzzi et al., 2007)
6.9 1.2–10 FNS, Rondˆonia (MOUDI, night) (Fuzzi et al., 2007)
5.7 2–10 FNS, Rondˆonia (Artaxo et al., 2002)
5.1 2–10 Reserva Biologica Jar´u, Rondˆonia (Artaxo et al., 2002)
6.6 2–10 Reserva Biologica Jar´u, Rondˆonia (Guyon et al., 2003)
8.0 2–15 Ducke Forest Reserve, Amazonas (Meteorological Site) (Artaxo et al., 1990)
7.6 2–15 Ducke Forest Reserve, Amazonas (Tower Site) (Artaxo et al., 1990)
6.5 2–15 ZF1 site, Amazonas (Artaxo et al., 1990)
5.8 2–10 Balbina, Amazonas (Formenti et al., 2001)
2.8 2–10 Balbina, Amazonas (day) (Graham et al., 2003a)
5.5 2–10 Balbina, Amazonas (night) (Graham et al., 2003a)
16.4 2–10 Alta Floresta, Mato Grosso (Echalar et al., 1998)
15.1 2–10 Alta Floresta, Mato Grosso (Maenhaut et al., 2002)
Acknowledgements. We gratefully acknowledge helpful comments
and suggestions from C. Morris, M. Bardin, and from an anony-mous referee. This study is based on results from the Large-Scale Atmosphere-Biosphere Experiment in Amazonia (LBA) and was funded by the Max Planck Society. P. Taylor acknowledges finan-cial support by a grant from the Southern California Environmental Health Sciences Center (NIEHS 5P30 ES07048), a Boswell Fellow-ship from Caltech and the Huntington Medical Research Institute. P. Taylor also thanks R. C. Flagan, Caltech, and E. Newbigin, Uni-versity of Melbourne. Special thanks are due to T. W. Andreae for help with the preparation of the manuscript.
Edited by: A. B. Guenther
References
Adams, K. F., Hyde, H. A., and Williams, D. A.: Woodlands as a source of allergens with special reference to basidiospores, Acta Allergologica, 23, 265–281, 1968.
Andreae, M. O., Artaxo, P., Brand˜ao, C., Carswell, F. E., Cic-cioli, P., da Costa, A. L., Culf, A. D., Esteves, J. L., Gash, J. H. C., Grace, J., Kabat, P., Lelieveld, J., Malhi, Y., Manzi, A. O., Meixner, F. X., Nobre, A. D., Nobre, C., Ruivo, M. d. L. P., Silva-Dias, M. A., Stefani, P., Valentini, R., von Jouanne, J., and Waterloo, M. J.: Biogeochemical cycling of carbon, water, energy, trace gases and aerosols in Amazonia: The LBA-EUSTACH experiments, J. Geophys. Res., 107, 8066, doi:10.1029/2001JD000524, 2002.
Andreae, M. O. and Crutzen, P. J.: Atmospheric aerosols: Bio-geochemical sources and role in atmospheric chemistry, Science, 276, 1052–1058, 1997.
Ariya, P. A. and Amyot, M.: New Directions: The role of
bioaerosols in atmospheric chemistry and physics, Atmos.
En-viron., 38, 1231–1232, 2004.
Artaxo, P. and Hansson, H.-C.: Size distribution of biogenic aerosol particles from the Amazon basin, Atmos. Environ., 29, 393-402, 1995.
Artaxo, P., Maenhaut, W., Storms, H., and Grieken, R. V.: Aerosol characteristics and sources for the Amazon Basin during the wet season, J. Geophys. Res., 95, 16 971–16 986, 1990.
Artaxo, P., Martins, J. V., Yamasoe, M. A., Procopio, A. S., Pauliquevis, T. M., Andreae, M. O., Guyon, P., Gatti, L. V., and Leal, A. M. C.: Physical and chemical properties of aerosols in the wet and dry seasons in Rondonia, Amazonia, J. Geophys. Res., 107, 8081, doi:10.1029/2001JD000666, 2002.
Aylor, D. E. and Flesch, T. K.: Estimating spore release rates using a Lagrangian stochastic simulation model, J. Appl. Meteorol., 40, 1196–1208, 2001.
Aylor, D. E., Fry, W. E., Mayton, H., and Andrade-Piedra, J. L.: Quantifying the rate of release and escape of Phytophthora
infes-tans sporangia from a potato canopy, Phytopathology, 91, 1189–
1196, 2001.
Bai, F. Y., Takashima, M., Jia, J. H., and Nakase, T.: Dioszegia
zsoltii sp nov, a new ballistoconidium-forming yeast species with
two varieties, J. General Appl. Microbiol., 48, 17–23, 2002. Barnett, J. A. and Robinow, C. F.: A history of research on yeasts
4: cytology part I, 1890–1950, Yeast, 19, 151–182, 2002. Bauer, H., Kasper-Giebl, A., Loflund, M., Giebl, H., Hitzenberger,
R., Zibuschka, F., and Puxbaum, H.: The contribution of bacteria and fungal spores to the organic carbon content of cloud water, precipitation and aerosols, Atmos. Res., 64, 109–119, 2002. Bauer, H., Weinke, G., Scheller, L., Berger, A., Kasper-Giebel, A.,
Puxbaum, H., Vermeylen, R., Claeys, M., and Maenhaut, W.: Contribution of bioaerosols to organic carbon in urban-fringe aerosols, European Aerosol Conference, 2005.
Bauer, R. and Oberwinkler, F.: The Ustomycota: An inventory, My-cotaxon, 64, 303–319, 1997.
from plants into the atmosphere, Nature, 256, 35–37, 1975. Boekhout, T.: A revision of ballistoconidia-forming yeasts and
fungi, Studies in Mycology, 33, 1–194, 1991.
Boreson, J., Dillner, A. M., and Peccia, J.: Correlating bioaerosol load with PM2.5 and PM10cf concentrations: a comparison be-tween natural desert and urban-fringe aerosols, Atmos. Environ., 38, 6029–6041, 2004.
Brown, J. K. M. and Hovmoller, M. S.: Epidemiology - Aerial dis-persal of pathogens on the global and continental scales and its impact on plant disease, Science, 297, 537–541, 2002.
Buller, A. H. R.: Researches on fungi, Longmans, Green and Co., London, 1909.
Buller, A. H. R.: Researches on fungi, Longmans, Green and Co., London, 1909-1950.
Buller, A. H. R.: Die Erzeugung und Befreiung der Sporen bei
Coprinus sterquilinus, Jahrb¨ucher f¨ur wissenschaftliche Botanik,
56, 299–329, 1915.
Buller, A. H. R.: Researches on fungi, Longmans, Green and Co., London, 1922.
Buller, A. H. R.: Physiological studies of fungi, Nature, 134, 291– 291, 1934.
Buller, A. H. R. and Vanterpool, T. C.: Violent spore-discharge in
Tilletia tritic, Nature, 116, 934–935, 1925.
Burch, M. and Levetin, E.: Effects of meteorological conditions on spore plumes, Int. J. Biometeorol., 46, 107–117, 2002.
Burge, H. A.: An update on pollen and fungal spore aerobiol-ogy, Journal of Allergy and Clinical Immunolaerobiol-ogy, 110, 544–552, 2002.
Butinar, L., Spencer-Martins, I., and Gunde-Cimerman, N.: Yeasts in high Arctic glaciers: the discovery of a new habitat for eukary-otic microorganisms, Antonie Van Leeuwenhoek, 91, 277–289, 2007.
Byrne, J. M., Hausbeck, M. K., and Shaw, B. D.: Factors affecting concentrations of airborne conidia of Oidium sp. among poinset-tias in a greenhouse, Plant Disease, 84, 1089–1095, 2000. Calderon, C., Lacey, J., McCartney, H. A., and Rosas, I.: Seasonal
and diurnal variation of airborne basidiomycete spore concentra-tions in Mexico City, Grana, 34, 260–268, 1995.
Carlile, M. J., Watkinson, S. C., and Gooday, G. W.: The Fungi, Elsevier Ltd., Amsterdam, 2001.
Carvalho, A., Pio, C., and Santos, C.: Water-soluble hydroxylated organic compounds in German and Finnish aerosols, Atmos. En-viron., 37, 1775–1783, 2003.
Chatterjee, J. and Hargreave, F. E.: Atmospheric pollen and fungal spores in Hamilton in 1972 estimated by the Hirst automatic vol-umetric spore trap, Canadian Medical Association Journal, 110, 659–663, 1974.
Claeys, M., Graham, B., Vas, G., Wang, W., Vermeylen, R., Pashyn-ska, V., Cafmeyer, J., Guyon, P., Andreae, M. O., Artaxo, P., and Maenhaut, W.: Formation of secondary organic aerosols through photooxidation of isoprene, Science, 303, 1173–1176, 2004. Couch, J. N.: A new Conidiobulus with sexual reproduction, Am.
J. Botany, 26, 119–130, 1939.
Cox, C. S. and Wathes, C. M.: Bioaerosol Handbook, CRC Lewis Publishers, Boca Raton, 1995.
Davoli, P. and Weber, R. W. S.: Carotenoid pigments from the red mirror yeast Sporobolomyces roseus, Mycologist, 16, 102–108, 2002.
de Garcia, V., Brizzio, S., Libkind, D., Buzzini, P., and van Broock,
M.: Biodiversity of cold-adapted yeasts from glacial meltwater rivers in Patagonia, Argentina, FEMS Microbiology Ecology, 59, 331–341, 2007.
de Jong, M. D., Bourdot, G. W., and Powell, J.: A model of the es-cape of Sclerotinia sclerotiorum ascospores from pasture, Ecol. Modell., 150, 83–105, 2002.
Decco, M. L., Wendland, B. I., and O’Connell, E. J.: Volumet-ric assessment of airborne pollen and spore levels in Rochester, Minnesota, 1992 through 1995, Mayo Clinic Proceedings, 73, 225–229, 1998.
Decesari, S., Fuzzi, S., Facchini, M. C., Mircea, M., Emblico, L., Cavalli, F., Maenhaut, W., Chi, X., Schkolnik, G., Falkovich, A., Rudich, Y., Claeys, M., Pashynska, V., Vas, G., Kourtchev, I., Vermeylen, R., Hoffer, A., Andreae, M. O., Tagliavini, E., Moretti, F., and Artaxo, P.: Characterization of the organic com-position of aerosols from Rondonia, Brazil, during the LBA-SMOCC 2002 experiment and its representation through model compounds, Atmos. Chem. Phys., 6, 375–402, 2006,
http://www.atmos-chem-phys.net/6/375/2006/.
Despr´es, V., Nowoisky, J., Klose, M., Conrad, R., Andreae, M. O., and P¨oschl, U.: Molecular genetics and diversity of primary bio-genic aerosol particles in urban, rural, and high-alpine air, Bio-geosciences Discuss., 4, 349–384, 2007,
http://www.biogeosciences-discuss.net/4/349/2007/.
Dingle, A. N.: Pollens as condensation nuclei, Journal de
Recherches Atmosph´eriques, 2, 231–237, 1966.
Dusek, U., Frank, G. P., Hildebrandt, L., Curtius, J., Schneider, J., Walter, S., Chand, D., Drewnick, F., Hings, S., Jung, D., Bor-rmann, S., and Andreae, M. O.: Size matters more than chem-istry for cloud-nucleating ability of aerosol particles, Science, 312, 1375–1378, 2006.
Echalar, F., Artaxo, P., Martins, J. V., Yamasoe, M., Gerab, F., Maenhaut, W., and Holben, B.: Long-term monitoring of atmo-spheric aerosols in the Amazon Basin: Source identification and apportionment, J. Geophys. Res., 103, 31 849–31 864, 1998. Ehrenberg, C. G.: Neue Beobachtungen ¨uber blutartige
Erschei-nungen in Aegypten, Arabien und Sibirien, nebst einer Ueber-sicht und Kritik der fr¨uher bekannten, Annalen der Physik und Chemie, 94, 477–514, 1830.
Elbert, W.: Interactive comment on “Contribution of fungi to pri-mary biogenic aerosols in the atmosphere: active discharge of spores, carbohydrates, and inorganic ions by Asco- and Basid-iomycota” by W. Elbert et al., Atmos. Chem. Phys. Discuss., 6, S5329–S5331, 2006.
Fang, Z., Ouyang, Z., Hu, L., Wang, X., Zheng, H., and Lin, X.: Culturable airborne fungi in outdoor environments in Beijing, China, Science of The Total Environment, 350, 47–58, 2005. Fernando, W. G. D., Miller, J. D., Seaman, W. L., Seifert, K., and
Paulitz, T. C.: Daily and seasonal dynamics of airborne spores of Fusarium graminearum and other Fusarium species sampled over wheat plots, Canadian Journal of Botany, 78, 497–505, 2000.
Fischer, M., Cox, J., Davis, D. J., Wagner, A., Taylor, R., Huerta, A. J., and Money, N. P.: New information on the mechanism of forcible ascospore discharge from Ascobolus immersus, Fungal Genetics and Biology, 41, 972–972, 2004.
Fish, B. R.: Electrical generation of natural aerosols from vegeta-tion, Science, 175, 1239–1240, 1972.