HAL Id: hal-01764846
https://hal.archives-ouvertes.fr/hal-01764846
Submitted on 12 Apr 2018
HAL is a multi-disciplinary open access
archive for the deposit and dissemination of
sci-entific research documents, whether they are
pub-lished or not. The documents may come from
teaching and research institutions in France or
abroad, or from public or private research centers.
L’archive ouverte pluridisciplinaire HAL, est
destinée au dépôt et à la diffusion de documents
scientifiques de niveau recherche, publiés ou non,
émanant des établissements d’enseignement et de
recherche français ou étrangers, des laboratoires
publics ou privés.
with carboxylic acids detected by ion chromatography in
solution after contact with multilayer films after
γ-irradiation
Samuel Dorey, Fanny Gaston, Nathalie Dupuy, Magali Barbaroux, Sylvain
R.A. Marque
To cite this version:
Samuel Dorey, Fanny Gaston, Nathalie Dupuy, Magali Barbaroux, Sylvain R.A. Marque.
Reconcilia-tion of pH, conductivity, total organic carbon with carboxylic acids detected by ion chromatography
in solution after contact with multilayer films after γ-irradiation. European Journal of Pharmaceutical
Sciences, Elsevier, 2018, 117, pp.216-226. �10.1016/j.ejps.2018.02.023�. �hal-01764846�
Contents lists available atScienceDirect
European Journal of Pharmaceutical Sciences
journal homepage:www.elsevier.com/locate/ejpsReconciliation of pH, conductivity, total organic carbon with carboxylic
acids detected by ion chromatography in solution after contact with
multilayer
films after γ-irradiation
Samuel Dorey
a,⁎, Fanny Gaston
a,b,c, Nathalie Dupuy
b,⁎, Magali Barbaroux
a,
Sylvain R.A. Marque
c,daSartorius Stedim FMT S.A.S, Z.I. Les Paluds, Avenue de Jouques CS91051, 13781 Aubagne Cedex, France bAix Marseille Univ, CNRS, IRD, Avignon Université, IMBE UMR 7263, 13397 Marseille, France cAix Marseille Univ, CNRS, ICR, case 551, 13397 Marseille, France
dVorozhtsov Novosibirsk Institute of organic chemistry, Office 312, 9 Prospect Academican Laurentiev, 630090 Novosibirsk, Russia
A R T I C L E I N F O
Keywords: γ-Irradiation Polyethylene Ethylene vinyl acetate Ion chromatography Carboxylic acid
A B S T R A C T
The impact ofγ-irradiation on polymers in multilayer films was studied by means of the study of the diffusion and release (spontaneous migration of the molecules from the container into the product) of chemical species in aqueous solution. A series of different measurements have been performed: pH, conductivity, total organic carbon (TOC) and ion chromatography (IC). Their evolution according toγ-irradiation dose was studied. More several rinsings made over several months allowed to quantify well the impact of the irradiation on these polymers. The samples are irradiated at severalγ-doses, up to 270 kGy, and compared with a non-irradiated sample used as reference. It shows that quantity of generated carboxylic acids depends on thefilm material (PE/ EVOH/PE and EVA/EVOH/EVA) and increases withγ-dose.
1. Introduction
For a number of various uses (storage, mixing, freezing, transpor-tation, formulation, andfilling) biopharmaceutical solutions are stored in sterile single-use plastic bags. When using disposable single use plastics in biopharmaceutical applications, the contents are in contact with containers that are likely to interact with it. Material transfers can then occur between containers and contents. These migrations, of dif-ferent types, depend on the physicochemical characteristics of the material (composition, pH, solubility, viscosity, molecular weight, etc.), the nature of the product (solid, semi-solid and liquid) and the condi-tions of the material utilization. Transfers of the matter can occur by adsorption, diffusion and release of chemical species (migration of the molecules from the container into the product). Interactions must be identified and evaluated for their potential impact. In the case of single-use polymers, sterilization of the polymer is often carried out. The in-teractions could be therefore influenced by the dose and the contact time between the container and the contents.
The classicalγ-irradiation dose range used for biopharmaceutical industries is between 25 and 45 kGy (Guide to Irradiation and
Sterilization Validation of Single-use Bioprocess Systems, 2008),
according to the regulation. The major advantage of radio-sterilization is the penetration power of theγ-radiation reaching thus all parts of the plastic single-use systems. Unfortunately, this process can induce modifications in the materials, as reported in the literature (Traboulsi et al., 2012), γ-sterilization of single-use systems initiates chemical reactions (Audran et al., 2015) and complex modifications inside the
plastic material, leading to either an increase or a decrease in the mo-lecular weight of polymers (Driffield et al., 2009;Suarez & Mano, 2001) as well as to modifications of the additives or damage to the polymers themselves (Hemmerich, 2000;Stoffers et al., 2004;Demertzis et al., 1999). In this study,γ-irradiation doses investigated are up to 270 kGy in order to emphasize theγ-irradiation effect and to better investigate the modifications of commercial PE(Polyethylene)/EVOH(Ethylene Vinyl Alcohol)/PE-film and commercial EVA(Ethylene Vinyl Acetate)/ EVOH/EVAfilm from three different batches, respectively. This study is a part of a global investigation on γ-irradiation on multilayer films (Audran et al., 2015;Gaston et al., 2016a;Gaston et al., 2016b;Gaston et al., 2017). Non-specific (TOC, pH, conductivity) or specific (e.g. chromatographic, spectroscopic, gravimetric) analytical methods can be used. In literature (Madera-Santana et al., 2016; Salafranca et al., 2015), several approaches were used to study the impact of
γ-https://doi.org/10.1016/j.ejps.2018.02.023
Received 15 November 2017; Received in revised form 20 February 2018; Accepted 20 February 2018
⁎Corresponding authors.
E-mail addresses:samuel.dorey@sartorius.com(S. Dorey),nathalie.dupuy@univ-amu.fr(N. Dupuy).
Available online 23 February 2018
0928-0987/ © 2018 Published by Elsevier B.V.
irradiation on multilayer films, as ion chromatography to detect and quantify the ionic species, and as pH and conductivity measurements to observe the consequences of the chemical modifications. γ-irradiation on multilayerfilms leads to chemical modifications, which their cor-relation is achieved using chemometric methods. The chemometric tools used in this study and applied to the set of physico-chemical features is the Principal Component Analysis (PCA). The influential factors are mostly theγ-dose and the natural ageing. These factors are correlated with the pH and conductivity variations. The impact of the γ-sterilization on placticfilms is most of the time directly characterized from a materiel viewpoint while the interaction of films with their environment depending on the γ-irradization dose is weakly in-vestigated. There are few references available on the leaching of car-boxylic acid species impacting aqueous solutions used in biopharma-ceutical applications in contact with plastic single-use systems (Jenke et al., 2004;Jenke & Barge, 2014). Stability studies under accelerated or real-time degradation conditions make it possible to define the shelf life and storage conditions in order to guarantee the quality of the product. The aim of the study is to identify and quantify the acid compounds that can be released from the container under normal conditions of use of the materials: the extractables.
2. Materials and methods
2.1. Samples
The single-use plastic bags used in this study are manufactured with two different multilayer films (Fig. 1). PE-film is composed of poly-ethylene (PE) and poly-ethylene vinyl alcohol (EVOH), with a thickness of about 400μm. EVA-film is composed of ethylene vinyl acetate (EVA) and EVOH, with a thickness of approximatively 360μm. To evaluate if there is a lot effect, three lots of each multilayer film are used to manufacture the bags.
2.2. γ-Irradiation
Sheets of PE-film and EVA-film are packed and wrapped in packa-ging without applying a vacuum and irradiated at room temperature in a60Coγ-source. The60Coγ-source provided a dose rate of 8–13 kGy/h as given by Synergy Health society (Marseille, France) affording doses at 30 ( ± 1), 50 ( ± 1), 115 ( ± 2) and 270 ( ± 5) kGy. Desired dose is obtained by several sterilization cycles, including a non-controlled waiting time in non-controlled storage conditions between each cycle. A sterilization cycle corresponds approximately to 25 kGy. During ir-radiation, there is an increase of the temperature in the cardboxes of ~5 °C.
2.3. Filling of single-use plastic bags and storage conditions
The single-use plastic bags arefilled in with a volume of water for injection (WFI) to have a ratio 6/1 surface/volume. 118 mL of WFI are introduced in PE-plastic bags and 322 mL in EVA-plastic bags. To ob-serve the impact of the ageing time, after thefilling, non-irradiated and irradiated bags are stored for 1, 7, 21 and 120 days at 40 °C.
2.4. pHmetry– conductimetry – ion chromatography (IC) – total organic carbon (TOC)
pH has been measured with Metrohm master station with 867 pH module and with an Aquatrode electrode. Conductivity has been mea-sured with Metrohm master station with 856 Conductivity module and with a Metrohm electrode.
Ion chromatography (IC) has been performed with ICS5000, Thermo Scientific apparatus. Each acid listed in Table 1 has been monitored. An AS15 capillary column has been used to track ethanoic acid, 2-hydroxypropanoic acid, maleic acid, hexanoic acid, and all other acids listed has been tracked with an AS19 4 mm column. A gradient of potassium hydroxide, KOH, with an elution rate of 1 mL/
PE-film:
n
PE
EVOH
m
p
OH
12
0µ
m
Contact layer
Backbone
25
µ m
255
µ m
EVA-film:
EVOH EVABackbone
Contact layer
m p O O m p OH 22 µ m 5µm 333 µ mmin on AS19 and 0.012 mL/min on AS15 has been used. The detection was achieved by a conductivity detector. The limit of quantification was 10μg/L in water. The measured minimum, the average and the max-imum quantities of each acid are also indicated inTable 1.
TOC measurements are carried out according to BPA 0317-003 at the TOC-V CSH Shimadzu. Different calibration curves are used in order tofit to the TOC measured. If the content of TOC is too high a dilution step (usually 1:10) was automatically carried out by the system using deionized water.
2.5. Principal component analysis
Principal component analysis (PCA) is used as exploratory data analysis. PCA (Gaston et al., 2016a; Gaston et al., 2016b;Martens & Naes, 1989; Kumar et al., 2014;Esbensen et al., 2002) is a variable reduction technique used to reduce a larger set of variables into a smaller set of variables called “principal component”. The principal components represent the most variance in the original variables. All computations were performed using SIMCA 14.1.
3. Results and discussion
Bags either not sterilized (i.e. 0 kGy) or irradiated at 30, 50, 115 and 270 kGy, werefilled with pure water (WFI, water for injection) and stored at 40 °C for 1, 7, 21 and 120 days. Ion chromatography (IC) has been per-formed in order to understand influence of γ-rays and ageing time on ionic species potentially generated. Conductivity, pH, Total Organic Carbon (TOC) measurements are complementary to the IC results.
3.1. EVA-film
3.1.1. PCA on pH, conductivity, TOC and IC data
Given the large number of parameters and thereof the very large amount of data, it is quantitatively difficult to define the correlation between factors. Thus, a PCA is performed on pH, conductivity, total carboxylic acid concentration as detected by ion chromatography (ab-breviation used: ICtot WFI), TOC data on EVA-film which all report the modifications caused by the γ-irradiation and the storage time (Fig. 2). This method affords quantitative information about the variability as-sociated to each factor and shows the inter-dependence of the different parameters.
The PCA performed on physico-chemical data shows that thefirst two components explain 97% of the data variation (Fig. 2a). The samples are grouped according to the TOC, ICtot, the conductivity and pH. Thefirst principal component represents 92% of the total variance. The first
component (92%) is associated to the modification caused by γ-irradiation dose. The samples are displayed according to the sequence ofγ-doses: from 0 to 270 kGy in theFig. 2a, that is, modifications increase with γ-irradiation. Fig. 2a shows a clear distinction of samples irradiated at 30 kGy and at 50 kGy.Fig. 2a shows as well there is dispersion inside each series of data corresponding to eachγ-irradiation dose. It can lead us to presume that a small variation of theγ-irradiation can provoke clearly observable physi-cochemical modifications of the EVA-film.
The second principal component represents 5% of the total variance of the physico-chemical modification and is associated to the storage
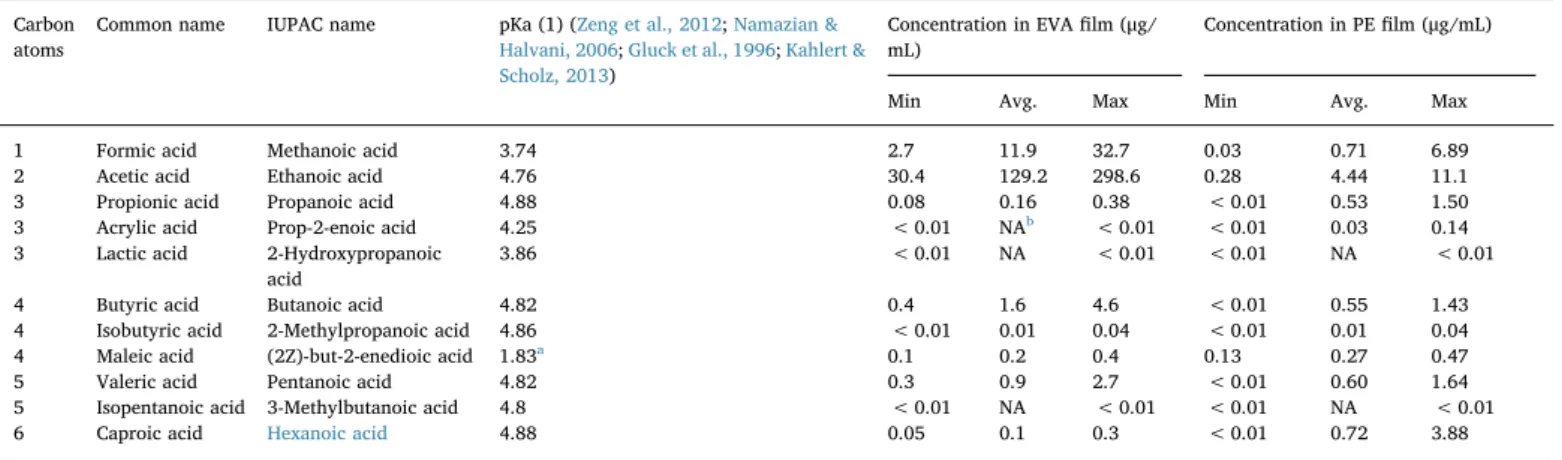
Table 1
List of targeted carboxylic acids. The minimum, the average and the maximum quantities of each acid, and for eachfilm, are picked up in the data set represented by all film lots, all storage times and all gamma-irradiation doses.
Carbon atoms
Common name IUPAC name pKa (1) (Zeng et al., 2012;Namazian & Halvani, 2006;Gluck et al., 1996;Kahlert & Scholz, 2013)
Concentration in EVAfilm (μg/ mL)
Concentration in PEfilm (μg/mL) Min Avg. Max Min Avg. Max 1 Formic acid Methanoic acid 3.74 2.7 11.9 32.7 0.03 0.71 6.89 2 Acetic acid Ethanoic acid 4.76 30.4 129.2 298.6 0.28 4.44 11.1 3 Propionic acid Propanoic acid 4.88 0.08 0.16 0.38 < 0.01 0.53 1.50 3 Acrylic acid Prop-2-enoic acid 4.25 < 0.01 NAb < 0.01 < 0.01 0.03 0.14
3 Lactic acid 2-Hydroxypropanoic acid
3.86 < 0.01 NA < 0.01 < 0.01 NA < 0.01 4 Butyric acid Butanoic acid 4.82 0.4 1.6 4.6 < 0.01 0.55 1.43 4 Isobutyric acid 2-Methylpropanoic acid 4.86 < 0.01 0.01 0.04 < 0.01 0.01 0.04 4 Maleic acid (2Z)-but-2-enedioic acid 1.83a 0.1 0.2 0.4 0.13 0.27 0.47
5 Valeric acid Pentanoic acid 4.82 0.3 0.9 2.7 < 0.01 0.60 1.64 5 Isopentanoic acid 3-Methylbutanoic acid 4.8 < 0.01 NA < 0.01 < 0.01 NA < 0.01 6 Caproic acid Hexanoic acid 4.88 0.05 0.1 0.3 < 0.01 0.72 3.88
apKa (2) = 6.59. bNA = not applicable.
a)
1 day
b)
Fig. 2. PCA performed on pH, conductivity and TOC measurements obtained for 3 bat-ches at allγ-doses and at all ageing time. a) Score plots with γ-doses labels in kGy. The group surrounded by a solid line corresponds to the ageing = 1 day and the group sur-rounded by a dashed line corresponds to the ageing≥ 21 days. b) Correlation loading (ellipses represent respectively 50%, 75%, 100% of the correlation).
time. The influence of this parameter is weak and secondary compared to the influence of the γ-irradiation dose. With high storage time pH, TOC and carboxylic acid content are weakly concerned and con-ductivity increases. Indeed experiments are split into two families: one with impact of theγ-dose for 1 day (full line circle,Fig. 2a) and one for impact of the γ-dose for > 7 days (dotted line,Fig. 2a). Conductivity has been calculated at different storage time in order to compare the quantity of extracted ions for a specific ageing. It was calculated that > 80% of the ionic species are extracted during the first 7 days. Storage should be also related to diffusion of the inorganic species from thefilm to the extraction solution. As the higher the coefficient diffu-sion of a species, the higher its diffusion from the film to the solution, it is assumed that most of the extractables have a high diffusion factor meaning that most part of extractables is obtained in 7 days.
Fig. 2b presents the correlation between the different
physico-che-mical measurements. The TOC, ICtot, and conductivity are almost correlated, while pH is anti-correlated with these physico-chemical parameters, as expected.
The growing influence of the γ-irradiation dose can be easily dis-tinguished on the conductivity, pH, the total acid concentration as detected per ion chromatography (ICtot) and TOC. It can be drawn that carboxylic acids detected by ion chromatography explain the pH shift in solutions. It is well known that the γ-irradiation may cause polymer oxidation (Ishigaki & Yoshii, 1992; Da Silva Aquino, 2012). The in-crease of the carboxylic acids concentration generated during the γ-irradiation process has been observed by infrared spectroscopy in a former paper (Gaston et al., 2016a) The influence of the γ-irradiation
dose on pH shift is therefore observed as expected (cf.Fig. 3): the higher theγ-irradiation dose, the lower the pH. The pH decreases with car-boxylic acids concentration generated during theγ-irradiation process. In parallel, the conductivity increases (Fig. 4).
Acids with the highest concentration are ethanoic acid (10−3M) and methanoic acid (10−4M). Concentration in other acids vary be-tween 10−5 and 10−8M. Acids with the lowest pKa are maleic (pKa = 1.83), methanoic (pKa = 3.74) and lactic acid (pKa = 3.86). Other acids' pKa are between 4 and 5 (Table 1). A ranking based on concentration and on pKa points out that the predominant acids de-tected by ion chromatography and influencing the pH are the ethanoic and methanoic acids. Other acids listed inTable 1do not make the pH changing significantly as their concentrations are too low.
The direct proportionality can be observed for storage times≤1 day during which solvation of acids onfilm surface is considered to be the main phenomenon (Fig. 2a). For longer storage time, i.e.≥7 days, a diffusion phenomenon from the film core takes place in addition of the direct solvation of acids on thefilm surface.
3.1.2. Reconciliation between pH, TOC and IC
As carboxylic acids are organic compounds, Total Organic Carbon (TOC) results can be then compared to ICtot (total carboxylic acids amount) to know to what extent carboxylic acids are quantitated compared to other organic extractables.Fig. 5a shows clearly there is a correlation between pH, total carboxylic acids amount and TOC.Fig. 5a shows as well that the TOC, the pH and hence the quantity of carboxylic acids are linked to theγ-irradiation dose: when the γ-doses increase, the hydronium ion concentration and the TOC increase in solution through the generation and the release of the carboxylic acids.Fig. 5b shows there is a direct proportionality between the quantity of released car-boxylic acids and the TOC.
Fig. 6 compares measured and calculated TOC values. The
calcu-lated TOC data have been calcucalcu-lated from the total carbon mass available in carboxylic acids detected by ion chromatography analysis1.
General tendency would show that > 90% of the carbon amount measured by TOC measurements is equal to carbon amount calculated from ion chromatography data. It means that most of the extractables are therefore carboxylic acids, especially at t0 depicted by data points which fit to the hypothetical curve x = y (x = measured TOC, y = calculated TOC). For longer storage times, there is a deviation between thefitting curve and the hypothetical curve x = y. The de-viation is also emphasized with increasingγ-doses. It means the carbon amount calculated from carboxylic acids represents a lower percentage of the total organic carbon amount measured at highγ-dose. It can be assumed there is more carbon, at long ageing extraction and at high γ-doses, which belongs to other species not identified as carboxylic acids. Irradiation dose could impact the quantity of generated non-acid or-ganic extractables, which could diffuse slower than carboxylic acids into thefilm, and consequently be extracted at a longer time than them. Hence, all non-carboxylic acid extractables could be neglected at moderate ageing (≤21 days), but not at higher ageing (> 21 days), even if carboxylic acids still are in great majority. This tendency is also depicted inFig. 2b. 1x10⁻⁴ 2x10⁻⁴ 3x10⁻⁴ 4x10⁻⁴ 5x10⁻⁴ 4.0 3.7 3.5 3.4 3.3 0 100 200 300 400 γ irradiation dose: 0 kGy 30 kGy 50 kGy 115 kGy 270 kGy (pH)
Total carboxylic acid concentration (µg/mL)
[H3O+
] (mol/L)
Fig. 3. Total carboxylic acid content vs [H3O+] (pH is indicated as well for information)
for different γ-doses. The total carboxylic acid content is the sum of each acid con-centration detected by ion chromatography. pH scale is indicated as well for information. The dashed line shows the trend.
1x10⁻⁴ 2x10⁻⁴ 3x10⁻⁴ 4x10⁻⁴ 5x10⁻⁴ 4.0 3.7 3.5 3.4 3.3 0 50 100 150 γ−irradiation dose: 0 kGy 30 kGy 50 kGy 115 kGy 270 kGy (pH) Conductivity (µS/cm) [H3O+] (mol/L) Storage time
Fig. 4. Conductivity vs [H3O+] (pH is indicated as well for information) for different
γ-doses. The dashed lines highlight tendencies.
1TOC =C. =C.
with IC Mci
Mwi
nCi . mC
Mwi , where i identifies each carboxylic acid,
MCi= mass of carbon in i, mc = molar mass of carbon, nCi= number of carbon atoms in
3.1.3. Calculation of pH and conductivity from IC data
The acid concentration is between 10−3and 10−7M. pH-changing are mainly due to the release of ethanoic and methanoic acids. (~5.10−3and ~5.10−4M) compared to other acids of ion chromato-graphy analysis (Table 1). Hexanoic, pentanoic, butanoic, and propa-noic acids are present in the same order of concentration (10−5M) and therefore contribute to the pH shift to the same extent. The other de-tected acids (maleic, lactic, acrylic…) have a very low concentration (between 10−6and 10−7M) and their effect on the pH-changing is disregarded. Maleic, methanoic and lactic acids have the highest pKa (i.e. between 1.5 and 4) and other acids' pKa are between 4 and 5. Blank samples of WFI have a pH of 5.5–6 and the pH drops from 5.5 to 3.2 when in contact with the EVA-film.
The theoretical pH can be calculated from carboxylic acid con-centration measured by IC (ion chromatography) with Eq.(1) or (2). Range of application of the approximate formulae in acid-base equili-bria is available in references (Kahlert & Scholz, 2013;Cardinali et al., 1995;Narasaki, 1987;Claeys, 1985). = + [H O ]3 Ka·Ca (1) = − + + + [H O ] Ka Ka 4Ka·Ca 2 3 2 (2) = − + + − + [H O ] K K 4K (C α) 2 3 a a2 a a (3) = + − − K α(α 10 ) C α a 7 a (4)
In Eq.(2), the acid concentration Cacan be replaced by its activity (aa= Ca− α) (Eq. (3)).α being the dissociation coefficient is calcu-lated from Eq.(4). Calculations made from Eq.(1)affords pH values differing up to 0.5 pH unit from the measured ones and this approach is disregarded. The theoretical pHs calculated from Eqs.(2) and (3)are compared with experimented data (Fig. 7).
The pH evolution model obtained with Eq.(2)agrees at 95% with experimental data with a typical difference of 0.2 pH unit. The pH evolution model obtained with Eq.(3)fits to the measured pH evolution
with a typical difference of 0.01–0.1 pH unit. The calculations confirm that the pH shift is a direct consequence of the carboxylic acid release in solutions from the EVA-film.
Theoretical conductivity can be likewise calculated with the general equation (Eq.5) as the sum of the conductivity induced by ionic species in aqueous solution. It then takes into account the acid concentration
a)
1x10 -4 2x10⁻⁴ 3x10⁻⁴ 4x10⁻⁴ 5x10⁻⁴ 4.0 3.7 3.5 3.4 3.3 0 20 40 60 80 100 120 140 160 γ−irradiation dose: 0 kGy 30 kGy 50 kGy 115 kGy 270 kGy (pH) TOC (µg/mL) [H3O+ ] (mol/L) Storage timeb)
0 50 100 150 200 250 300 350 0 20 40 60 80 100 120 140 160 γ−irradiation dose: 0 kGy 30 kGy 50 kGy 115 kGy 270 kGy TOC (µg/mL)Total carboxylic acid concentration (µg/mL)
Fig. 5. For the EVA-film, a) TOC vs [H3O+] (pH is indicated as well for information) for
different γ-doses, b) TOC vs the total concentration of carboxylic acids detected by ion chromatography (sum of each carboxylic acid concentration). Data set from all lots, all γ-irradiation doses, and all storage times. The dashed lines represent the trends.
0 25 50 75 100 125 150 0 25 50 75 100 125 150 γ-irradiation dose : 0 kGy 30 kGy 50 kGy 115 kGy 270 kGy
Ca
lc
ul
at
ed TOC (
µ
g/
m
L
)
Measured TOC (µg/mL)
Fig. 6. Measured TOC vs calculated TOC for different γ-doses. The calculated TOC data have been calculated from the total carbon mass available in carboxylic acids detected by ion chromatography analysis (TOCwith IC=C. Mci =C.
Mwi
nCi . mC
Mwi , where i identifies each
carboxylic acid, MCi= mass of carbon in i, mc = molar mass of carbon, nCi= number of
carbon atoms in i, C = concentration of the carboxylic acid i, MWi= molar mass of i).
The light red band represents the 95% prediction band and the dark red band represents the 95% confidence band. The dashed line shows the trend. The dotted line represents the hypothetical curve x = y (x = measured TOC, y = calculated TOC). (For interpretation of the references to colour in thisfigure legend, the reader is referred to the web version of this article.) 3.2 3.4 3.6 3.8 4.0 4.2 3.2 3.4 3.6 3.8 4.0 4.2
Calculated pH with equation 2 Calculated pH with equation 3 y=x
Calculated pH
Measured pH
Fig. 7. Measured pH vs calculated pH for the EVA-film. Theoretical pH is calculated from the contribution of each carboxylic acid concentration measured by ion chromatography with Eqs.(2) and (3). The solid line shows the expected trends (y = x).
measured by IC and the hydronium ion concentration either measured by IC or through the pH (Khudyakova & Kreshkov, 1971).
∑
=C z λ . [Χ ]i i i (5)
with zi= ion charge; λi= molar ionic conductivity coefficient; [Xi] = ion concentration.
Theoretical conductivity is given by Eq. (5)assuming either the measured hydronium ion concentration is deducted from the pH (Eq.
(6)) or the calculated hydronium ion concentration is similar to the carboxylate ion concentration (Eq.(7)). For both assumptions the car-boxylate ion concentration is given by Eq.(3), with Ca corresponding to the concentration of each carboxylic acid detected by ion chromato-graphy, and whereα is the dissociation coefficient calculated from Eq.
(4).
∑
∑
∑
= + = + + − − + z λ . [Χ ] z λ [H O ] z λ [RCOO ] 10 z λ [H O ] i i i i i 3 measured i i i pH i i 3 i measured (6) where[H O ]3 +i =− + + − K K 4K (C α) 2 a a2 a awith Ca = concentration of each carboxylic acid detected by ion chromatography, and whereα being the dissociation coefficient is calculated from Eq.(4).
∑
∑
∑
∑
= + = + + − + − z λ . [Χ ] z λ [H O ] z λ [RCOO ] z λ [H O ] z λ [RCOO ] i i i i i 3 calculated i i i i i 3 i i i i (7) where [H O ]3 +i =[RCOO ]−i =− + + − K K 4K (C α) 2 a a2 a a with Ca = concentra-tion of each carboxylic acid detected by ion chromatography, and whereα being the dissociation coefficient is calculated from Eq.(4).Calculations of conductivity from acid concentration measured by IC and from hydronium ion concentration (pH measurements) are compared to experimental data (Fig. 8). Calculated conductivity data are higher by 10–20% compared to measured data in line with the fact that calculated pH data are lower than the measured ones, especially with the Eq.(2).
3.1.4. Formation mechanisms of carboxylic acids
Results reported above show clearly the generation of formic and acetic acids upon irradiation. To account for these results, mechanisms are tentatively proposed based on basic reactions for the formation of radicals. It is of course worth mentioning that the formation of acetic acid may also be due to the spontaneous hydrolysis of vinyl acetate moiety in the presence of traces of water. Taking into account the
structure offilms and the conditions of sterilization, the generation of formic and acetic acids can mainly occur through radical pathways. To take into account this statement, and for the sake of the simplicity, only the most thermodynamically probable reactions have been envisioned: formation of cation radical on oxygen atoms byγ-irradiation, 1,6-hy-drogen transfer (accounting for 1,4- and 1,5-hy1,6-hy-drogen transfer would only lead to new pathway, which would generate common inter-mediates of the cyan and black pathways, e.g., blue pathway), β-scis-sion reaction affording either the most stabilized radicals or the stable diamagnetic molecules, and H-abstraction providing stabilized radicals. Less likely reactions might be envisioned and are not displayed in
Scheme 1. Hence,γ-irradiation of A generates both radical cations B (cyan route) andR (blue route). Through 1,6-H transfer and loss of proton, intermediatesB and R lead to intermediate acyloxyalkyl radical D which cleaves in E and G. Intermediate E is prone to several reac-tions: depolymerization, formation of aldehyde Q (green route) via the generation of cationsM and N with the release of acetic acid and loss of an electron, and the formation of aldehydeH, formaldehyde L, acetic and formic acid involving the very conventional tetroxide intermediate J (red route). The oxidation of alkyl radical by oxygen into acid via tetroxide is well documented by Lee et al. (Lee et al., 2016). Aldehydes H, L, Q and T can be further oxidized in acetic and formic acids, and in heavier acids through processes described inScheme 1involving very similar intermediates.
Scheme 1shows different routes to generate acetic and formic acids, which is in agreement with the main species identified by IC. The dif-ferent routes manly lead to the creation of carboxylic acids and other compounds such as aldehyde and ketone are generated in weak pro-portion. This is in accordance with our previous FTIR spectroscopic measurement (Gaston et al., 2016a). The generation of propanoic and butanoic acids as well as heavier acids, ketones and alcohols are issued from the degradation of the polyethylene blocks of EVA. Details are given inScheme 2vide infra.
3.2. PE-film
3.2.1. PCA on pH, conductivity and IC data
A principal component analysis is performed as well on pH, con-ductivity, total carboxylic acid concentration as detected per ion chromatography (abbreviation used: ICtot WFI), TOC data on PE-film which all reflect the modifications caused by the γ-irradiation and the storage time. The PCA performed on physico-chemical data shows that the twofirst components explain 91% of the data variation (cf.Fig. 10). The samples are grouped according to the TOC-ICtot, conductivity. The first principal component describes 81% of the total variance and is associated to the storage time. Theγ-irradiation dose is not to be the predominant phenomenon influencing the acid generation.Fig. 10also shows ethanoic acid is described as the principal acid extracted from thefilm influencing the pH, conductivity, and TOC. Other acids such as the pentanoic, butanoic, propanoic acids are the second contributors to the pH and conductivity shift in the case of the PE-film. Their genera-tion seems to be tickly linked with the generagenera-tion of the ethanoic acid in weaker proportion.
The second component (10%) could be hence associated to the nature of the carboxylic acids influencing the pH when in contact with the PE-film: the pentanoic and the hexanoic acid (Fig. 10). Fig. 10
shows that the generation and the release of the ethanoic acid is anti-nomic to the one of the hexanoic acid: either the ethanoic acid is pre-dominant or vice versa.
Conductivity and pH variations are direct consequences of presence of carboxylic acids extracted and generated according to the γ-irra-diation dose.Fig. 12shows the proportionality between the quantity of the carboxylic acids extracted and the hydronium ion concentration expressing the pH shift. Fig. 11shows that the amount of extracted carboxylic acids as a direct consequence of the pH drop and the con-ductivity rise, increases with extraction time. The values at 1 day
0 25 50 75 100 125 150 175 0 25 50 75 100 125 150 175 200
Conductivity calculated with equation 6 Conductivity calculated with equation 7 y=x
Calculated conductivity (µS/cm)
Measured Conductivity (µS/cm) Blank
Fig. 8. Calculated conductivity vs measured conductivity. Theoretical conductivity is either calculated from acid concentration measured by IC only (Eq.(7)) or from pH measurements with carboxylate species (Eq.(6)). The solid line highlights the expected trend (y = x).
storage time (Fig. 11) can be distinguished from all other storage time extractions. Inside the second group of storage time above 7 days, the
Fig. 11 shows as well there is dispersion inside each series of data
corresponding to eachγ-irradiation dose. Green spots which correspond to higher conductivity at 120 days seem to represent a maximum. The accumulation of carboxylic acids in solution in contact with the PE-film is rather dictated by the migration from the material core to the solu-tion, than by the direct solvation of acids present on thefilm surface after theγ-irradiation stage (Fig. 11vsFig. 12).
3.2.2. Reconciliation between pH, TOC and IC
As for the EVA-film, correlation between TOC and total carboxylic acids amount has been investigated; the correlation is shown in
Fig. 13a.Fig. 13b shows the correlation between the TOC, the pH, the quantity of carboxylic acids and the γ-irradiation doses. It is worth noting when theγ-irradiation doses increase, that the hydronium ion concentration and the TOC increase in solution through the generation and the release of the carboxylic acids. The migration of the ionic species is also linked to the storage time.
Fig. 14compares measured TOC values with calculated TOC.1The
carbon mass quantity in carboxylic acids detected during ion chroma-tography analysis was the starting point to calculate the TOC. The highest measured TOC value from the PE-film is ~11 μg/mL, against ~144μg/mL for the EVA-film. In the same conditions, the PE-film re-leases < 8%wt of the organic extractables released by the EVA-film.
A linear trend between calculated TOC and measured TOC is ob-served and lower from theoretical one (Fig. 14). It means that carbon amount found by TOC measurement is not equal to carbon amount deduced from ion chromatography analysis, unlike the results for EVA-film. It would mean carboxylic acids only provide approximately ~70% of detected carbon, varying with the storage time extraction. Thus, carboxylic acids and other organic compounds would migrate in par-allel from the material core to the aqueous solution. This phenomenon seems not to be accentuated by theγ-irradiation dose the film may have received. It would indicate as well that the chain entanglement is not loosening in a way to promote the migration of organic compounds and that the generation of ionic oxygenated species is reduced in this PE matrix. The main driver of the migration is then the storage time.
R R
OAc OAc OAc
A R R OAc O OAc B O R R OAc O OAc C HO R OAc O OAc D O R OAc E O F R OAc OAc G R O H H O OO J O OO I OO O O O K O H L O O N R OAc O O R OAc M HO AcO R OAc O OAc OH R AcO P OAc O R H Q R OAc O OAc R O R OAc R OAc O OAc S O R OAc H R OAc OH O R H T
Fig. 9. Intermediate andfinal products generated during radical based EVA degradation through inScheme 1.
A B C H D E F H L oxidation O2 I J K O2 AcOH "H" CO2 "H" O2
oxidationformic acid 1,6-H-transfer R S 1,6-H-transfer depolymerization H+ M P H2O H+ Q AcOH γ-irradiation N O H2O H+ e G Me T H2O AcOH
3.2.3. Calculation of pH and conductivity from IC (ion chromatography) data
In aqueous solution in contact with the PE-film, the acid con-centration is between 10−5 and 10−8M. Ethanoic acid is the most concentrated acid. Hexanoic, pentanoic, butanoic, propanoic and me-thanoic acids are present in the same order of concentration (10−6M) and therefore contribute to the pH shift to the same extent. The other detected acids (Maleic, lactic, acrylic…) are at too low concentration in the solution (between 10−7and 10−8M) and their effect on the pH shift is neglected. Identified acids are the same ones than those detected for the EVA-film. Acids with the highest pKa remain unchanged: maleic, methanoic and lactic acid. Other acids' pKa are between 4 and 5.
The WFI blanks have a pH of 5.5–6.5 and in contact with the PE-film, the pH decreases to 4.5. In comparison, it drops from 5.5 to 3.2 when in contact with the EVA-film. Ethanoic acid is ten times less concentrated in aqueous solutions from PE-film (~3.10−5M) than from the EVA-film (~4.10−3
M).
The theoretical pH is calculated from the carboxylic acid quantity measured by ion chromatography with Eqs. (2) and (3). Differences
from 0.1 to 0.2 a.u. separate the measured pH values to the calculated ones (Fig. 15) when aqueous solutions are in contact with the PE-film. Eq.(2)gives values closer to the measured data than the Eq.(3)does, especially at pH ~5. The calculations for the blanks did not give sa-tisfaction even several alternatives were taken in Eq.(4)in changing the coefficient 10−7by 10−6to take into account pH of the blanks were not 7. It confirms that no formula is applicable in that range of
concentration (Kahlert & Scholz, 2013;Narasaki, 1987). The pH evo-lution model obtained with Eq.(2)prints a 90% match with measured pH evolution, thus confirming the pH shift as a consequence of the carboxylic acids presence as well with the PE-film (Fig. 15).
Fig. 16compares the calculations of conductivity with Eq.(7)or with Eq.(6)with measured conductivity in solution. Conductivity cal-culations have been carried out either from acid concentrations mea-sured by IC or from hydronium ion concentration meamea-sured thought the pH. It comes out that the calculations do not match with conductivity values measured in solutions for short contact times (group 1Fig. 16) while itfits to those on longer contact times (group 2). Although pH and ion chromatography data give similar outputs, the conductivity data seem to be disconnected even though it was not the case with the EVA-film.
3.2.4. Formation mechanisms of carboxylic acids
Our results show clearly the generation of formic, acetic, propanoic, and butanoic acids as well as heavier acids, ketones and alcohols. Consequently, radical reactions on PE must be envisioned to take into account these experimental results. Only radical reactions affording the most stabilized radicals or the most stable compounds are considered, that is to say: generation of alkyl radicals byγ-irradiation on branching, 1,5-H transfer, oxidation by oxygen and formation of tetroxide, and fragmentation reactions. Some of the mechanisms are tentatively pro-posed in Scheme 2 where the PE is as an example a copolymer of ethylene and 1-octene.Scheme 2is also extended to other types of PE
hν PE PE PE PE PE PE OO Tetroxide PE PE O H PE O + PE Heavy acids PE PE 1,5-H-transfer OH PE PE OH OO Tetroxide
Heavy ketone + heavy alcohol
PE PE OH O Heavy acid + Propanoic acid PE PE OH O + butanoic acid PE PE O + Tetroxide H O + Oxydation Oxydation OH O 1 2 3 4 5 6 7 8 9 10 11 12 13 14 15 16 17 18 Route A1 Route A2 Route A3 Ro u te A5 OO HO β-fragmentation O2 Ethanoic acid β-fragmentation CH3 O2 Methanoic acid Route A4
copolymers with hexene, isooctene, etc. Carboxylic acids are generated through a manifold based on alkylperoxyl radicals.
The alkyl radicals2 of the tertiary carbon are obtained after γ-ir-radiation of PE 1, which are scavenged by the molecular oxygen to afford an alkylperoxyl radical 3. The latter reacts by intermolecular coupling to afford a tetra-oxide which collapses by OeO bond cleavage releasing O2in the alkoxyl radical4 (Tidjani & Watanabe, 1995). The β-fragmentation of 4 (BDE(CH3CH2-CH(CH3)O%)~18 kJ·mol−1) in the main PE chain (route A1) can release the ketone 5 and another alkyl radical6 leading to the formation of heavy acids not detectable by ion
chromatography.
Theβ-fragmentation of 4 in the side chain (route A2) can release the ketone7 and the hexyl radical 8, which is scavenged by the mo-lecular oxygen to afford the hexyl peroxyl radical 9. The latter reacts by
Fig. 10. PCA of physico-chemical data on PE-film: Loading plot of PC1 vs PC2 (ellipses represent respectively 50%, 75%, 100% of the correlation).
0 1x10⁻⁵ 2x10⁻⁵ 3x10⁻⁵ 4x10⁻⁵ 5x10⁻⁵ 6x10⁻⁵ 7x10⁻⁵ 0 5 10 15 20 Storage time : 1 day 7 days 21 days 120 days Conductivity (µS/cm) [H3O+ ] (mol/L) Blank
Fig. 11. Conductivity vs [H3O+] at different storage time. The dashed circle line outlines
outliers and the crossed squares are for pure water (blank experiment).
0 2x10⁻⁵ 4x10⁻⁵ 6x10⁻⁵ -- 4.7 4.4 4.2 0 5 10 15 20 pH γ-irradiation dose: 0 kGy 30 kGy 50 kGy 115 kGy 270 kGy
Total carboxylic acid concentration (µg/mL)
[H
3O
+] (mol/L)
Blank
Fig. 12. Total carboxylic acids amount (ICtot) detected by ion chromatography vs [H3O+]. pH is indicated as well for information. The dash line illustrates the tendency.
a)
0 5 10 15 20 0 5 10 15 γ-irradiation dose: 0 kGy 30 kGy 50 kGy 115 kGy 270 kGy TOC (µg/mL) ICtot (µg/mL)b)
0 2x10⁻⁵ 4x10⁻⁵ 6x10⁻⁵ 8x10⁻⁵ -- 4.7 4.4 4.2 4.1 0 5 10 15 γ-irradiation dose: 0 kGy 30 kGy 50 kGy 115 kGy 270 kGy pH TOC (µg/mL) [H3O+] (mol/L) BlankFig. 13. a) TOC vs the total concentration of carboxylic acids detected by ion chroma-tography, and b) TOC vs [H3O+] (pH is indicated as well for information). Data set from
all lots, allγ-irradiation doses, and all storage times. The dashed lines symbolizes the trend.
self-coupling to afford a tetra-oxide which collapses either in hexanal 10 or in hexanol 11. The aldehyde 10 could be further oxidized into hexanoic acid12.
1,5-H-atom transfer in the oxyl radical 4 (BDE(C2H5CH(O%)CH3) ~49 kJ·mol−1) may occur (route A3) to afford the alkyl radical 13. The latter can scavenge an oxygen molecule to form the alkylperoxyl radical 14. A tetroxide can be then formed by self-coupling of 14, which col-lapses either by OeO bond cleavage releasing O2in the alkoxyl radical 15, or in heavy ketone and heavy alcohol. The alkoxyl radical 15 can fragment in theβ-position in the shortest chain to lead on the first hand to the propanyl radical 16 (route A4), which further react into pro-panoic acid. In the other hand, the alkoxyl radical15 can fragment in theβ-position (route A5) to lead to the alkoxyl radical 17 and to bu-tanal18. The butanal can be further oxidized in butanoic acid.
Scheme 2presents different routes to generate short acids such as acetic and formic acids and medium acids such as pentanoic and hex-anoic acids, which is in agreement with the main species identified by IC.
Scheme 2only focuses on the generation of acids and does not show other degradation pathways leading to the formation of vinyl moieties
0 2 4 6 8 10 12 0 2 4 6 8 10 12 γ-irradiation dose: 0 kGy 30 kGy 50 kGy 115 kGy 270 kGy Calculated TOC (µg/mL) Measured TOC (µg/mL)
Fig. 14. Measured TOC vs calculated TOC for the PE-film. The dotted line is for the trend (y = x). 4.0 4.5 5.0 5.5 6.0 6.5 3.5 4.0 4.5 5.0 5.5 6.0 Blank
Calculated pH with equation 3 x=y
Calculated pH with equation 2
Calculated pH
Measured pH
Fig. 15. Calculated pH vs measured pH. Theoretical pH is calculated from the con-tribution of each carboxylic acid concentration measured by ion chromatography with Eqs.(2) and (3). The dotted line represents the hypothetical curve x = y (x = measured pH, y = calculated pH). 0 10 20 30 0 5 10 15 20 25 30
Conductivity calculated with equation 6 - Storage time (days):
1 7 21 120
Conductivity calculated with equation 7 - Storage time (days):
1 7 21 120 Calculated conductivity (µS/cm)
Measured Conductivity (µS/cm)
Group 2 Group 1 y=2,5x y=x 0 10 20 30 0 5 10 15 20 25 30Conductivity calculated with equation 6 - Storage time (days): 1 7 21 120 Conductivity calculated with equation 7 - Storage time (days):
1 7 21 120 Calculated conductivity (µS/cm) Measured Conductivity (µS/cm) y=2,5x y=x 0 10 20 30 0 5 10 15 20 25 30
Plot Conductivity calculated with equation 6 - kGy 0 115 270 50 30 Plot Conductivity calculated with equation 7 - kGy
0 115 270 50 30
Calculated conductivity (µS/cm)
Measured Conductivity (µS/cm) y=2,5x
y=x
Fig. 16. Calculated conductivity vs measured conductivity for the PE-film. Theoretical conductivity is either calculated from acid concentration measured by IC only (Eq.(7)) or from pH measurements with carboxylate species (Eq.(6)). The dotted line represents the hypothetical curve x = y. The dashed line represents thefitting curve especially for short contact time data with the equation y = 2.5x.
and chain scissions. Moreover it is worth mentioning that the quantity of acid released from the PEfilm is ten times less than in the EVA-film. This is in correspondence with previous XPS measurement showing that the content of oxidation on the PE-film is weak (Dorey et al., 2018). 4. Conclusion
The same general tendencies were observed for EVA-film and PE-film. Correlation between hydronium ion, pH and total carboxylic acids amount evolution has been highlighted, and then confirmed by pH calculation. Hydronium ion, pH and conductivity respectively are un-ique and partial consequences of extracted total carboxylic acids amount. Storage time effect was observed on ions extraction. At least 70% of ions are extracted within 7 days. It was found a higherγ-dose generates higher carboxylic acids amount. Carbon from carboxylic acids only partly explains the measured TOC values in the case of the PE-film, which also involve carbon from alkanes generated during the irradiation, damaging the LLDPE in the PE-film. In the case of the EVA-film, carbon from carboxylic acids explains the measured TOC values. The correlation between carboxylic acids and TOC was investigated and confirmed by PCA. However, all the tendencies are less pronounced with the PE-film because of the low concentrations of extractables. For example, the highest measured TOC from PE-film represents < 8% of the highest measured TOC from EVA-film.
References
Audran, G., Dorey, S., Dupuy, N., Gaston, F., Marque, S.R.A., 2015. Degradation of g-irradiated polyethylene-ethylene vinyl alcoholpolyethylene multilayerfilms: an ESR study. Polym. Degrad. Stab. 122, 169–179.
Cardinali, M.E., Giomini, C., Marrosu, G., 1995. Old and new approximate formulae for elementary pH calculations, and their limits of applicability. Bull. Soc. Chim. Belg. 104, 7–9.
Claeys, A.E., 1985. A new method for the pH calculation of solutions and mixtures of acids, bases and salts. Anal. Chim. Acta 178, 277–288.
Da Silva Aquino, K.A., 2012. Sterilization by Gamma Irradiation. Prof. Feriz Adrovic (Ed.), ISBN: 978-953-51-0316-5, InTech, Available from:http://www.intechopen. com/books/gammaradiation/sterilization-by-gamma-irradiation.
Demertzis, P.G., Franz, R., Welle, F., 1999. The effects of γ-irradiation on compositional changes in plastic packagingfilms. Packag. Technol. Sci. 12, 119–130.
Dorey, S., Gaston, F., Marque, S.R.A., Bortolotti, B., Dupuy, N., 2018. XPS analysis of PE and EVA samples irradiated at different γ-doses. Appl. Surf. Sci. 427, 966–972.
Driffield, M., Bradley, E., Castle, L., 2009. Literature Review, Analytical Screening and Chemical Migration Studies on Irradiated Food Packaging.
Esbensen, K.H., Guyot, D., Westad, F., Houmoller, L.P., 2002. Multivariate data analysis. In: Practice: An Introduction to Multivariate Data Analysis and Experimental Design.
Gaston, F., Dupuy, N., Marque, S.R.A., Barbaroux, M., Dorey, S., 2016a. FTIR study of ageing ofγ-irradiated biopharmaceutical EVA based film. Polym. Degrad. Stab. 129, 19–25.
Gaston, F., Dupuy, N., Marque, S.R.A., Barbaroux, M., Dorey, S., 2016b. One year mon-itoring by FTIR ofγ-irradiated multilayer film PE/EVOH/PE. Radiat. Phys. Chem. 125, 115–121.
Gaston, F., Dupuy, N., Marque, S.R.A., Barbaroux, M., Dorey, S., 2017. Impact of γ-irra-diation, ageing and their interactions on multilayerfilms followed by AComDim. Anal. Chim. Acta 981, 11–23.
Gluck, S.J., Steele, K.E., Benkö, M.H., 1996. Determination of acidity constants of monoprotic and diprotic acids by capillary electrophoresis. J. Chromatogr. 745, 117–125.
Guide to Irradiation and Sterilization Validation of Single-use Bioprocess Systems. Bioprocess International, pp. 12.
Hemmerich, K.J., 2000. Medical device and diagnostic industry. online.http://www. mddionline.com/article/polymer-materials-selection-radiation-sterilized-products.
Ishigaki, I., Yoshii, F., 1992. Radiation effects on polymer materials in radiation ster-ilization of medical supplies. Radiat. Phys. Chem. 39, 527–533.
Jenke, D., Barge, V.J., 2014. Factors affecting the release of extractable acetic acid from multi-layered plasticfilms containing ethylene vinyl acetate (EVA) and polyethylene (PE) layers. Pharm. Outsourcing 15, 56–59.
Jenke, D., Zietlow, D., Sadain, S., 2004. Leaching of organic acids from irradiated EVA plastics as a function of solution pH and polarity. PDA J. Pharm. Sci. Technol.PDA J Pharm Sci Technol. 58, 24–31.
Kahlert, H., Scholz, F., 2013. Acid-base Diagrams. Springer, Germany.
Khudyakova, T.A., Kreshkov, A.P., 1971. The theory of conductimetric acid-base titra-tions in non-aqueous solutitra-tions. J. Electroanal. Chem. 29, 181–194.
Kumar, N., Bansal, A., Sarma, G.S., Rawal, R.K., 2014. Chemometrics tools used in ana-lytical chemistry: an overview. Talanta 123, 186–199.
Lee, R., Gryn'ova, G., Ingold, K.U., Coote, M.L., 2016. Why are sec-alkylperoxyl bimole-cular self-reactions orders of magnitude faster than the analogous reactions of tert-alkylperoxyls? The unanticipated role of CH hydrogen bond donation. Phys. Chem. Chem. Phys. 18, 23673–23679.
Madera-Santana, T.J., Melendrez, R., González-Garcia, G., Quintana-Owen, P., Pillai, S.D., 2016. Effect of gamma irradiation on physicochemical properties of commercial poly(lactic acid) clamshell for food packaging. Radiat. Phys. Chem. 123, 6–13.
Martens, H., Naes, T., 1989. Multivariative Calibration. Wiley.
Namazian, M., Halvani, S., 2006. Calculations of pKa values of carboxylic acids in aqu-eous solution using density functional theory. J. Chem. Thermodyn. 38, 1495–1502.
Narasaki, H., 1987. The range of application of the approximation formulae in acid-base equilibria. Fresenius' Z. Anal. Chem. 328, 633–638.
Salafranca, J., Clemente, I., Isella, F., Nerin, C., Bosetti, O., 2015. Influence of oxygen and long term storage on the profile of volatile compounds released from polymeric multilayer food contact materials sterilized by gamma irradiation. Anal. Chim. Acta 878, 118–130.
Stoffers, N.H., Linssen, J.P.H., Franz, R., Welle, F., 2004. Migration and sensory evalua-tion of irradiated polymers. Radiat. Phys. Chem. 71, 203–206.
Suarez, J.C.M., Mano, E.B., 2001. Characterization of degradation on gamma-irradiated recycled polyethylene blends by scanning electron microscopy. Polym. Degrad. Stab. 72, 217–221.
Tidjani, A., Watanabe, Y., 1995. Gamma-oxidation of linear low density polyethylenes: the dose-rate effect of irradiation on chemical and physical modifications. J. Polym. Sci., Polym. Chem. Ed. 33, 1455–1460.
Traboulsi, A., Dupuy, N., Rebufa, C., Sergent, M., 2012. Investigation of gamma radiation effect on the anion exchange resin Amberlite IRA-400 in hydroxide form by Fourier transformed infrared and 13C nuclear magnetic resonance spectroscopies. Anal. Chim. Acta 717, 110–121.
Zeng, Y., Chen, X., Zhao, D., Li, H., Zhang, Y., Xiao, X., 2012. Estimation of pKa values for carboxylic acids, alcohols, phenols and amines using changes in the relative Gibbs free energy. Fluid Phase Equilib. 313, 148–155.


![Fig. 12. Total carboxylic acids amount (ICtot) detected by ion chromatography vs [H 3 O + ]](https://thumb-eu.123doks.com/thumbv2/123doknet/13554996.419777/10.892.62.425.87.558/fig-total-carboxylic-acids-ictot-detected-ion-chromatography.webp)

