HAL Id: hal-02408876
https://hal.sorbonne-universite.fr/hal-02408876
Submitted on 13 Dec 2019
HAL is a multi-disciplinary open access archive for the deposit and dissemination of sci-entific research documents, whether they are pub-lished or not. The documents may come from teaching and research institutions in France or abroad, or from public or private research centers.
L’archive ouverte pluridisciplinaire HAL, est destinée au dépôt et à la diffusion de documents scientifiques de niveau recherche, publiés ou non, émanant des établissements d’enseignement et de recherche français ou étrangers, des laboratoires publics ou privés.
versus other biological agents on cardiovascular
risk-associated biomarkers in patients with rheumatoid
arthritis
Alexandre Virone, Jean-Philippe Bastard, Soraya Fellahi, Jacqueline Capeau,
Stéphanie Rouanet, Jean Sibilia, Philippe Ravaud, Francis Berenbaum,
Jacques-Eric Gottenberg, Jérémie Sellam
To cite this version:
Alexandre Virone, Jean-Philippe Bastard, Soraya Fellahi, Jacqueline Capeau, Stéphanie Rouanet, et al.. Comparative effect of tumour necrosis factor inhibitors versus other biological agents on cardio-vascular risk-associated biomarkers in patients with rheumatoid arthritis. RMD Open : Rheumatic & Musculoskeletal Diseases, EULAR ; BMJ, 2019, 5 (2), pp.e000897. �10.1136/rmdopen-2019-000897�. �hal-02408876�
1 Virone A, et al. RMD Open 2019;5:e000897. doi:10.1136/rmdopen-2019-000897
Original article
Comparative effect of tumour necrosis
factor inhibitors versus other biological
agents on cardiovascular risk-associated
biomarkers in patients with
rheumatoid arthritis
Alexandre Virone, 1 Jean-Philippe Bastard,2,3 Soraya Fellahi,2,3
Jacqueline Capeau,3 Stéphanie Rouanet,4 Jean Sibilia,5 Philippe Ravaud,6
Francis Berenbaum,1,3 Jacques-Eric Gottenberg,5 Jérémie Sellam,1,3 on behalf of
Club Rhumatismes Inflammation-IMIDIATE network To cite: Virone a, Bastard J-P,
Fellahi S, et al. comparative effect of tumour necrosis factor inhibitors versus other biological agents on cardiovascular risk-associated biomarkers in patients with rheumatoid arthritis. RMD Open 2019;5:e000897. doi:10.1136/ rmdopen-2019-000897 2017 american college of rheumatology meeting received 7 January 2019 revised 28 March 2019 accepted 15 april 2019
For numbered affiliations see end of article.
Correspondence to Dr Jérémie Sellam; jeremie. sellam@ aphp. fr
Rheumatoid arthritis
© author(s) (or their employer(s)) 2019. re-use permitted under cc BY-nc. no commercial re-use. See rights and permissions. Published by BMJ.
AbstrAct
Background to comparatively investigate the differential
effect of second-line tumour necrosis factor inhibitors (tnFis) versus other biological agents on cardiovascular disease (cVD) risk-associated biomarkers in patients with rheumatoid arthritis (ra).
Methods We evaluated the serum levels of
lipoprotein-associated apoproteins apoa1 and apoB100 and lipoprotein(a) (lp(a)) and the leptin/adiponectin ratio (lar) as an insulin resistance proxy in patients with ra from the rotation Or change (rOc) trial treated with either a second-line tnFi or another biologic (tocilizumab (tcZ), rituximab or abatacept) at baseline and week 24. We compared the changes in biomarker levels in each group and according to the eUlar response.
Results Of the 300 patients enrolled in the rOc trial, 203
were included in the study, including 96 in the second-line tnFi group and 107 in the other biological group. the measured biomarkers did not deteriorate between baseline and week 24 regardless of the group. a greater improvement in the lar was noted in the other biological group (median (iQr) −0.12 ng/µg (−0.58 to 0.31) vs 0.04 (−0.19 to 0.43), p=0.033), and a greater improvement in the lp(a) level was observed following treatment with tcZ than with a tnFi (−0.05 g/l (−0.11 to −0.01) vs −0.01 g/l (−0.02 to 0.01), p<0.001). When considering the patients’ responses to treatment, improved biomarkers were mainly observed in the eUlar responders in each treatment group.
Conclusions tnFis and non-tnFis were neutral on
improved cVD risk-associated biomarkers in patients with ra insufficiently controlled by tnFis. tcZ could be associated with a better improvement concerning lp(a) and lar than tnFis. this improvement could be related to a good therapeutic response, thereby supporting the need of good control of ra.
Trial registration number clinicaltrials. gov identifier
nct01000441, registered on 22 October 2009.
BaCkgRound
Patients with rheumatoid arthritis (RA) present a 48% increased risk of incidence of cardio-vascular diseases (CVDs) compared with the general population.1 2 This increased risk can be
explained by a higher prevalence of traditional CVD risk factors (ie, dyslipidaemia, diabetes and hypertension)3 or the systemic low-grade
chronic inflammation that is directly involved in the pathophysiology of atherogenesis.4
The estimation of CVD risk is usually based on the levels of traditional lipid parameters5
(ie, high-density lipoprotein (HDL) terol, low-density lipoprotein (LDL) choles-terol, total cholesterol and triglycerides).
Key messages
What is already known about this subject?
► tumour necrosis factor inhibitor (tnFi) and non-tnFi improve cardiovascular disease (cVD) risk-associat-ed biomarkers in patients with rheumatoid arthritis (ra).
What does this study add?
► tnFi and non-tnFi, including tocilizumab, have a similar impact on improving cVD risk-associated biomarkers.
► the improvement of biomarkers seems to be driven by the responders to therapy.
How might this impact on clinical practice?
► in addition to routine lipid assessment such as total cholesterol, high-density lipoprotein and low-density lipoprotein cholesterol and triglycerides, the mea-sure of other cardiovascular surrogates could im-prove the evaluation of cVD risk profile of patients with ra.
Enseignement Superieur (ABES). Protected by copyright.
on December 13, 2019 at Agence Bibliographique de l
http://rmdopen.bmj.com/
However, these levels are impacted by the inflammatory state of patients with RA, and some of these parame-ters such as triglycerides level are also impacted by the non-fasted state.6 7 Apolipoproteins (Apo) are protein
components of circulating lipoproteins and are addi-tional reliable markers of CVD risk. ApoA1 is a major protein component of the cardioprotective HDL, which is involved in reverse cholesterol transport, and an increase in HDL is associated with a decreased CVD risk. Conversely, an increased level of ApoB100, which is the main protein component of very LDL, LDL and interme-diate density lipoprotein, is associated with an elevated CVD risk. Apo markers and their ratio (ApoB100/ ApoA1) may be considered better predictors of the CVD risk than LDL cholesterol8 9 or the LDL cholesterol/
HDL cholesterol ratio and may also accurately assess the cardiovascular (CV) risk for patients with RA.10 Blood
level assessment of the LDL-like particle lipoprotein(a) (Lp(a)) also accurately estimates the CVD risk. The Lp(a) particle is composed of one molecule of an LDL particle and a protein component named Apo(a). Its exact func-tion is still debated but it may contribute to the trans-portation of LDL particle, especially oxidised LDL. The level of Lp(a) is independently associated with CVD risk and is an accurate surrogate to estimate CVD risk beside total, LDL and HDL cholesterol.11 Additionally, the CVD
risk can be linked to the levels of some adipokines that are adipose tissue-specific products. Among them, leptin and adiponectin are pro-atherogenous and anti-ath-erogenous, respectively.12 13 Interestingly, the leptin to
adiponectin ratio (LAR) is an accurate proxy for insulin resistance,14 which is associated with an enhanced risk of
CVD. All these CVD risk-associated biomarkers are asso-ciated with atherogenicity and can be used as a proxy to assess CVD risk among patients with RA.
Due to their strong anti-inflammatory effects, biolog-ical disease-modifying antirheumatic drugs (bDMARDs) may impact the CVD outcome in patients with RA. Several studies have shown that tumour necrosis factor inhibi-tors (TNFis) are responsible for a reduction in myocar-dial infarction occurrence15 and an improvement in the
lipid and Apo profiles.16 17 Conversely, data regarding
non-TNFi bDMARDs are scarce or conflicting. Tocili-zumab (TCZ), which is an anti-interleukin 6 receptor, may in some cases increase the pro-atherogenous lipid fraction levels (ie, LDL cholesterol and triglycerides) and improve protective CVD risk-associated surrogate markers (ie, decreased oxidised LDL, decreased HDL-associated serum amyloid-A and increased ApoA1) over time.18–20
However, the long-term effect of TCZ on CVD occur-rence is not clear, but some recent observational studies seem reassuring.21 22 Few and conflicting results are
avail-able concerning the impact of rituximab (RTX) and abatacept (ABA) on lipid profiles and the CVD risk,23–26
with a trend to a positive effect of ABA on occurrence of CVD compared with TNFi.22 Because the different RA
biologics affect lipid levels to different extents, partially in relation to decreased inflammation, using lipid levels
as CVD risk biomarkers is difficult. Thus, the validation of other CVD risk biomarkers is important for the follow-up of patients with RA.
Moreover, most studies have not performed a direct comparison of the respective effects of the different bDMARDs (TNFis vs non-TNFis) on the CV risk-asso-ciated biomarker profiles of patients with RA. Only Gabay et al27 compared first-line treatment with biologics
(ie, one TNFi (adalimumab) vs TCZ) and showed a greater increase in the LDL and HDL cholesterol levels and a greater improvement in other CV risk-associ-ated biomarkers (ie, HDL-associrisk-associ-ated serum amyloid-A, secretory phospholipase A2 IIA and Lp(a)) under TCZ therapy. A face-to-face TCZ monotherapy versus adalim-umab monotherapy comparison does not reflect accu-rately the real-life practice since we have more choice than these two agents in the daily care and most of the time we combined them with methotrexate.
Thus, we assessed the changes in CVD risk-associated biomarker levels between TNFi and non-TNFi bDMARDs and according to the response to therapy.
PaTienTs and MeTHods Patients
This study is an ancillary study of the randomised controlled Rotation or Change (ROC) trial.28 The ROC
trial was a 52-week, multicentre, open, parallel-group trial that was conducted from December 2009 to August 2012. The trial included patients with RA fulfilling the 1987 American College of Rheumatology criteria who were at least 18 years old and had an inadequate response to a first-line TNFi therapy. The trial participants were randomly assigned in a 1:1 ratio to receive either a second-line TNFi (etanercept, adalimumab, certoli-zumab or infliximab) or a non-TNF-targeted biological agent (RTX, TCZ or ABA); these biologics were admin-istered at their licensed dosages ( ClinicalTrials. gov Iden-tifier: NCT01000441). Patients had to present erosions or a Disease Activity Score in 28 joints using an eryth-rocyte sedimentation rate ≥3.2, an insufficient response to TNFis according to the physician, a stable dose of a daily oral equivalent of prednisone ≤15 mg within 4 weeks before enrolment and a stable dose of synthetic DMARDs within 4 weeks of enrolment. The choice of the drug within the randomisation group was at the clinician’s discretion. A blood sample was collected at inclusion and at week 24 at a non-fasting state. Patients achieving a good or moderate EULAR response29 at week
24 were considered responders, whereas patients who did not achieve a good or moderate response were consid-ered non-responders. Details about the protocols were reported in the main ROC trial publication.28 The
insti-tutional review board of the Comité de Protection des Personnes-Est-1, Strasbourg, France, approved the study and all patients provided written informed consent after receiving oral and written information.
For this ancillary study, patients from the ROC trial were included if: (1) both blood samples were available
Enseignement Superieur (ABES). Protected by copyright.
on December 13, 2019 at Agence Bibliographique de l
3 Virone a, et al. RMD Open 2019;5:e000897. doi:10.1136/rmdopen-2019-000897
Rheumatoid arthritis Rheumatoid arthritis Rheumatoid arthritis
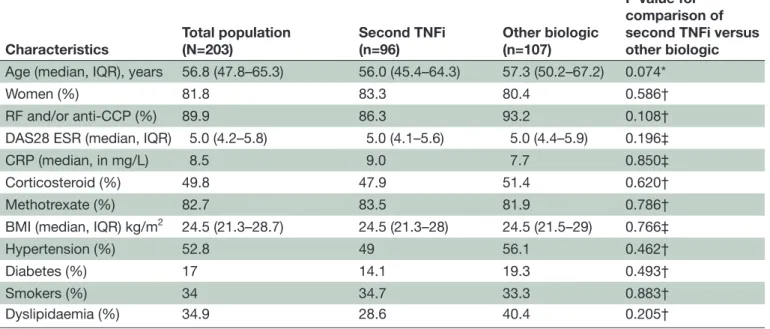
Table 1 Baseline characteristics of the population
Characteristics Total population(N=203) Second TNFi(n=96) Other biologic (n=107)
P value for comparison of second TNFi versus other biologic
Age (median, IQR), years 56.8 (47.8–65.3) 56.0 (45.4–64.3) 57.3 (50.2–67.2) 0.074*
Women (%) 81.8 83.3 80.4 0.586†
RF and/or anti-CCP (%) 89.9 86.3 93.2 0.108†
DAS28 ESR (median, IQR) 5.0 (4.2–5.8) 5.0 (4.1–5.6) 5.0 (4.4–5.9) 0.196‡
CRP (median, in mg/L) 8.5 9.0 7.7 0.850‡
Corticosteroid (%) 49.8 47.9 51.4 0.620†
Methotrexate (%) 82.7 83.5 81.9 0.786†
BMI (median, IQR) kg/m2 24.5 (21.3–28.7) 24.5 (21.3–28) 24.5 (21.5–29) 0.766‡
Hypertension (%) 52.8 49 56.1 0.462† Diabetes (%) 17 14.1 19.3 0.493† Smokers (%) 34 34.7 33.3 0.883† Dyslipidaemia (%) 34.9 28.6 40.4 0.205† Statistical analysis. *Student’s t-test. †χ2 test. ‡Wilcoxon test.
BMI, body mass index; CCP, cyclic citrullinated peptide; CRP, C reactive protein; DAS28, Disease Activity Score in 28 joints; ESR, erythrocyte sedimentation rate;RF, rheumatoid factor; TNFi, tumour necrosis factor inhibitor.
at inclusion and week 24, (2) there were no discontinu-ations of the treatment and (3) the patients were under the same drug regimen from inclusion to week 24. No sample size calculation was performed since it is an ancil-lary exploratory study based on serum samples availability.
Biomarker assessment
A blood sample was drawn at inclusion and at week 24. Serum samples were stored at −80°C in a single biological resource centre. All samples were collected in the morning but since not all were obtained when the patients were in a fasted state, we used immunoturbidimetry on an ARCHI-TECT-Ci8200 analyser (Abbott Rungis, France) to measure the serum ApoA1, ApoB100 and Lp(a) levels, which do not change according to the fasted or non-fasted state. ELISA kits were used to test the serum levels of total adiponectin (ALPCO, Salem, New Hampshire, USA) and leptin (Quan-tikine; R&D Systems, Oxford, UK).
All samples were prepared at appropriate dilutions and assessed according to the manufacturer’s instructions. For the adipokine assessment, internal control samples supplied by the manufacturer were used.
Statistical analyses
All statistical analyses involved the use of the SAS release 9.4 (SAS Institute, Cary, North Carolina, USA) statis-tical software package. Type I error was set at α=0.05. Continuous data are shown as the median and IQR. The comparison of population characteristics between the second-line TNFi and the other biological groups
involved the χ2 test, Student’s t-test or Wilcoxon test.
We compared the change of each marker between the different treatment groups using an analysis of covar-iance (ANCOVA) model adjusted for baseline-investi-gated laboratory parameters and the treatment group. The comparisons of the changes in each marker between inclusion and week 24 were analysed with the non-para-metric Wilcoxon rank-sum test or Student’s t-test, and the comparisons of changes in each marker according to the EULAR response were analysed with an ANCOVA model. A comparison between TNFi and TCZ was also done.
ResulTs
Patient characteristics
Of the 300 patients included in the ROC trial at baseline, 203 patients were investigated in this ancillary study. Of these patients, the 96 patients (47.3%) in the second-line TNFi group included 41 receiving etanercept (42.7%), 40 receiving adalimumab (41.7%), 12 receiving certolizumab (12.5%) and 3 receiving infliximab (3.1%). Additionally, 107 (52.7%) patients received other biological non-TNF-tar-geted agents, including 47 receiving TCZ (43.9%), 34 receiving RTX (31.8%) and 26 receiving ABA (24.3%). The baseline characteristics were similar between the two treatment groups (table 1) and between the patients participating and not participating in our study (data not shown). In patients receiving corticosteroid treatment, the daily dose at baseline was similar between second TNFi and
Enseignement Superieur (ABES). Protected by copyright.
on December 13, 2019 at Agence Bibliographique de l
http://rmdopen.bmj.com/
other biologic (median dose in milligram (IQR): 6 (5–8) vs 6.5 (4.75–9.25), p=0.99), respectively. Similar result was observed at week 24 (median dose in milligram (IQR): 5 (4–8) for second TNFi vs 5.25 (4.75–9.25) for other biologic, p=0.66). Moreover, corticosteroid dose did not change significantly between baseline and week 24 in each treat-ment group: 6 (5–8) vs 5 (4–8), p=0.65 for second TNFi and 6.5 (4.75–9.25) vs 5.25 (4.75–9.25), p=0.98 for other biologic.
Changes in CVd risk-associated biomarker levels between baseline and week 24 in each treatment group
In the second-line TNFi group, the ApoA1 levels were significantly increased (median (IQR): 0.03 g/L (−0.12 to 0.16), p<0.001). No significant differences were found for changes in any of the other biomarkers.
In the other biological group, the ApoA1 level was significantly increased (0.0001 g/L (−0.13 to 0.24), p<0.001), and the Lp(a) level was significantly decreased (−0.01 g/L (−0.05 to 0.01), p=0.017). All the other biomarkers remained stable over time. Notably, we observed a trend for the deterioration of the ApoB100 level (ie, an increase) of 0.04 g/L ((−0.07 to 0.12), p=0.072), but the ApoB100/ApoA1 ratio remained stable (0.01 (−0.07 to 0.08), p=0.734). The results are summarised in table 2.
Moreover, in the other biological group, the increase in ApoA1 and decrease in Lp(a) were mainly related to TCZ treatment (0.06 g/L (−0.07 to 0.27), p<0.001 and −0.05 g/L (−0.11 to −0.01), p<0.001, respectively). The serum adiponectin level was also increased (0.46 mg/L (−0.43 to 1.33), p=0.024) following TCZ therapy. The other markers remained stable in the TCZ group between baseline and week 24 (table 3), and the ApoB100/ApoA1 ratio did not significantly change (0.01 (−0.07 to 0.09), p=0.97).
Comparison of changes in CVd risk-associated biomarker levels between treatment groups from baseline to week 24
When the other biological group was compared with the second-line TNFi group, worsening (ie, increase) of ApoB100 was noted (the results are shown as the median per cent of change (IQR) in each group) (3.49% (−5.26% to 11.83%) vs −1.2% (−9.35% to 7.45%), p=0.037), but an improvement was observed for LAR (ie, decrease) (−9.74% (−30.23% to 27.67%) vs 3.64% (−17.91% to 36.14%), p=0.033). The results are summarised in table 2. No signif-icant differences were found in the other biomarkers between the two groups, although a trend was observed for a greater effect of the treatment with the other biologics versus TNFi on the Lp(a) level (−0.01 g/L (−0.05 to 0.01) vs −0.005 g/L (−0.02 to 0.01), p=0.051).
The comparison between the second-line TNFi and TCZ groups indicated a greater treatment effect in the TCZ group, with a much higher decrease in the Lp(a) level (−28.57% (−44% to −1.28%) vs −1.72% (−22.7% to 8.62%), p<0.001) (results are summarised in table 3). Differences regarding the other biomarkers were not significant, although a trend for a greater deterioration
(ie, increase) in the ApoB100 level was observed (6.67% (−13.46% to 17.12%) vs −1.2% (−9.35% to 7.45%), p=0.051). Conversely to the comparison between TNFi and other biologics, there was no difference of LAR change between TNFi and TCZ.
Comparison of changes in the CV-associated biomarker levels between baseline and week 24 according to the eulaR response
All results are reported in table 4. Changes from
base-line to week 24 were also assessed relative to the treat-ment efficacy, which was evaluated using the EULAR response at week 24. In the second-line TNFi group, we observed better improvement of the serum ApoA1 and adiponectin levels among responders compared with non-responders between baseline and week 24 (0.09 g/L (−0.05 to 0.21) vs −0.08 g/L (−0.19 to 0.04), p<0.001 and 0.17 mg/L (−0.29 to 0.93) vs −0.3 mg/L (−1.2 to 0.32), p=0.01, respectively). The responders also exhibited an improved ApoB100/ApoA1 ratio over time (−0.03 (−0.09 to 0.04), p=0.034), but this improvement was not signif-icant when compared with the non-responders. The other biomarker changes were not driven by the EULAR response in the second-line TNFi group.
In the other biological therapy group, the ApoA1 and Lp(a) levels improved (ie, increased for ApoA1 and decreased for Lp(a)) among the responders but deteri-orated among the non-responders (0.06 g/L (−0.07 to 0.26) vs −0.05 g/L (−0.19 to 0.1), p=0.02 for ApoA1 and −0.01 g/L (−0.06 to 0.01) vs 0.0001 g/L (−0.02 to 0.04), p=0.003 for Lp(a)).
The EULAR response also had an impact in the TCZ group, since there was a greater improvement of the ApoA1 (0.125 g/L (−0.06 to 0.31) vs −0.18 g/L (−0.27 to −0.05), p=0.032) and adiponectin levels (0.51 mg/L (−0.25 to 1.57) vs −1.05 mg/L (−1.54 to −0.43), p=0.035) in the responders versus the non-responders. The ApoB100/ApoA1 ratio remained stable among the responders but deteriorated (ie, increased) among the non-responders (0.0001 (−0.07 to 0.08) vs 0.12 (0.05 to 0.13), p=0.032). The other biomarkers did not vary between the responders and non-responders.
disCussion
This study directly compared the effect of second-line bDMARDs (TNFis and non-TNFis) on CVD risk-asso-ciated biomarkers in patients with RA insufficiently controlled by a first-line TNFi. First, we showed that all assessed biomarkers remained stable or improved regardless of the treatment group (TNFi or non-TNFi). The ApoA1 levels improved in both groups (TNFi and other biological groups), and the Lp(a) levels improved in the non-TNFi group. This improvement in the ApoA1 and Lp(a) levels in the other biological group was mainly drived by TCZ. Moreover, comparison of biomarker changes between the TNFi and other biological groups showed a greater decrease in the LAR but also a trend for
Enseignement Superieur (ABES). Protected by copyright.
on December 13, 2019 at Agence Bibliographique de l
5 Virone a, et al. RMD Open 2019;5:e000897. doi:10.1136/rmdopen-2019-000897
Rheumatoid arthritis Rheumatoid arthritis Rheumatoid arthritis
Table 2 Biomarkers’ change from baseline to week 24 between the second TNFi and other biological groups
Second TNFi (n=96) Other biologic (n=107)
P value second TNFi versus other biologic*
ApoA1 (g/L) Median baseline (IQR) 1.74 (1.54 to 2.03) 1.7 (1.5 to 1.93)
Median change (IQR) 0.03 (−0.12 to 0.16) 0.005 (−0.13 to 0.24) 0.46 P-value of change W24 versus
baseline† <0.001 <0.001
Median % of change (IQR) 1.23 (−6.13 to 9.84) 0 (−6.92 to 14.37) ApoB100 (g/L) Median baseline (IQR) 1.01 (0.87 to 1.16) 1.04 (0.86 to 1.20)
Median change (IQR) −0.01 (−0.09 to 0.08) 0.04 (−0.07 to 0.12) 0.037 P-value of change W24 versus
baseline‡ 0.536 0.072
Median % of change (IQR) −1.2 (−9.35 to 7.45) 3.49 (−5.26 to 11.83)
ApoB100/ApoA1 ratio Median baseline (IQR) 0.54 (0.46 to 0.69) 0.63 (0.47 to 0.72) 0.076 Median change (IQR) −0.01 (-0.08 to 0.05) 0.01 (−0.07 to 0.08)
P-value of change W24 versus baseline‡
0.156 0.734
Median % of change (IQR) −2.09 (−12.97 to 9.76) 1.52 (−11.63 to 12.82) Lp(a) (g/L) Median baseline (IQR) 0.10 (0.05 to 0.29) 0.15 (0.06 to 0.33)
Median change (IQR) −0.005 (−0.02 to 0.01) −0.01 (−0.05 to 0.01) 0.051 P-value of change W24 versus
baseline‡ 0.058 0.017
Median % of change (IQR) −1.72 (−22.74 to 8.62) −1.28 (−30 to 14.29) Leptin (ng/mL) Median baseline (IQR) 9.90 (5.22 to 22) 11.74 (5.70 to 28.4)
Median change (IQR) 0.47 (−2.1 to 2.56) −0.78 (−4.1 to 2.38) 0.13 P-value of change W24 versus
baseline‡ 0.419 0.068
Median % of change (IQR) 5.62 (−22.72 to 33.95) −8.85 (−30.18 to 18.22) Adiponectin (mg/L) Median baseline (IQR) 7.25 (5 to 9.93) 7.92 (5.64 to 11.2)
Median change (IQR) 0.1 (−0.63 to 0.79) 0.17 (−0.89 to 0.95) 0.79 P-value of change W24 versus
baseline‡
0.505 0.471
Median % of change (IQR) 1.35 (−7.85 to 11.61) 2.57 (−11.69 to 12.36) Leptin/adiponectin
ratio (ng/µg) Median baseline (IQR)Median change (IQR) 1.55 (0.62 to 2.82)0.04 (−0.19 to 0.43) −0.12 (−0.58 to 0.31)1.47 (0.77 to 3.51) 0.033 P-value of change W24 versus
baseline‡ 0.217 0.052
Median % of change (IQR) 3.64 (−17.91 to 36.14) −9.74 (−30.23 to 27.67) Statistical analysis.
*ANCOVA model. †Paired Student’s t-test. ‡Wilcoxon signed rank test.
ANCOVA, analysis of covariance; Apo, apolipoprotein; Lp(a), lipoprotein(a); TNFi, tumour necrosis factor inhibitor; W24, week 24.
a greater increase in the pro-atherogenic ApoB100 level in the other biological group. The comparison between TNFi and TCZ indicated a greater decrease in the pro-ath-erogenic Lp(a) level with TCZ than with a TNFi. Finally, some changes in marker levels were dependent on the clinical response to the biological agent.
CVD risk is a major issue in the management of patients with RA, but the effect of non-TNFi agents on the inci-dence of CVD events is not known. To evaluate the CVD
risk, we used surrogate circulating biomarkers, since the effect of different bDMARDs on these biomarkers has not been directly compared.
To the best of our knowledge, only one randomised controlled study has directly compared the effect of different first-line bDMARDs on CVD risk-associated biomarkers between 162 monotherapy TCZ-treated patients and 162 monotherapy adalimumab-treated patients.27 A greater decrease in pro-atherogenic
Enseignement Superieur (ABES). Protected by copyright.
on December 13, 2019 at Agence Bibliographique de l
http://rmdopen.bmj.com/
Table 3 Biomarkers’ change from baseline to week 24 between the second TNFi and tocilizumab groups
Second TNFi (n=96) Tocilizumab (n=47)
P-value second TNFi versus tocilizumab*
ApoA1 (g/L) Median baseline (IQR) 1.74 (1.54 to 2.03) 1.6 (1.5 to 1.89)
Median change (IQR) 0.03 (−0.12 to 0.16) 0.06 (−0.07 to 0.27) 0.09 P-value of change W24
versus baseline† <0.001 <0.001
Median % of change (IQR) 1.23 (−6.13 to 9.84) 3.45 (−4.9 to 19.2) ApoB100 (g/L) Median baseline (IQR) 1.01 (0.87 to 1.16) 1.04 (0.88 to 1.2)
Median change (IQR) −0.01 (−0.09 to 0.08) 0.08 (−0.14 to 0.19) 0.051 P-value of change W24
versus baseline‡ 0.536 0.206
Median % of change (IQR) −1.2 (−9.35 to 7.45) 6.67 (−13.46 to 17.12) ApoB100/ApoA1 ratio Median baseline (IQR) 0.54 (0.46 to 0.69) 0.65 (0.47 to 0.75) 0.13
Median change (IQR) −0.01 (−0.08 to 0.05) 0.01 (−0.07 to 0.09) P-value of change W24
versus baseline‡
0.156 0.968
Median % of change (IQR) −2.09 (−12.97 to 9.76) 1.43 (−12.07 to 15.67) Lp(a) (g/L) Median baseline (IQR) 0.10 (0.05 to 0.29) 0.18 (0.07 to 0.31)
Median change (IQR) −0.01 (−0.02 to 0.01) −0.05 (−0.11 to −0.01) 0.0001 P-value of change W24
versus baseline‡ 0.058 <0.001
Median % of change (IQR) −1.72 (−22.74 to 8.62) −28.57 (−44 to −1.28) Leptin (ng/mL) Median baseline (IQR) 9.90 (5.22 to 22) 11.74 (5.9 to 25.57)
Median change (IQR) 0.47 (−2.1 to 2.56) −0.71 (−5.13 to 3.47) 0.46 P-value of change W24
versus baseline‡ 0.419 0.406
Median % of change (IQR) 5.62 (−22.72 to 33.95) −7.25 (−32.61 to 28.35) Adiponectin (mg/L) Median baseline (IQR) 7.25 (5 to 9.93) 7.92 (5.24 to 10.26)
Median change (IQR) 0.1 (−0.63 to 0.79) 0.46 (−0.43 to 1.33) 0.10 P-value of change W24
versus baseline‡
0.505 0.024
Median % of change (IQR) 1.35 (−7.85 to 11.61) 5.7 (−5.35 to 17.28) Leptin/adiponectin ratio
(ng/µg) Median baseline (IQR)Median change (IQR) 1.55 (0.62 to 2.82)0.04 (−0.19 to 0.43) −0.028 (−0.66 to 0.41)1.64 (0.87 to 3.51) 0.26 P-value of change W24
versus baseline‡ 0.217 0.325
Median % of change (IQR) 3.64 (−17.91 to 36.14) −9.18 (−33.11 to 37.54) Statistical analysis.
*ANCOVA model. †Paired Student’s t-test. ‡Wilcoxon signed rank test.
ANCOVA, analysis of covariance; Apo, apolipoprotein; Lp(a), lipoprotein(a); TNFi, tumour necrosis factor inhibitor; W24, week 24.
markers, such as HDL-associated serum amyloid-A (HDL-SAA), secretory phospholipase A2 IIA (sPLA2 IIA) and Lp(a), was observed between inclusion and week 8 for TCZ compared with that in the adalimumab group. A trend for a better improvement of theses biomarkers (Lp(a), HDL-SAA and sPLA2 IIA) among the responders was observed in both groups, but statistical significance was not reached. However, TCZ and adalimumab were given as monotherapy without methotrexate and these
two arms do not reflect the choice that we have in clinical practice among several biological agents.
Our results highlight the absence of aggravation of the different CVD risk-associated biomarkers tested through the 6 months of treatment regardless of the therapeutic agent used (TNFi or non-TNFi). The results obtained for the TNFi group are consistent with data reported in the literature, with an increase in the ApoA1 level and a stable ApoB100 level after TNFi treatment.17 These improvements
Enseignement Superieur (ABES). Protected by copyright.
on December 13, 2019 at Agence Bibliographique de l
7 Virone a, et al. RMD Open 2019;5:e000897. doi:10.1136/rmdopen-2019-000897
Rheumatoid arthritis Rheumatoid arthritis Rheumatoid arthritis
Table 4 Changes between baseline and week 24 relative to the EULAR response
Median changes from baseline to week 24
Second TNFi Other biologic Tocilizumab
Responders
(n=64) Non-responders (n=31) Responders (n=76) Non-responders (n=30) Responders (n=42) Non-responders (n=5)
ApoA1 (IQR) (g/L) 0.09 (−0.05 to 0;21) −0.08 (−0.19 to 0.04) 0.06 (−0.07 to 0.26) −0.05 (−0.19 to 0.1) 0.13 (−0.06 to 0.31) −0.18 (−0.27 to −0.05) p=0.0004 p=0.02 p=0.032 ApoB100 (IQR) (g/L) −0.01 (−0.1 to 0.08) −0.03 (−0.09 to 0.08) 0.04 (−0.09 to 0.13) 0.02 (−0.06 to 0.11) 0.08 (−0.15 to 0.23) 0.08 (0.07 to 0.11) p=0.79 p=0.55 p=0.82 ApoB100/ApoA1 ratio −0.03 (−0.09 to 0.04) 0.03 (−0.05 to 0.06) 0.0001 (−0.07 to 0.08) 0.04 (−0.07 to 0.09) 0.0001 (−0.07 to 0.08) 0.12 (0.05 to 0.13) p=0.057 p=0.27 p=0.03 Lp(a) (IQR) (g/L) −0.01 (−0.03 to 0.01) 0 (−0.01 to 0.02) −0.01 (−0.06 to 0.01) 0 (−0.02 to 0.04) −0.05 (−0.11 to 0.01) 0 (−0.02 to 0) p=0.3 p=0.003 p=0.4 Leptin (IQR) (ng/mL) 0.74 (−2.48 to 4.04) 0.3 (−0.85 to 2.43) −0.29 (−3.71 to 2.53) −1.15 (−5.86 to 1.75) −0.65 (−3.65 to 3.01) −0.71 (−12.39 to 4.37) p=0.63 p=0.96 p=0.4 Adiponectin (IQR) (mg/L) 0.17 (−0.29 to 0.93) −0.3 (−1.2 to 0.32) 0.2 (−0.61 to 1.01) −0.12 (−1.11 to 0.91) 0.51 (−0.25 to 1.57) −1.05 (−1.54 to −0.43) p=0.01 p=0.36 p=0.035 LAR (IQR) (ng/µg) 0.07 (−0.29 to 0.47) 0.04 (−0.12 to 0.42) −0.05 (−0.57 to 0.38) −0.24 (−0.65 to 0.24) −0.07 (−0.62 to 0.38) 0.41 (−0.91 to 0.83) p=0.9 p=0.62 p=0.2
Responders are patients achieving a good or moderate EULAR response at week 24, whereas non-responders are those that did not. Statistical analysis using ANCOVA model adjusted on baseline parameters.
ANCOVA, analysis of covariance; Apo, apolipoprotein; LAR, leptin/adiponectin ratio; TNFi, tumour necrosis factor inhibitor; p, p-value using ANCOVA model.
could be linked to the treatment response, since non-re-sponders did not seem to improve their Apo profiles in a 1-year follow-up of 292 etanercept-treated patients.16
Regarding non-TNFi therapeutic agents, we observed a global improvement in biomarkers, with statistical signifi-cance for ApoA1 (increase) and Lp(a) (decrease). Some concerns have been reported regarding the CVD risk within this group for TCZ. Here, we show a positive effect on surrogate markers of atherogenicity as their circulating levels decline, with significant increase in ApoA1 level and decrease in Lp(a) levels. However, we noted a non-signif-icant trend for ApoB100 level degradation (ie, increase) over time in both the other biological and TCZ groups. These overall observations of the impact of TCZ on the CVD risk are reassuring. Moreover, clinical evidences supporting that observation begin to be compiled. For example, a cohort study of patients with RA previously treated with TNFi or ABA or tofacitinib who newly start TCZ or TNFi showed no increased CV event occurrence among patients with RA under TCZ versus TNFi with a combined HR of 0.84 (95% CI 0.56 to 1.26).30 Another cohort study
confirmed the equivalent impact on CV events incidence of TCZ and TNFi (etanercept).31 However, these results need
to be confirmed by randomised studies with clinical CVD outcomes, such as the ENTRACTE study (NCT01331837); the preliminary results of that study do not highlight a
difference in major adverse CV events between TCZ and etanercept-treated patients.32
No statistical analyses were performed regarding RTX and ABA, since few patients were treated with these drugs. We observed a numerical improvement of ApoA1, leptin and LAR levels under RTX (data not shown), but such results need to be confirmed in a larger sample.
Regarding the comparison of the effects of each treat-ment on CVD risk-associated biomarker profiles, our results show that non-TNFi has an impact on decreasing CVD risk-associated biomarkers that is at least equivalent to or higher than the effect of TNFi. Since TNFi has posi-tive outcomes on the incidence of CVD events,15 we can
extrapolate results concerning biomarkers and infer that non-TNFi agents should also have a positive effect on the CVD event incidence, as suggested recently for TCZ.32
Focusing on the effect of TCZ, we showed a greater improvement (ie, decrease) of the surrogate marker of atherogenicity Lp(a) levels compared with TNFi therapy. Moreover, TCZ has a global comparable effect on other biomarkers, with the exception of a non-significant trend for the deterioration of (increase in) the ApoB100 levels. This finding was consistent with the results obtained by Gabay et al,27 with a greater improvement of CVD
risk-as-sociated biomarkers under TCZ than adalimumab. A recent prospective RA cohort study focusing on Lp(a)
Enseignement Superieur (ABES). Protected by copyright.
on December 13, 2019 at Agence Bibliographique de l
http://rmdopen.bmj.com/
change under TNFi, TCZ, other biotherapies (RTX and ABA) or without biotherapy showed that patients under biotherapy decreased their Lp(a) levels compared with those without biotherapy, but significant difference was reached only for TCZ-treated patients while they had higher total cholesterol and triglycerides plasma concen-tration.33 This suggests that the impact of TCZ on the
CVD incidence may be at least equivalent to the impact of TNFis. Such a result is reassuring for the use of TCZ in patients with RA with CV risk factors.
Improvement of CVD risk-associated biomarker profiles during the course of RA despite elevation of the routinely assessed lipid parameters (LDL, HDL and total choles-terol) could be explained by the direct anti-inflammatory effect of the treatment. Indeed, inflammation affects the expression of numerous enzymes and proteins involved in lipid metabolism, leading to disturbances in the meta-bolic profile.34 Our results demonstrate that patients
responsive to therapy have greater improvements in their biomarker profiles. The response to treatment is related to control of inflammation by the drug. A recent study underlined the role of RA flares and the cumulative RA severity burden exposure on the CVD risk, since patients with RA in remission had similar CVD risks to non-RA subjects and since the CVD risk per time spent in each acute flare vs remission was increased.35
However, the response to treatment in the Tocilizumab monotherapy versus adalimumab monotherapy for treat-ment of rheumatoid arthritis (ADACTA) study27 did not
influence the change in CVD risk-associated biomarkers. This discrepancy between the ADACTA and ROC meta-bolic studies may be related to several differences in the study designs as follows: (1) the line of treatment, since patients experienced their second line of bDMARD therapy in our study and the first line of the treatment in the ADACTA study36 ; (2) the exposure to treatment
(24 weeks vs 8 weeks in ADACTA), suggesting that some patients may need a longer drug exposure to improve their CVD risk-associated biomarker profiles and (3) the prescription of methotrexate in association with bDMARDs in our study, whereas TCZ and adalimumab were administered as monotherapies in the ADACTA study. Interestingly, methotrexate therapy also influences lipid profiles with an effect similar to bDMARDs37 38 and
can potentiate the impact of bDMARDs on CVD risk-asso-ciated biomarkers in a combination regimen.
We acknowledge some limitations of our study. First, the blood samples were not drawn in the fasted state, which limited analysis of the routine lipid profile (HDL, LDL, total cholesterol and triglycerides). However, this ancillary study of a pragmatic trial reflects the daily life care of patients with RA.39 Furthermore, we evaluated circulating levels of
validated biomarkers undisturbed by the non-fasted state of the patient; this approach is more feasible for assessment in daily practice and has been widely used in large cardiology studies.8 40 The effect of steroid prescription on biomarker
changes has not been analysed to avoid multiple additional statistical analyses and because there was no difference in
term of week 0 to week 24 steroid sparing effect between anti-TNF and other biological groups. Second, the hetero-geneity of the sizes of the groups did not allow us to prop-erly evaluate the impact of RTX and ABA on biomarkers in comparison to TNFis, but our current main focus was on TCZ given to a sample size of patients, sufficient to perform robust analyses. Third, the slight improvement of these surrogate of CVD biomarkers suggests but does not imply a decrease of CVD occurrence in practice. Only long-term large study dedicated to this aim will answer to this question.
ConClusions
In conclusion, when there is an inadequate response to a first-line TNFi therapy in active RA, TNFi and non-TNFi therapies improve CVD risk-associated circu-lating biomarkers, which are surrogate markers of ather-ogenicity. Non-TNFi biological agents seem to have a slightly better effect on the LAR and Lp(a) than a TNFi: such a positive effect could be driven by TCZ. The improvement of some biomarkers seems to be driven by the responders to therapy and may reflect the reduction of inflammation due to the treatment. This latter result suggests that achieving good control of the disease could be the goal to control CV risk in patients with RA. In addi-tion to routine lipid assessment such as total cholesterol, HDL and LDL cholesterol and triglycerides, the measure of other CV surrogates could improve the evaluation of CVD risk profile of patients with RA.
author affiliations
1rheumatology Department, Hôpital Saint-antoine, assistance Publique - Hopitaux
de Paris (aP-HP), Paris, France
2Biochemistry Department, Hôpital tenon, aP-HP, Paris, France
3Faculty of Medicine Sorbonne Université, crSa inSerM UMrS_938, Paris, France 4Statethic, levallois-Perret, France
5rheumatology Department, Hôpitaux Universitaires de Strasbourg, Strasbourg,
France
6epidemiology and Statistics research centre, inserm UMr 1153, Paris Descartes
University, Paris, France
Twitter @jeremsellam; @larhumato
acknowledgements the authors thank all patients for participating in this
study and all investigators who included patients in the rOc study: Olivier Brocq, MD; aleth Perdriger, MD; Slim lassoued, MD; Jean-Marie Berthelot, MD; Daniel Wendling, MD, PhD; liana euller-Ziegler, MD; Martin Soubrier, MD; christophe richez, MD, PhD; Bruno Fautrel, MD, PhD; arnaud l constantin, MD, PhD; Jacques Morel, MD, PhD; Melanie gilson, MD; gregoire cormier, MD; Jean Hugues Salmon, MD; Stephanie rist, MD; Frederic lioté, MD, PhD; Hubert Marotte, MD, PhD; christine Bonnet, MD; christian Marcelli, MD, PhD; Olivier Meyer, MD, PhD; elisabeth Solau-gervais, MD, PhD; Sandrine guis, MD, PhD; Jean-Marc Ziza, MD; charles Zarnitsky, MD; isabelle chary-Valckenaere, MD, PhD; Olivier Vittecoq, MD, PhD; alain Saraux, MD, PhD; Yves-Marie Pers, MD, PhD; Martine gayraud, MD; gilles Bolla, MD; Pascal claudepierre, MD, PhD; Marc ardizzone, MD; emmanuelle Dernis, MD; Maxime a Breban, MD, PhD; Olivier Fain, MD, PhD; Jean-charles Balblanc, MD; Ouafaa aberkane, PhD; Marion Vazel, PhD; christelle Back, PhD; Sophie candon, MD, PhD; lucienne chatenoud, MD, PhD; elodie Perrodeau, MSc; Jean Sibilia, MD.
Contributors Pr, JSi and J-eg were involved in the conception and design of the
rOc trial. JSe, aV, Jc and J-eg were involved in the conception of this ancillary study. J-PB and SF performed biomarker assessments. aV, JSe and Sr designed and performed the statistical analysis. aV and JSe wrote the initial draft of the manuscript. all authors were involved in the analysis and interpretation of the data. all authors drafted the manuscript and revised it critically. all authors approved
Enseignement Superieur (ABES). Protected by copyright.
on December 13, 2019 at Agence Bibliographique de l
9 Virone a, et al. RMD Open 2019;5:e000897. doi:10.1136/rmdopen-2019-000897
Rheumatoid arthritis Rheumatoid arthritis Rheumatoid arthritis the final version to be submitted for publication, and all authors agreed to be
accountable for all aspects of the work.
Funding the rOc trial was sponsored by the French Ministry of Health
(Programme Hospitalier de recherche clinique national 2009/4507 eUDract no: 2009-013482-26) and promoted by the Direction de la recherche clinique et de l’innovation, Strasbourg University Hospital.
Competing interests JSe: consulting fees and symposia: BMS, Janssen, Menarini,
MSD, Pfizer, roche France, Fresenius Kabi, lilly, Sandoz and abbvie; research grants: roche France and Pfizer. Jc: fees for academic conferences by Janssen, MSD, ViiV Healthcare, gilead, chugai and novartis. JSi: fees from abbvie, Bristol-Myers Squibb, Merck, Sharp, Dohme, UcB, Pfizer, roche, novartis, glaxoSmithKline, actelion, amgen and Hospira. FB: current or past board member of Pfizer, abbvie, Merck Serono, Servier, expanscience, Sanofi, UcB, novartis, Biogaran, Biogen and Proxymagen; consultant for Janssen and Flexion; received grants from Servier and trB chemedica; and is on speaker’s bureau for Servier and abbvie. J-eg: consulting fees and research grants: abbvie, BMS, MSD, UcB, roche and Pfizer.
Patient consent for publication not required.
ethics approval the institutional review board of the comité de Protection des
Personnes-est-1, Strasbourg, France, approved the study and all patients provided written informed consent after receiving oral and written information.
Provenance and peer review not commissioned; externally peer reviewed.
data availability statement Data are available on reasonable request.
open access this is an open access article distributed in accordance with the
creative commons attribution non commercial (cc BY-nc 4.0) license, which permits others to distribute, remix, adapt, build upon this work non-commercially, and license their derivative works on different terms, provided the original work is properly cited, appropriate credit is given, any changes made indicated, and the use is non-commercial. See: http:// creativecommons. org/ licenses/ by- nc/ 4. 0/.
RefeRences
1. Avina-Zubieta JA, Thomas J, Sadatsafavi M, et al. Risk of incident cardiovascular events in patients with rheumatoid arthritis: a meta-analysis of observational studies. Ann Rheum Dis 2012;71:1524–9. 2. Ogdie A, Yu Y, Haynes K, et al. Risk of major cardiovascular events
in patients with psoriatic arthritis, psoriasis and rheumatoid arthritis: a population-based cohort study. Ann Rheum Dis 2015;74:326–32. 3. Van Doornum S, McColl G, Wicks IP. Accelerated atherosclerosis: an
extraarticular feature of rheumatoid arthritis? Arthritis & Rheumatism
2002;46:862–73.
4. Sattar N, McCarey DW, Capell H, et al. Explaining How “High-Grade” Systemic Inflammation Accelerates Vascular Risk in Rheumatoid Arthritis. Circulation 2003;108:2957–63.
5. Conroy RM, Pyörälä K, Fitzgerald AP, et al. Estimation of ten-year risk of fatal cardiovascular disease in Europe: the score project. Eur Heart J 2003;24:987–1003.
6. Myasoedova E, Crowson CS, Kremers HM, et al. Lipid paradox in rheumatoid arthritis: the impact of serum lipid measures and systemic inflammation on the risk of cardiovascular disease. Ann Rheum Dis 2011;70:482–7.
7. Anne L, Freiberg Jacob J, Nordestgaard Børge G. Fasting and Nonfasting lipid levels. Circulation 2008;118:2047–56.
8. Walldius G, Jungner I, Holme I, et al. High apolipoprotein B, low apolipoprotein A-I, and improvement in the prediction of fatal myocardial infarction (AMORIS study): a prospective study. The Lancet 2001;358:2026–33.
9. Walldius G, Jungner I. Apolipoprotein B and apolipoprotein A-I: risk indicators of coronary heart disease and targets for lipid-modifying therapy. J Intern Med 2004;255:188–205.
10. Öhman M, Öhman M-L, Wållberg-Jonsson S. The apoB/apoA1 ratio predicts future cardiovascular events in patients with rheumatoid arthritis. Scand J Rheumatol 2014;43:259–64.
11. Bennet A, Di Angelantonio E, Erqou S, et al. Lipoprotein(a) levels and risk of future coronary heart disease: large-scale prospective data.
Arch Intern Med 2008;168:598–608.
12. Kang Y, Park H-J, Kang M-I, et al. Adipokines, inflammation, insulin resistance, and carotid atherosclerosis in patients with rheumatoid arthritis. Arthritis Res Ther 2013;15.
13. Gonzalez-Gay MA, Llorca J, Garcia-Unzueta MT, et al. High-Grade inflammation, circulating adiponectin concentrations and cardiovascular risk factors in severe rheumatoid arthritis. Clin Exp Rheumatol 2008;26:596–603.
14. Finucane FM, Luan J, Wareham NJ, et al. Correlation of the leptin:adiponectin ratio with measures of insulin resistance in non-diabetic individuals. Diabetologia 2009;52:2345–9.
15. ASL L, Symmons DPM, Lunt M, et al. Relationship between exposure to tumour necrosis factor inhibitor therapy and incidence and severity of myocardial infarction in patients with rheumatoid arthritis. Ann Rheum Dis 2017.
16. Jamnitski A, Visman IM, Peters MJL, et al. Beneficial effect of 1-year etanercept treatment on the lipid profile in responding patients with rheumatoid arthritis: the ETRA study. Ann Rheum Dis
2010;69:1929–33.
17. Daïen CI, Duny Y, Barnetche T, et al. Effect of TNF inhibitors on lipid profile in rheumatoid arthritis: a systematic review with meta-analysis. Ann Rheum Dis 2012;71:862–8.
18. Kawashiri S-ya, Kawakami A, Yamasaki S, et al. Effects of the anti-interleukin-6 receptor antibody, tocilizumab, on serum lipid levels in patients with rheumatoid arthritis. Rheumatol Int 2011;31:451–6. 19. Strang AC, Bisoendial RJ, Kootte RS, et al. Pro-Atherogenic
lipid changes and decreased hepatic LDL receptor expression by tocilizumab in rheumatoid arthritis. Atherosclerosis
2013;229:174–81.
20. McInnes IB, Thompson L, Giles JT, et al. Effect of interleukin-6 receptor blockade on surrogates of vascular risk in rheumatoid arthritis: measure, a randomised, placebo-controlled study. Ann Rheum Dis 2015;74:694–702.
21. Rao VU, Pavlov A, Klearman M, et al. An evaluation of risk factors for major adverse cardiovascular events during tocilizumab therapy.
Arthritis & Rheumatology 2015;67:372–80.
22. Zhang J, Xie F, Yun H, et al. Comparative effects of biologics on cardiovascular risk among older patients with rheumatoid arthritis.
Ann Rheum Dis 2016;75:1813–8.
23. Provan SA, Berg IJ, Hammer HB, et al. The impact of newer biological disease modifying anti-rheumatic drugs on cardiovascular risk factors: a 12-month longitudinal study in rheumatoid arthritis patients treated with rituximab, abatacept and Tociliziumab. PLoS One 2015;10:e0130709.
24. Kerekes G, Soltész P, Dér H, et al. Effects of rituximab treatment on endothelial dysfunction, carotid atherosclerosis, and lipid profile in rheumatoid arthritis. Clin Rheumatol 2009;28:705–10.
25. Novikova DS, Popkova TV, Lukina GV, et al. The effects of rituximab on lipids, arterial stiffness and carotid intima-media thickness in rheumatoid arthritis. J Korean Med Sci 2016;31:202–7. 26. Mathieu S, Couderc M, Pereira B, et al. Effects of 6 months of
abatacept treatment on aortic stiffness in patients with rheumatoid arthritis. BTT 2013.
27. Gabay C, McInnes IB, Kavanaugh A, et al. Comparison of lipid and lipid-associated cardiovascular risk marker changes after treatment with tocilizumab or adalimumab in patients with rheumatoid arthritis.
Ann Rheum Dis 2016;75:1806–12.
28. Gottenberg J-E, Brocq O, Perdriger A, et al. Non–TNF-Targeted biologic vs a second anti-TNF drug to treat rheumatoid arthritis in patients with insufficient response to a first anti-TNF drug. JAMA
2016;316:1172–80.
29. van Gestel AM, Prevoo MLL, van't Hof MA, et al. Development and validation of the European League against rheumatism response criteria for rheumatoid arthritis: comparison with the preliminary American College of rheumatology and the world health organization/international League against rheumatism criteria.
Arthritis & Rheumatism 1996;39:34–40.
30. Kim SC, Solomon DH, Rogers JR, et al. Cardiovascular safety of tocilizumab versus tumor necrosis factor inhibitors in patients with rheumatoid arthritis: a Multi‐Database cohort study. Arthritis & Rheumatology 2017;69:1154–64.
31. Generali E, Carrara G, Selmi C, et al. Comparison of the risks of hospitalisation for cardiovascular events in patients with rheumatoid arthritis treated with tocilizumab and etanercept. Clin Exp Rheumatol 2018;36:310–3.
32. Giles J, Sattar N, Gabriel S, et al. Comparative cardiovascular safety of tocilizumab vs etanercept in rheumatoid arthritis: results of a randomized, parallel-group, multicenter, Noninferiority, phase 4 clinical trial. ACR Meet. Abstr 2016.
33. García-Gómez C, Martín-Martínez MA, Castañeda S, et al. Lipoprotein(a) concentrations in rheumatoid arthritis on biologic therapy: Results from the CARdiovascular in rheuMAtology study project. J Clin Lipidol 2017;11:749–56.
34. Khovidhunkit W, Kim M-S, Memon RA, et al. Thematic review
series: The Pathogenesis of Atherosclerosis. Effects of infection and
inflammation on lipid and lipoprotein metabolism mechanisms and consequences to the host. J Lipid Res 2004;45:1169–96.
35. Myasoedova E, Chandran A, Ilhan B, et al. The role of rheumatoid arthritis (rA) flare and cumulative burden of RA severity in the risk of cardiovascular disease. Ann Rheum Dis 2016;75:560–5.
36. Gabay C, Emery P, van Vollenhoven R, et al. Tocilizumab monotherapy versus adalimumab monotherapy for treatment
Enseignement Superieur (ABES). Protected by copyright.
on December 13, 2019 at Agence Bibliographique de l
http://rmdopen.bmj.com/
of rheumatoid arthritis (ADACTA): a randomised, double-blind, controlled phase 4 trial. The Lancet 2013;381:1541–50. 37. Filippatos TD, Derdemezis CS, Voulgari PV, et al. Effects of 12
months of treatment with disease-modifying anti-rheumatic drugs on low and high density lipoprotein subclass distribution in patients with early rheumatoid arthritis: a pilot study. Scand J Rheumatol
2013;42:169–75.
38. Navarro-Millán I, Charles-Schoeman C, Yang S, et al. Changes in lipoproteins associated with methotrexate therapy or combination
therapy in early rheumatoid arthritis: results from the treatment of early rheumatoid arthritis trial. Arthritis & Rheumatism
2013;65:1430–8.
39. Sox HC, Lewis RJ. Pragmatic Trials: Practical Answers to "Real World" Questions. JAMA 2016;316:1205–6.
40. McQueen MJ, Hawken S, Wang X, et al. Lipids, lipoproteins, and apolipoproteins as risk markers of myocardial infarction in 52 countries (the INTERHEART study): a case-control study. The Lancet
2008;372:224–33.
Enseignement Superieur (ABES). Protected by copyright.
on December 13, 2019 at Agence Bibliographique de l