HAL Id: hal-03007188
https://hal.archives-ouvertes.fr/hal-03007188
Submitted on 8 Dec 2020
HAL is a multi-disciplinary open access archive for the deposit and dissemination of sci-entific research documents, whether they are pub-lished or not. The documents may come from teaching and research institutions in France or
L’archive ouverte pluridisciplinaire HAL, est destinée au dépôt et à la diffusion de documents scientifiques de niveau recherche, publiés ou non, émanant des établissements d’enseignement et de recherche français ou étrangers, des laboratoires
Control of air micro-jets by the use of dielectric barrier
discharges
Pedro Garcia Eijo, Roberto Sosa, Jean-Luc Aider, Juan Martin Cabaleiro
To cite this version:
Pedro Garcia Eijo, Roberto Sosa, Jean-Luc Aider, Juan Martin Cabaleiro. Control of air micro-jets by the use of dielectric barrier discharges. Sensors and Actuators A: Physical , Elsevier, 2020, 305, pp.111937. �10.1016/j.sna.2020.111937�. �hal-03007188�
Control of air micro-jets by the use of dielectric barrier discharges
Pedro Garcia Eijoa, Roberto Sosaa, Jean-Luc Aiderc, Juan Martin Cabaleiroa,b,∗aLaboratorio de Fluidodin´amica, FIUBA, CONICET, Av. Paseo Col´on 850, Buenos Aires, Argentina.
Tel: +5411 52850467
bLaboratorio de Micro y Nanoflu´ıdica y Plasmas, UdeMM, Av. Rivadavia 2258, Buenos Aires, Argentina. cLaboratoire PMMH, UMR 7636 CNRS, UPMC, UPD, ESPCI ParisTech, 10 rue Vauquelin, 75231 Paris,
France.
Abstract
In this study, we used Dielectric Barrier Discharge (DBD) Plasma Actuators to control and pulse two-dimensional free air micro-jets at low Reynolds numbers (Re < 200), avoiding the use of mobile and mechanical devices such as, for example, valves. We performed experimental measurements and visualizations to characterize the effect of different DBD burst frequencies (1 Hz to 80 Hz) and different DBD applied voltages, on both the external and internal flows. Preliminary results show an increase in the external flow rate (20 %) and a promising and effective method to pulse micro-jets at these frequencies.
1. Introduction
Micro-jets are jets whose at least one dimension is lower than 1 mm. Their study and use have become more and more popular because of their great potential for flow control, especially control of separated flows. The pulsed micro-jets are a new and promising type of actuator which have been developed as an extension of the stationary micro-jets used for the control of external flow separation [1, 2] and for active control of supersonic impingement tones in [3]. Synthetic Micro-jets have been also successfully developed for aerodynamic flow control in [4]. The interaction of synthetic jets with an external cross flow over the surface in which they are mounted can displace the local streamlines and induce an apparent or virtual change in the shape of the surface [5].
∗Corresponding author
Indeed, if pulsed jets have proved their efficiency to control separated flows, their minia-turization is mandatory in the perspective of industrial applications. Moreover, it is nec-essary to use low-cost, low-consumption, low-weight devices to ensure a positive energy balance to the flow control. A realistic solution is to use MEMS (Micro Electro Mechani-cal Systems) actuators to pulse micro-jets. For instance, it was shown recently that using MEMS pulsed micro-jets to control the separated flow over the rear slant of an Ahmed body ensure a much better energy gain compared to macro-jets [6]. It was also demonstrated that the same MEMS pulsed micro-jets could also decrease the lift coefficient and suppress the recirculation bubble over the rear window of a full-scale vehicle [7]. Unfortunately, pulsed micro-jets are both difficult to design and build using the MEMS technology. Small moving mechanical parts are also an issue when considering industrial applications which require robustness.
An interesting alternative is to use Dielectric Barrier Discharge (DBD) to generate a well-controlled jet parallel to the wall. The DBD requires electrodes which can be easily integrated over a wall without disturbing the flow and without the need of upstream pressur-ized air circuit. Because of their high frequency response with very low power consumption, plasma actuators have become popular for active flow control experiments.
They have been successfully used for separation control on flat plates [8, 9], bluff bodies [10, 11], airfoils [12, 13, 14], cylinders [15], to induce mixing enhancement of jets [16], and cooling enhancement [17], among others. Moreover, in [18] a three-dimensional simulation of dielectric barrier discharge has been used to predict the complicated flow structure inside a plasma induced micropump, generating an induced flow rate of the order of a few mL·min−1. Furthermore, Debiasi and Jiun-Ming [19] present an experimental study to investigate the flow induced by DBD actuators placed on a channel walls, whose distance (channel height) they varied between 2-30 mm. In [20] a numerical and experimental study was carried out to characterize a DBD-plasma driven channel flow in a 20 mm high rectangular channel, indicating the possibility of using such channel for pumping small flows as demanded by control applications. In [16] a pulsed-plasma jet has been characterized for potential use in supersonic flows (Mach 3) and the fraction of power that goes to gas heating was estimated
to be about only 10% of the input power, which is consistent with the values available in the literature. Comprehensive and extended reviews of this subject can be found in [21, 22]. If the DBD actuators have a strong potential for many applications because of their small size and easy integration over a wall, their limited velocity and flow rate make them difficult to use in high-speed aerodynamics. The maximum velocity of a DBD is about 8 m · s−1 in a small region confined into the lower part of the boundary layer. This is the reason why they are also well-suited to confined geometries, such as micro-channels or micro-nozzles. This is why we think DBD can be an efficient way to control micro-jets. The objective of this work is to evaluate the potential of DBD to pulse a 2D micro-jet without any mechanical moving parts.
In the first section, we present the method used to build the micro nozzle and the electrical assembly to generate the DBD discharges. We also describe the experimental set-up that allowed us to visualize the micro-jet and to compute the fluid velocity fields by using Particle Image Velocimetry (PIV). Then we characterize the micro-jets without and with DBD actuation. We finally discuss the potential and limitations of DBD actuation to control and pulse efficiently micro-jets.
2. Experimental Set-up
We have built an experimental set-up that allowed us to:
• generate the micro-jet with controlled pressure and flow rate values (pneumatic cir-cuit).
• produce the plasma discharges needed to pulse the micro-jet (electric circuit and DBD actuator channel).
• obtain high quality images for PIV (particle image velocimetry).
A global overview of the experimental set-up is shown in Fig. 1. It is composed of three main parts:
• First, the jet generation circuit (compressed air, jet nozzle, DBD actuator and glass microchannel).
• Second, the DBD signal generation and power amplification.
• Third, the visualization set-up using a smoke generation device, a laser-sheet and a high-speed camera.
Figure 1: Experimental Set-up Diagram. 1) Oscilloscope, 2) Signal generator, 3) voltage amplifier, 4) Ignition coil, 5) High-voltage probe, 6) Air compressor and tank, 7) Flowmeter , 8) Needle valve, 9) Manometer, 10) Plastic nozzle, 11) Glass microchannel and electrodes(orange), 12) High-speed camera, 13) Laser.
2.1. Pulsed-jet generation
The pressure is increased (4 to 7 Bar) using an air compressor while the regulation is performed by a needle valve (0.5 to 4 mBar at the outlet) connected as shown in Fig. 1. Flow rate and pressure are measured by a flowmeter and a U-tube water manometer.
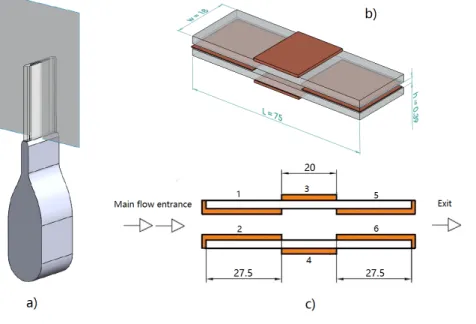
A plastic chamber with a convergent (Fig. 2.a) has been built using a 3D printer to allow a smooth transition of the flow into the glass micro-channel. The micro-channel following the convergent section has been built using two 1 mm thick microscope glass slides. The
channel height h is 0.39 mm while its width w is 18 mm and its length L is 75 mm. The electrodes are made with copper sheets glued to the glass slides, as illustrated in Fig. 2.b.
Figure 2: a) Plastic Nozzle, glass microchannel and laser iluminated plane, b) glass microchannel together with the set of electrodes, c) configuration of the copper electrodes to generate the plasma jets inside the microchannel walls. Dimensions are in mm.
With this set of electrodes, two types of discharges can be generated depending on the wire connection. In one case, a “positive” discharge is induced along the direction of the flow (electrodes 1 and 2 were grounded while 3 and 4 were connected to the power supply, 5 and 6 were floating) as shown on Fig. 2.c). In the second case “negative” discharges are generated in the opposite direction to the main flow (electrodes 1 and 2 were floating, 3 and 4 were connected to the power supply, 5 and 6 were grounded).
2.2. DBD electrical signals
The plasma is generated on both sides of the glass plate when a high-tension (several kV ) signal is applied to the electrodes. To avoid the plasma generated by the external electrode, it has been insulated with epoxy.
The signal applied to the electrode is generated by a wave generator (fac = 3 kHz), an
11 kV . A high-voltage probe was attached to the wires of the DBD actuator. The output signal is measured and controlled by an oscilloscope.
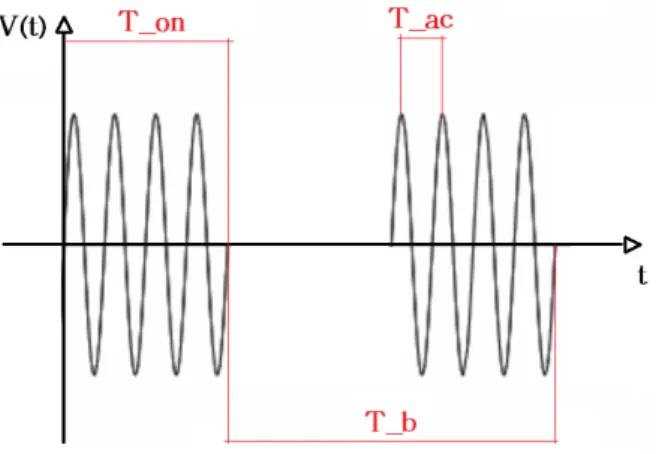
Instead of applying a constant signal, it is modulated using the burst mode with a period Tb. It allows to turn on and off the plasma discharge at a frequency fpulse = 1/Tb with a
duty cycle DC defined as DC = Ton/Tb (Fig. 3).
Figure 3: Schematic voltage signal vs time. DC = 50 %
2.3. Flow visualization
The main purpose of this part of the setup was to generate high quality images for Particle Image Velocimetry (PIV) post processing. A transparent sealed box was built to retain smoke particles generated by the smoke generator while a 470 nm Laser diode was used to illuminate the smoke particles and allowed the high-speed camera to capture high-resolution images. A cylindrical lens was used to open the collimated light beam and generate a Laser sheet. The jet itself is not seeded, mainly because smoke particles would deposit on the walls on the electrodes zone, probably interfering with the DBD.
Moreover, even if we succeeded in seeding the entire flow, we would need either more light and a faster camera, or to do phase reconstruction instead of time resolved PIV. Indeed, we use a PCO 1200s high-speed camera and a continuous blue 1.5 W laser diode which let us acquire snapshots with a suitable signal to noise ratio up to 1 kHz. To obtain good velocity fields, one has to keep particle displacement between two snapshots below 5 pixels. It corresponds to a maximum velocity around ∼ 0.2 m.s−1. The estimated velocities in the
core of the jet are ranging between 0.5 to 4 m.s−1 which could not be measured with our experimental setup.
Additionally, it is worth calculating the Stokes number (eq. 1) of the seeding particles to ensure that they will correctly follow the flow streamlines. It is defined as:
Stk = ρpD
2 pU0
18µah
(1) Where ρp is the particle density (103 kgm3), Dp is the nominal particle size (∼ 4 µm),
µa is the air dynamic viscosity (1.81 10−5 kgm.s), U0 the fluid velocity (∼ 1 m.s−1), and h
the height of the micro-channel (0.39 mm) (see Fig. 2). The resulting stokes numbers is Stk = 0.12 which means that particles will follow fluid streamlines closely with good tracing accuracy [23].
The laser sheet was specifically placed in the mid-section of the glass channel outlet as shown in Fig. 2. It is important to notice that in order to confirm that the micro-jet is 2D, we took snapshots of the flow in the two main nozzle symmetry planes (front and side views). The flow in the middle section remains fairly two dimensional within the vicinity of the outlet section. Axis-switching [24] phenomenon was not observed in our experiments within the visualized zone (See Fig. 2.a).
3. Results and Discussion
The micro-jet is pulsed at different frequencies fpulse varying from 1 to 80 Hz, with what
we called positive and negative discharges, associated to a ionic wind in the direction, or opposite to the main flow, respectively. We also applied different voltages leading to an increase of the volume force applied inside the micro-channel. The Reynolds number is varied from 25 to 200, based on the pressure and flow-rate, and studied the effect of the DBD discharges on the jet at the outlet of the nozzle through visualizations and PIV.
The results and discussion section is be divided in two parts. First, a qualitative analysis with the experimental results is carried out pointing out the influence of some of the main parameters such as Reynolds number and DBD frequency, that characterize the shape of
the resultant jet structure. In the second part a deeper analysis of the DBD frequency and “polarity” role is presented in a quantitative manner.
3.1. Qualitative analysis
In the following, the jet Reynolds number is defined as: Re = ujeth
ν (2)
where ν = 1.52 × 10⁻⁵ m2.s is the kinematic viscosity at ambient temperature. u jet is
the mean air velocity inside the microchannel calculated using the flowrate Q: ujet = hwQ,
leading to to Re = 15 for Q = 0.24 l.min−1.
The transient effect of the discharges on the fluid dynamics of the micro-jet can be seen in Fig. 4 for a flowrate of Q = 0.24 l/min. The time-step between the snapshots is 0.31 s for a pulsing frequency fpulse = 1 Hz. The first snapshot corresponds to the continuous
free micro-jet (DBD off). The following snapshots show clearly the transport and growth of a vortex induced by the DBD actuator. It confirms that it is possible to induce a well-controlled perturbation of the free micro-jet.
Figure 4: Visualization of the micro-jet pulsed at fpulse = 1Hz in the opposite direction, with Q =
0.24 l/min (∆V = 12 kV , Re = 15). The time-step between each snapshot is ∆T = 0.31 s.
If the DBD pulsing frequencies is increased, it changes the size and the spacing between the induced vortices, as shown on Fig. 5). A higher pulsing frequency leads to smaller and
closer vortices for a given flow rate. For frequencies higher than a certain value (in this case 40 Hz) the effect of the DBD starts to decrease. It is important to note that the effect of the DBD will also diminish if the Reynolds number is increased. In this case, the DBD momentum contribution becomes smaller compared to the main flow momentum.
(a) f = 5 Hz (b) f = 10 Hz (c) f = 20 Hz (d) f = 40 Hz
Figure 5: Influence of the pulsing frequency on the creation of the induced vortices (h = 390 µm, ∆V = 12 kV , negative, Q = 0.24 l/min, Re = 15).
3.2. Quantitative analysis of the pulsing jets
From the resulting experimental snapshots we obtained the velocity fields time-series through PIV computations as illustrated in Fig. 6. To quantify some of the effects of the DBD discharges, we define a new variable Uy out(t), the jet velocity averaged along the outlet
of the microchannel. It is obtained simply through the finite integration along the red line marked in Fig. 6 of the vertical velocity Uy(t) divided by the length L of that line (eq. 3). In
other words, Uy out(t) is simply the mean vertical velocity over the red line at each time-step.
Uy out(t) = 1 L Z −L/2 L/2 Uy(t) · dx (3)
The distance between the horizontal line and the outlet is 3 mm (see Fig. 6) in order to obtain a clear and stable signal.
It is worth noticing that the subscript out in Uy out(t) is indicating that the velocity
Figure 6: Size and location of the PIV window used to compute Uy out(t) along the marked red line.
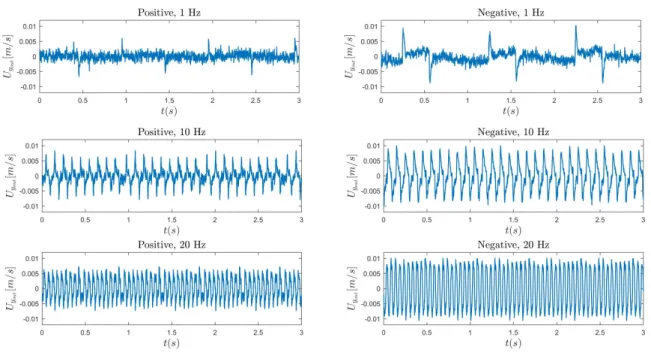
A typical Uy out(t) time-series is shown on Fig. 7 for different actuation frequencies fpulse
for positive or negative DBD discharges. It is important to mention that we centered each time-series around zero in order to be able to compare more easily the effect of the discharges. In all cases we observe that the predominant frequency of the resulting signal is the DBD pulsing frequency. It clearly demonstrates that it is possible to pulse the micro-jet with the frequency of the DBD actuators, as expected.
Figure 7: Typical Uy out(t) time series obtained for ∆V = 12 kV , and Re = 15.
We performed a FFT analysis of each signal showed in 7. The results can be seen in Fig. 8. In each case, the dominant frequency matches the DBD pulsing frequency as expected. Moreover, the rest of the harmonics are uneven multiples of the dominant frequency. Another interesting result, is that the FFT of the positive discharge presents more noise than the negative one, pointing out that blowing against the micro-jet flow is more efficient than blowing in the same direction.
Figure 8: FFT analysis of each signal obtained in figure 7
In Fig. 9 the Uy out(t) amplitudes are plotted versus the frequency for different Reynolds
numbers and for positive and negative discharges. As mentioned before, the effect of the DBD pulsing frequency plays a major role on the jet velocity fluctuations.
For the three Reynolds numbers, increasing the actuation frequency reduces the ampli-tude of the fluctuations. Moreover, in each case there is an optimal frequency maximizing the amplitude of the fluctuations, ranging between 10 to 20 Hz.
Also, for lower frequencies, the “negative” polarity leads to higher amplitudes than the “positive” polarity. However this trend needs to be confirmed with more experiments. Fi-nally, it can be noticed that for a given frequency larger effects are observed for lower Reynolds numbers (the blue line, which corresponds to Re = 52, has the lowest ampli-tudes).
Figure 9: Amplitude of the Uy out(t) signal, as a function of the pulsing frequency fpulsefor Re = 15 (black),
Re = 26 (red) and Re = 52 (blue). The DBD voltage is ∆V = 12 kV for all experiments.
3.3. Increase of the mean outlet entrained flow.
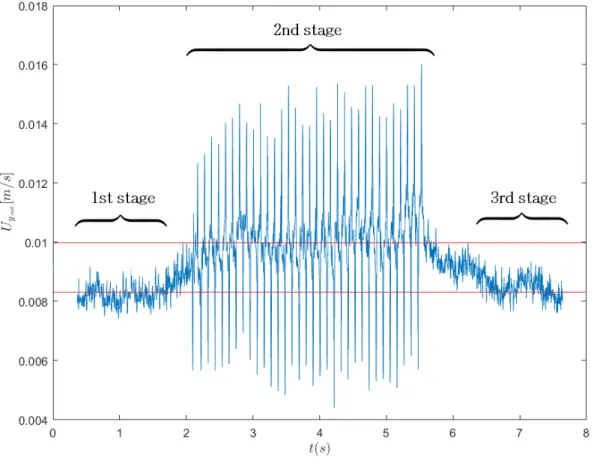
The typical signal response is represented in Fig. 10. The first part of the time-series shows the Uy out(t) at the section indicated in Fig. 6 when the discharges are turned off. The
second part shows clearly the effect of the plasma discharges, resulting in an increase in the Uy out(t). Finally, the last part of the time-series represents the signal when the discharges
are turned off again.
This strategy to measure the changes in the Uy out(t) or, as explained before, in the total
flow rate, allowed us to have a clear view of the discharges effect by comparing the first and second stage. During the actuation time, one can see clearly the sharp increase of velocity associated to each DBD actuation. Once the short DBD pulse is turned off, the velocity
starts to decrease until the DBD is turned on again. One can see a slow increase of the jet velocity as the DBD pulses are actuated successively. It shows that the actuation time also plays a role. If the actuation frequency was lower, the jet velocity would have time to decrease. If the actuation time (time during which the DBD is on) had been longer, maybe the maximum jet velocity would have been slightly higher at the end of the actuation time. This time-series shows that the choice of the DBD actuation frequency and the burst frequency both play an important role to optimize the jet pulsations.
Figure 10: Time series of Uy out(t) showing the three detail of a burst period, centered on the actuated part
of the signal for ∆V = 12 kV , Re = 26, fpulse = 19 Hz, negative.
According to our measurements, we can increase the Uy out(t) up to 20 % for a DBD
pulsing frequency of 19 Hz. We have seen that the amplitude of the pulsation depends on the DBD frequency, with a maximum value between 10 Hz and 20 Hz. These results strengthen the hypothesis that the fluid response and effectiveness depends on the DBD
pulsing frequency.
3.4. Frequency response analysis
To explain why the discharges have a more noticeable effect on the jet for certain fre-quencies, a frequency analysis has been carried out. The flow is perturbed with a single pulse of the DBD discharge in order to obtain the fundamental frequencies of the resultant jet response. A typical example is shown on Fig. 11 where Uy out(t), measured at y0 = 10mm, is
plotted with the response to a single DBD pulse. This times-series are collected for different y0 and three different Reynolds numbers. Each time-series are analyzed through FFT to
find the dominant frequency.
It is worth noticing that each ”y0” line (see Fig. 6) has a different velocity profile and,
consequently, a different dominant frequency. The Fourier analysis of the different impulse responses lead to the dominant frequencies for each Reynolds number and each vertical position. In Fig. 12 the frequencies are plotted as a function of y0 for Re = 15, Re = 26 and
Figure 11: Example of the response of the jet to a negative DBD pulse Uy out(t) for ∆V = 15 kV , Re = 26
and y0= 10mm. The voltage as a function of time is added to show the time-delay between the DBD pulse
Figure 12: Natural frequencies of the jet in response to a DBD pulse as a function of the vertical position y0 for Re = 15, Re = 26 and Re = 52.
The results shown on Fig. 12 can be divided into three main parts. In the first part (1), where y0 ranges between 0 and 5 mm, the dominant frequencies decrease sharply from 55 to
34 Hz. In the second part (2), where 5mm < y0 < 15mm, the frequencies drop more slowly
from 34 to 15 Hz. Finally, further away form the jet nozzle, the frequencies are below the value 15 Hz and converges toward an asymptotic value around 10 Hz.
This is also illustrated in Fig. 13 where the obtained dominant frequencies are plotted in a contour plot, next to a real image of the jet. One can see that most of the domain is coloured in blue, which means that the frequency spectrum ranges between 28 to 10 Hz.
Figure 13: Snapshot of the pulsed jet (left) for f = 10Hz, together with a contour plot of the dominant frequencies (right), for ∆V = 12 kV and Re = 15.
From these measurements, it can be concluded that there are indeed some frequencies which will be amplified by the jet. if we excite the domain with periodic perturbations, the resonance frequency of the jet profile will depend on the distance from the outlet nozzle (y0). According to Fig. 12, the range of the amplified frequencies are between 55 and
10 Hz. Looking at the frequency response further away, more than 7 mm from the nozzle, the dominant frequency ranges between 28 and 10 Hz (See Fig. 13). These results are in agreement with the experimental results shown in the previous sections, where we have shown that the jet pulsation is maximum for frequencies ranging between 10 to 50 Hz.
4. Conclusions
We have presented experimental results showing that a DBD can be used to modulate an air microjet for 25 < Re < 200. Through the quantitative analysis of the experimental results, we found out that the predominant frequency of the pulsed micro-jet is in fact the DBD pulsing frequency. Moreover, the DBD pulsing frequency also plays an important role on the pulsation efficiency. For lower frequencies, it seems that the “negative” polarity shows a higher impact on the jet. In the cases presented here, the frequency that leads to
the highest perturbation amplitude is around 20 Hz. This result is in accordance with the Fourier analysis. Finally, we found out that the jet modulation results in an increase of the total flowrate (including entrainment). In our experiments, we increased the flowrate up to 20% for a DBD pulsing frequency of 19 Hz. All these results confirm that it is possible to use a DBD to efficiently pulse a micro-jet without any mechanical or moving parts.
5. Acknowledgements
References
[1] V. Kumar, F. S. Alvi, Use of high-speed microjets for active separation control in diffusers, AIAA Journal 44 (2) (2006) 273–281. doi:10.2514/1.8552.
URL https://doi.org/10.2514/1.8552
[2] S. Aubrun, J. McNally, F. Alvi, A. Kourta, Separation flow control on a generic ground vehicle using steady microjet arrays, Experiments in Fluids 51 (5) (2011) 1177–1187. doi:10.1007/s00348-011-1132-0. URL https://doi.org/10.1007/s00348-011-1132-0
[3] J. J. Choi, A. Annaswamy, H. Lou, F. S. Alvi, Active control of supersonic impingement tones using steady and pulsed microjets, Experiments in Fluids 41 (6) (2006) 841–855. doi:10.1007/s00348-006-0189-7.
URL http://sci-hub.tw/10.1007/s00348-006-0189-7
[4] J.-C. Gerbedoen, A. Talbi, R. Viard, V. Preobrazhensky, A. Merlen, P. Pernod, Elaboration of compact synthetic micro-jets based on micro magneto-mechanical systems for aerodynamic flow control, Procedia Engineering 120 (2015) 740–743.
URL https://doi.org/10.1016/j.proeng.2015.08.789
[5] A. Glezer, M. Amitay, Synthetic jets, Annual Review of Fluid Mechanics 34 (2002) 503–529. URL https://doi.org/10.1146/annurev.fluid.34.090501.094913
[6] P. Joseph, X. Amandolese, C. Edouard, J.-L. Aider, Flow control using mems pulsed micro-jets on the ahmed body, Experiments in Fluids 54 (1) (2013) 1442. doi:10.1007/s00348-012-1442-x.
URL https://doi.org/10.1007/s00348-012-1442-x
[7] J.-L. Aider, P. Joseph, T. Ruiz, P. Gilotte, Y. Eulalie, C. Edouard, X. Amandolese, Active flow control using pulsed micro-jets on a full-scale production car, International Journal of Flow Control 6 (1) (2014) 1 – 20.
[8] J. Roth, D. Sherman, S. Wilkinson, Boundary layer flow control with a one atmosphere uni-form glow discharge surface plasma, American Institute of Aeronautics and Astronautics, 1998. doi:doi:10.2514/6.1998-328.
URL https://doi.org/10.2514/6.1998-328
[9] T. Jukes, K.-S. Choi, G. Johnson, S. Scott, Turbulent Boundary-Layer Control for Drag Reduction Us-ing Surface Plasma, American Institute of Aeronautics and Astronautics, 2004. doi:doi:10.2514/6.2004-2216.
URL https://doi.org/10.2514/6.2004-2216
[10] F. Thomas, A. Kozlov, T. Corke, Plasma Actuators for Bluff Body Flow Control, American Institute of Aeronautics and Astronautics, 2006. doi:doi:10.2514/6.2006-2845.
[11] T. McLaughlin, M. Munska, J. Vaeth, T. Dauwalter, J. Goode, S. Siegel, Plasma-Based Actua-tors for Cylinder Wake Vortex Control, American Institute of Aeronautics and Astronautics, 2004. doi:doi:10.2514/6.2004-2129.
URL https://doi.org/10.2514/6.2004-2129
[12] M. L. Post, T. C. Corke, Separation control on high angle of attack airfoil using plasma actuators, AIAA Journal 42 (11) (2004) 2177–2184. doi:10.2514/1.2929.
URL https://doi.org/10.2514/1.2929
[13] T. Corke, M. Post, Overview of Plasma Flow Control: Concepts, Optimization, and Applications, American Institute of Aeronautics and Astronautics, 2005. doi:doi:10.2514/6.2005-563.
URL https://doi.org/10.2514/6.2005-563
[14] R. Sosa, G. Artana, Steady control of laminar separation over airfoils with plasma sheet actuators, Journal of Electrostatics 64 (7-9) (2006) 604–610.
URL https://doi.org/10.1016/j.elstat.2005.10.029
[15] G. Artana, R. Sosa, E. Moreau, G. Touchard, Control of the near wake flow around a circular cylinder with electrohydrodynamic actuators, Experiments in Fluids 35 (6) (2003) 580–588. doi:10.1007/s00348-003-0704-z.
URL http://sci-hub.tw/10.1007/s00348-003-0704-z
[16] V. Narayanaswamy, L. L. Raja, N. T. Clemens, Characterization of a high-frequency pulsed-plasma jet actuator for supersonic flow control, AIAA Journal 48 (2) (2010) 297–305. doi:10.2514/1.41352. URL https://doi.org/10.2514/1.41352
[17] P. Audier, M. F´enot, N. B´enard, E. Moreau, Flow control of an elongated jet in cross-flow: Film cooling effectiveness enhancement using surface dielectric barrier discharge plasma actuator, Applied Physics Letters 108 (8) (2016) 084103. arXiv:https://doi.org/10.1063/1.4942606, doi:10.1063/1.4942606. URL https://doi.org/10.1063/1.4942606
[18] C.-C. Wang, S. Roy, Three-dimensional simulation of a microplasma pump, Journal of Physics D: Applied Physics 42 (18) (2009) 185206.
URL http://stacks.iop.org/0022-3727/42/i=18/a=185206
[19] M. Debiasi, J.-M. Li, Experimental study of a dbd-plasma driven channel flow, American Institute of Aeronautics and Astronautics.
URL https://doi.org/10.2514/6.2011-954
[20] M. Riherd, S. Roy, Measurements and simulations of a channel flow powered by plasma actuators, Journal of Applied Physics 112 (5) (2012) 053303.
URL https://doi.org/10.1063/1.4749250
Annual Review of Fluid Mechanics 42 (1) (2010) 505–529. arXiv:https://doi.org/10.1146/annurev-fluid-121108-145550, doi:10.1146/annurev-fluid-121108-145550.
URL https://doi.org/10.1146/annurev-fluid-121108-145550
[22] N. Benard, E. Moreau, Electrical and mechanical characteristics of surface ac dielectric barrier dis-charge plasma actuators applied to airflow control, Experiments in Fluids 55 (11) (2014) 1846. doi:10.1007/s00348-014-1846-x.
URL https://doi.org/10.1007/s00348-014-1846-x
[23] M. Raffel, C. E. Willert, F. Scarano, C. J. K¨ahler, S. T. Wereley, J. Kompenhans, Particle Image Velocimetry: A Practical Guide, 3rd Edition, Springer, 2018.
[24] J. M. Cabaleiro, J.-L. Aider, Axis-switching of a micro-jet, Physics of Fluids (1994-present) 26 (3) (2014) 031702.