HAL Id: insu-02315771
https://hal-insu.archives-ouvertes.fr/insu-02315771
Submitted on 3 Apr 2020
HAL is a multi-disciplinary open access
archive for the deposit and dissemination of
sci-entific research documents, whether they are
pub-lished or not. The documents may come from
teaching and research institutions in France or
abroad, or from public or private research centers.
L’archive ouverte pluridisciplinaire HAL, est
destinée au dépôt et à la diffusion de documents
scientifiques de niveau recherche, publiés ou non,
émanant des établissements d’enseignement et de
recherche français ou étrangers, des laboratoires
publics ou privés.
Synoptic-scale controls of fog and low-cloud variability
in the Namib Desert
Hendrik Andersen, Jan Cermak, Julia Fuchs, Peter Knippertz, Marco
Gaetani, Julian Quinting, Sebastian Sippel, Roland Vogt
To cite this version:
Hendrik Andersen, Jan Cermak, Julia Fuchs, Peter Knippertz, Marco Gaetani, et al.. Synoptic-scale
controls of fog and low-cloud variability in the Namib Desert. Atmospheric Chemistry and Physics,
European Geosciences Union, 2020, 20 (6), pp.3415-3438. �10.5194/acp-20-3415-2020�. �insu-02315771�
https://doi.org/10.5194/acp-20-3415-2020 © Author(s) 2020. This work is distributed under the Creative Commons Attribution 4.0 License.
Synoptic-scale controls of fog and low-cloud
variability in the Namib Desert
Hendrik Andersen1,2, Jan Cermak1,2, Julia Fuchs1,2, Peter Knippertz1, Marco Gaetani3,4, Julian Quinting1, Sebastian Sippel5,6, and Roland Vogt7
1Institute of Meteorology and Climate Research, Karlsruhe Institute of Technology (KIT), Karlsruhe, Germany 2Institute of Photogrammetry and Remote Sensing, Karlsruhe Institute of Technology (KIT), Karlsruhe, Germany 3IPSL LISA, CNRS, Université Paris-Est Créteil, Université Paris, Créteil, France
4IPSL LATMOS, CNRS, Sorbonne Université, Université Paris-Saclay, Paris, France 5Institute for Atmospheric and Climate Science, ETH Zurich, Zurich, Switzerland 6Norwegian Institute of Bioeconomy Research, Ås, Norway
7Department of Environmental Sciences, University of Basel, Basel, Switzerland
Correspondence: Hendrik Andersen ([email protected]) Received: 10 October 2019 – Discussion started: 14 October 2019
Revised: 18 February 2020 – Accepted: 20 February 2020 – Published: 24 March 2020
Abstract. Fog is a defining characteristic of the climate of the Namib Desert, and its water and nutrient input are im-portant for local ecosystems. In part due to sparse observa-tion data, the local mechanisms that lead to fog occurrence in the Namib are not yet fully understood, and to date, poten-tial synoptic-scale controls have not been investigated. In this study, a recently established 14-year data set of satellite ob-servations of fog and low clouds in the central Namib is ana-lyzed in conjunction with reanalysis data in order to identify synoptic-scale patterns associated with fog and low-cloud variability in the central Namib during two seasons with dif-ferent spatial fog occurrence patterns. It is found that dur-ing both seasons, mean sea level pressure and geopotential height at 500 hPa differ markedly between fog/low-cloud and clear days, with patterns indicating the presence of synoptic-scale disturbances on fog and low-cloud days. These regu-larly occurring disturbances increase the probability of fog and low-cloud occurrence in the central Namib in two main ways: (1) an anomalously dry free troposphere in the coastal region of the Namib leads to stronger longwave cooling of the marine boundary layer, increasing low-cloud cover, es-pecially over the ocean where the anomaly is strongest; (2) local wind systems are modulated, leading to an onshore anomaly of marine boundary-layer air masses. This is con-sistent with air mass back trajectories and a principal compo-nent analysis of spatial wind patterns that point to advected
marine boundary-layer air masses on fog and low-cloud days, whereas subsiding continental air masses dominate on clear days. Large-scale free-tropospheric moisture transport into southern Africa seems to be a key factor modulating the on-shore advection of marine boundary-layer air masses during April, May, and June, as the associated increase in green-house gas warming and thus surface heating are observed to contribute to a continental heat low anomaly. A statisti-cal model is trained to discriminate between fog/low-cloud and clear days based on information on large-scale dynam-ics. The model accurately predicts fog and low-cloud days, illustrating the importance of large-scale pressure modula-tion and advective processes. It can be concluded that re-gional fog in the Namib is predominantly of an advective nature and that fog and low-cloud cover is effectively main-tained by increased cloud-top radiative cooling. Seasonally different manifestations of synoptic-scale disturbances act to modify its day-to-day variability and the balance of mecha-nisms leading to its formation and maintenance. The results are the basis for a new conceptual model of the synoptic-scale mechanisms that control fog and low-cloud variability in the Namib Desert and will guide future studies of coastal fog regimes.
3416 H. Andersen et al.: Synoptic-scale controls of fog and low clouds in the Namib
1 Introduction
In moist climates, fog is typically viewed as an atmospheric phenomenon that disturbs traffic systems and negatively af-fects physical and psychological health (e.g., Bendix et al., 2011). In the hyperarid Namib Desert, however, the water input of fog is key to the survival of many species (e.g., Seely et al., 1977; Seely, 1979; Ebner et al., 2011; Roth-Nebelsick et al., 2012; Warren-Rhodes et al., 2013; Henschel et al., 2018; Gottlieb et al., 2019). Despite this ecological significance, the local mechanisms that control the formation and spatiotemporal patterns of regional fog in the Namib are not yet fully understood, and potential linkages to synoptic-scale variability have yet to be explored. With regional mate simulations suggesting a warmer and even dryer cli-mate (James and Washington, 2013; Maúre et al., 2018), fog could become an even more essential water source for re-gional ecosystems in the future. However, the lack of under-standing concerning fog and low-cloud (FLC) processes and their interactions with dynamics, thermodynamics, aerosols, and radiation in this region (Zuidema et al., 2016; Formenti et al., 2019) limits the accuracy of and confidence in pro-jected changes in fog patterns (e.g., Haensler et al., 2011).
Field observations of local meteorological parameters and fog have led to the distinction between two main fog types occurring in the region: advection fog and high fog. Advec-tion fog can form when a moist warm air mass is transported over a cool ocean (Gultepe et al., 2007) and has been reported to occur mainly during austral winter, affecting a coastal strip of < 30–40 km (Seely and Henschel, 1998). High fog is de-scribed as a low stratus that frequently reaches more than 60 km inland between September and March and leads to fog where the advected stratus base intercepts the terrain (Seely and Henschel, 1998). While the two fog types are reported to be transported inland with different wind sys-tems (for a review of local wind syssys-tems see Lindesay and Tyson, 1990), they are both described to be of an advective nature. In Olivier and Stockton (1989), a coastal low is de-scribed as the mechanism that, in case of a narrow coastal upwelling region, drives the onshore advection of foggy air masses into the region of Lüderitz in southern Namibia dur-ing austral summer, while durdur-ing winter they find fog to be associated with cold fronts. However, they assume that, while undetected, coastal lows were also present in these cases, as they typically precede the passage of a cold front (Olivier and Stockton, 1989; Reason and Jury, 1990). Recent analy-ses of diurnal FLC characteristics have shown that the timing of FLC occurrence depends on the distance to the coastline, with FLCs occurring significantly earlier at the coast than further inland, which is an indication of the dominance of advective processes (Andersen and Cermak, 2018; Ander-sen et al., 2019). Also, measurements of fog microphysics during the AEROCLO-sA field campaign in the Namib sug-gest that the observed fog events were advected cloudy air masses from the ocean (Formenti et al., 2019). While it has
long been acknowledged that other fog types (e.g., radia-tion fog and frontal fog) can occur in the Namib as well (e.g., Jackson, 1941; Nagel, 1959), many statements regard-ing fog formation mechanisms in the historical literature do not seem to be founded on extensive and coherent observa-tional evidence. Until recently, the occurrence of radiation fog, i.e., fog formation near the surface due to local radia-tive cooling under clear-sky conditions and without advec-tive influence (Gultepe et al., 2007), was seen as a compa-rably rare situation (e.g., Seely and Henschel, 1998; Eckardt et al., 2013). This was questioned when, based on analyses of stable isotopes of fog water samples, Kaseke et al. (2017, 2018) found that the majority of their collected fog water samples stemmed from sweet water sources and interpreted this as evidence of predominant occurrence of radiation fog. Based on these findings, they postulated a potential shift from advection-dominated fog to radiation-dominated fog in the Namib Desert (Kaseke et al., 2017). Thus, the importance of the various fog formation mechanisms is currently a subject of scientific debate.
The goals of this study are to better understand the synoptic-scale conditions under which regional FLCs in the Namib occur, to understand how synoptic-scale variability changes local conditions, and thereby to assess the relevance of different potential fog formation mechanisms. To these ends, a 14-year time series of geostationary satellite observa-tions of FLCs in the central Namib is combined with reanaly-sis data and air-mass back trajectories to systematically ana-lyze the large-scale dynamic conditions and air-mass char-acteristics that are associated with FLC occurrence in the Namib. The guiding hypothesis for this study is given in the paragraph below.
Fog and low clouds in the central Namib are primarily of an advective nature and therefore associated with distinct synoptic-scale patterns of atmospheric dynamics and air-mass history. Thus, they can be statistically predicted with information on atmospheric circulation.
2 Data and methods
2.1 Satellite observations of FLCs
The Spinning Enhanced Visible and Infrared Imager (SE-VIRI) sensor, mounted on the geostationary Meteosat Sec-ond Generation (MSG) satellites, is ideally suited to provide spatiotemporally coherent observations of clouds. It features a spatial resolution of 3 km at nadir and scans its full disk every 15 min (96 hemispheric scans per day; Schmetz et al., 2002). In the context of this study, 14 years (2004–2017) of SEVIRI data are used to continuously detect FLCs with the algorithm developed by Andersen and Cermak (2018). The algorithm relies mostly on a channel difference in the thermal infrared (12.0–8.7 µm), and in an extensive validation against surface observations this technique has shown a good
perfor-mance (97 % overall correctness of the classification). The 14-year FLC data set used here has already been applied to study spatial and temporal patterns of FLC occurrence along the southwestern African coast in Andersen et al. (2019). It should be noted that this satellite technique does not discrim-inate between fog and other low clouds.
The focus of this study is on FLCs in the central Namib, from which the majority of historical and present-day station measurements stem (e.g., Nagel, 1959; Nieman et al., 1978; Lancaster et al., 1984; Seely and Henschel, 1998; Kaseke et al., 2017; Spirig et al., 2019). To provide a representative measure of the overall FLC cover in the central Namib on a daily basis, FLC occurrence is averaged between 03:00 and 09:00 UTC (local time is UTC +2 h) in the region between 22 and 24◦S and up to 100 km inland. Only pixels with at least a 5 % FLC occurrence frequency in the climatology (as in Andersen et al., 2019) are used. A specified averaging time period is needed to avoid statistically mixing two separate FLC events occurring on successive nights, which would be the case in a daily average FLC occurrence data set. The spe-cific time period is chosen to include all periods of the diur-nal cycle, with FLC occurrence rising, peaking, and starting to dissipate (Andersen and Cermak, 2018) during this time. The spatial and temporal averaging is illustrated for an ex-emplary day in Fig. 1a. While the specific day shown here is arbitrary, the general feature of maximum FLC cover in the early morning hours and rapid decline shortly after sunrise is typical of the region (Andersen and Cermak, 2018). For further analyses, the data set is divided into “FLC days” with mean regional FLC cover exceeding 50 % between 03:00 and 09:00 UTC and “clear days” with mean FLC cover below 3 %. These thresholds are chosen to represent two clearly separated parts of the FLC cover distribution that occur with similar frequencies. The resulting distribution of daily aver-age FLC cover and the number of cases in each class are shown in Fig. 1b. As the time of sunrise varies by season, the constructed data set is likely to feature a seasonal bias in FLC occurrence. It should be noted that this has no effect on the separation of FLC days and clear days within seasons, the analysis of which is the main purpose of this data set. The resulting monthly average FLC cover in the central Namib (Fig. 1c) should not be used in a quantitative sense but rather to illustrate the general seasonal cycle of FLCs in this re-gion. It is interesting to note that the seasonal cycle of FLCs is not necessarily coupled to the seasonal cycle of fog occur-rence due to the seasonal cycle in the vertical position of the low-cloud layer. For example, at coastal locations fog peaks in the central Namib between April and August (Andersen et al., 2019), while marine fog over the adjacent Atlantic has been found to peak between March and May, with a mini-mum occurrence between June and August (Dorman et al., 2020).
2.2 ERA5 reanalysis
To investigate the large-scale meteorological conditions as-sociated with FLCs in the central Namib, ERA5 reanalysis data from the European Centre for Medium-Range Weather Forecasts (ECMWF) are used. ERA5 is the new genera-tion of reanalysis and follow-up of ERA-Interim (Dee et al., 2011). In comparison to ERA-Interim, it features higher spa-tial (0.25◦) and temporal (hourly) resolutions, along with other improvements (Hersbach, 2016).
In the context of this study, 14 years (2004–2017) of me-teorological fields are analyzed. To characterize large-scale dynamic and thermodynamic conditions, fields of mean sea level pressure (MSLP), geopotential height at 500, 700, 850, and 925 hPa (Z500, Z700, Z850, and Z925), 2 m air tem-perature (T2m), sea surface temtem-perature (SST), total colum-nar water vapor (TCWV), specific humidity (Q), as well as winds at 10 m and at all ERA5 pressure levels between 1000 and 500 hPa, and lower tropospheric stability (LTS; computed as the difference between potential temperature at 700 hPa and T2m, Klein and Hartmann, 1993) are used. To represent the morning conditions for which FLC is av-eraged, 06:00 UTC fields of ERA5 data are selected. While, for additional analysis, T2m fields are also used at nighttime (01:00 and 03:00 UTC), the 06:00 UTC fields are used if no specific information on time is given.
2.3 Trajectory analysis
The 24 h backward trajectories are calculated using the La-grangian analysis tool (LAGRANTO; Sprenger and Wernli, 2015). The three wind components needed for the trajectory calculations are taken from ERA5 on a regular 0.5◦latitude–
longitude grid, at 137 model levels in the vertical, and at a 3-hourly temporal resolution. The spatial resolution is used to reduce the data volume and computational cost. While the native resolution would be preferable, the general patterns of the trajectories are not expected to be affected, as tests with lower-resolution ERA-Interim data showed comparable re-sults. The trajectories are started daily at 06:00 UTC for the periods April, May, June, September, October, and Novem-ber 2004–2017. Their starting points are located in the central Namib, close to Gobabeb at 23◦S, 15◦E, 25 hPa above the surface (at ≈ 940 hPa), which corresponds roughly to 200 m above ground level. By doing so, the back trajectories rep-resent air masses for the levels where fog and low clouds in the region are typically observed (Andersen et al., 2019). In order to obtain insights about the physical properties of the air masses, the temperature, potential temperature, specific humidity, and relative humidity are tracked along the trajec-tories. The location is chosen, as it is the main site of both historic and present-day scientific activity in the region (Lan-caster et al., 1984; Seely and Henschel, 1998; Kaseke et al., 2017; Spirig et al., 2019).
3418 H. Andersen et al.: Synoptic-scale controls of fog and low clouds in the Namib
Figure 1. (a) Illustration of the spatiotemporal averaging for one exemplary day (9 September 2015) to create the FLC cover data set. The curve in (a) shows the regionally averaged (marked central Namib region) FLC occurrence, which is then averaged between 03:00 and 09:00 UTC (grey area). The resulting average daily morning FLC cover is given in percent. (b) Distribution of the resulting FLC cover in the central Namib for the complete observation period (2004–2017). Observations are separated in two classes: clear days (< 3 % mean FLC cover) and FLC days (mean FLC cover > 50 %). Days with mean FLC cover between 3 % and 50 % are not considered in analyses based on this classification (2418 cases for 404 d of FLC cover could not be computed due to missing data or complete coverage with higher-level clouds). Panel (c) shows monthly averages of the spatiotemporally averaged FLC cover data set.
2.4 Principal component analysis
The atmospheric variability in the South Atlantic Ocean and southern African region is characterized by means of a principal component analysis (PCA; see Storch and Zwiers, 1999). PCA solves the eigenvalues of the data covariance ma-trix and projects data variability onto an orthogonal basis, i.e., decomposes data variability into independent variability modes. Each mode explains a fraction of the total variance and is represented by a spatial anomaly pattern and a stan-dardized time series (namely, the principal components, PCs) accounting for the amplitude of the anomaly pattern. Here, the PCA is used to analyze daily fields of the zonal and meridional components of 10 m wind at 06:00 UTC in a do-main centered on the Namib (0◦–40◦E, 40◦S–0◦N). In the context of this study, the main modes of the wind variabil-ity are used to understand possible linkages between atmo-spheric circulation at the synoptic scale and the daily occur-rence of FLCs in the Namib region. The wind fields are first remapped onto a 1◦regular grid (PCAs are computationally expensive; Pham-Thanh et al., 2019). Then daily 06:00 UTC anomalies are computed by subtracting the 14-year clima-tological average wind components at each grid point. The PCA is applied to the covariance matrix of both components in the domain. Remapping to 1◦resolution allows not only an accurate description of the atmospheric variability at syn-optic scale but also a smoothing out of the variability asso-ciated with small-scale effects. The sensitivity of the PCA to the spatial resolution is tested by conducting the analysis based on wind fields remapped to a 2◦ resolution. The
re-sults of the two PCAs at the different resolutions are very similar, demonstrating their robustness. Daily anomalies are computed with respect to the 14-year sampling of the FLC data set, in order to compare wind and FLC variability over a homogeneous climatology.
2.5 Statistical prediction of FLCs
Statistical modeling of fog or low clouds is typically done by using local fields of a set of predictors, i.e., relevant meteo-rological fields and aerosol properties (e.g., Andersen et al., 2017; Adebiyi and Zuidema, 2018; Fuchs et al., 2018). The circulation-induced variability can be captured by spatial pat-terns of pressure fields (Deloncle et al., 2007; Yu and Kim, 2010; Sippel et al., 2019). A major challenge when using pressure fields (denoted X, as an n × p matrix of n sam-ples and p predictors located on a grid) to predict a target variable is, however, that the number of (strongly correlated) predictors can quickly outgrow the number of observations. This typically leads to high-variance problems (overfitting) in classical statistical models. The issue can be overcome with shrinkage methods, as, e.g., regularized linear models (Hastie et al., 2001). These provide an extension of linear regression techniques that shrink the regression coefficients of a model by penalizing their size, thereby addressing the aforementioned high-variance issues (Hastie et al., 2001). Ridge regression is a specific example of a regularized lin-ear model where the shrinkage is controlled by a value λ that shrinks the coefficients of the model towards zero using the L2 penalty (the squared magnitude of the coefficient value is
added as a penalty term to the loss function). This method is well suited for cases with a large number of correlated predictors that are all relevant (coefficients > 0) (Friedman et al., 2010). The method can be used for classification and regression (Friedman, 2012).
Here, the statistical learning method is used in a classifi-cation setting. That is, a binary response variable (FLC day or clear day) is modeled using logistic regression regularized with the ridge penalty. In logistic regression with a binary re-sponse variable, the “odds ratio”, logP r(FLC day|X=x)P r(clear day|X=x), is esti-mated as a linear function of the predictors for any given day as follows:
logP r(FLC day|X = x)
P r(clear day|X = x)=β0+β
Tx, (1)
with β0the intercept and βT the model coefficients. From the
odds ratio, the estimated probabilities and the correspond-ing class (FLC day or clear day) are determined for each sample. The ridge regression penalty based on the L2 norm, i.e., R(λ) = λPp
i=1β 2
i, is then incorporated as a constraint on
the size of the regression coefficients in the objective function that is minimized to fit the model. The tuning parameter λ directly trades off between a more flexible regression model (small penalty, i.e., low λ value) that, however, possibly suf-fers from high-variance issues and a less flexible regression model. Accordingly, a larger value of λ enforces smaller (but nonzero) regression coefficients, and a smoother spatial map of regression coefficients is obtained as a result. The opti-mal λ value is derived through 10-fold cross-validation. For a more complete description of regularized (logistic) regres-sion, the reader is referred to Hastie et al. (2001) and the Elas-ticNet vignette for a hands-on tutorial (https://web.stanford. edu/~hastie/glmnet/glmnet_alpha.html, last access: 5 Octo-ber 2019). Model estimation and cross-validation was per-formed using the scikit-learn package in Python (Pedregosa et al., 2011).
The ridge regression method is used to predict FLC and clear days over the complete 14-year time series, using spa-tial patterns of 06:00 UTC (representative of averaging time of FLC cover; see Sect. 2.1) ERA5 MSLP fields in a large spatial domain centered on the central Namib (0–45◦S, 8◦W–38◦E; shown in Fig. 2). The ERA5 pressure fields fea-ture a spatial resolution of 0.25◦×0.25◦and as such lead to 33 485 predictor fields.
3 Results and discussion
3.1 Dynamic and thermodynamic conditions
Figure 2 shows a climatology of the dynamic and thermody-namic characteristics of the southeastern Atlantic and south-ern African region based on 14 years (2004–2017) of ERA5 data. Two seasons are shown in the figure that are repre-sentative of two different fog regimes (described in the next
paragraph; Seely and Henschel, 1998; Andersen et al., 2019): September, October, and November (SON) in Fig. 2a and c and April, May, and June (AMJ) in Fig. 2b and d. At this spa-tial scale, the South Atlantic High and the continental high control the characteristic near-surface flow patterns during both seasons. During SON, the South Atlantic High is more prominent and, in combination with the thermal contrast be-tween land and ocean, results in the formation of a low-level jet during this time (Nicholson, 2010). This alongshore coastal jet intensifies the upwelling of cold water, which feeds back to amplify the jet by increasing the thermal land– ocean contrast (Nicholson, 2010). On a local scale, the near-coastal winds that drive the upwelling are additionally modu-lated by the coastal topography (Koraˇcin et al., 2004). While more prominent during SON, when the more pronounced South Atlantic High produces stronger winds, coastal up-welling water of the Benguela Current is apparent in the relatively low SSTs along the southwestern African coast-line during both seasons (Fig. 2c and d) and throughout the year (Nelson and Hutchings, 1983). During AMJ, continental high-pressure situations are the most prominent circulation pattern (Tyson et al., 1996; Garstang et al., 1996). This is vis-ible in the more pronounced continental high-pressure sys-tem and leads to a marked amplification of the easterly flow over the southern African continent. In the Namib Desert, thermally and topographically induced local wind systems within the boundary layer modulate these synoptic air-flow patterns, and the significance of the induced diurnal oscilla-tions can exceed that of the synoptic scale (Goldreich and Tyson, 1988; Lindesay and Tyson, 1990). The combination of large-scale subsidence and low SSTs along the coastline produces high-LTS conditions in the coastal marine regions adjacent to the Namib, specifically during SON (LTS con-tours in Fig. 2c and d). In the adjacent marine regions down-wind of the central Namibian coast, these stable conditions promote the formation of the southeastern Atlantic stratocu-mulus cloud deck and controls its seasonal cycle (Klein and Hartmann, 1993; Andersen et al., 2017), where the SST com-ponent is responsible for most of the LTS seasonality. One should note that MSLP and LTS are both affected by the high elevation of the central plateau in southern Africa (see Fig. 6) and are not likely to be a perfect representation of near-surface pressure conditions and lower-tropospheric stability in this region. However, due to the joint consideration of re-gions in southern Africa with high topography, the low-lying central Namib, and marine regions, no one specific pressure level of geopotential height can adequately summarize near-surface conditions throughout this large domain. Additional analyses show that patterns obtained from MSLP fields in southern Africa are similar to those at 925 and 850 hPa (not shown).
As outlined in the introduction, distinct seasonal fog and FLC patterns have been identified in the central Namib (Lan-caster et al., 1984; Seely and Henschel, 1998; Cermak, 2012; Andersen et al., 2019). During SON, described as “high FLC
3420 H. Andersen et al.: Synoptic-scale controls of fog and low clouds in the Namib
Figure 2. Climatological setting of the region in two seasons (2004–2017): (a, c) September, October, and November and (b, d) April, May, and June. (a, b) MSLP in color and contours with 10 m winds indicated by arrows where the length scales with strength (the u and v vectors of near-surface winds are bilinearly interpolated to a 2.5◦×2.5◦grid for clarity). Z500 is illustrated with white contours. (c, d) SST in color and LTS (in kelvin) as contours. Data are sampled at 06:00 UTC.
season” in Andersen et al. (2019), FLCs frequently occur in the central Namib as a low stratus or high fog (cloud base height on average ≈ 400 m a.s.l. – above sea level) that touches the ground inland, whereas during the “low FLC sea-son” in AMJ, FLCs occur less frequently, do not extend as far inland, and are typically lower, at ≈ 200 m a.s.l., and thus register as fog (termed “advection fog” in Seely and Hen-schel, 1998) at locations closer to the coastline (Andersen et al., 2019). While the FLC occurrence in the central Namib peaks in austral summer and is lowest during winter, fog peaks at coastal locations in AMJ and at inland locations dur-ing SON (Seely and Henschel, 1998; Andersen et al., 2019) due to the seasonal cycle in the vertical position of the cloud layer (Andersen et al., 2019). For these reasons, this study focuses on mechanisms determining FLC variability within these two characteristic fog seasons.
It has been assumed that the occurrence of FLCs in the Namib region and their variability on diurnal to seasonal
scales is driven by the position and strength of large-scale pressure systems, as this would affect occurrence and ad-vection of low-level clouds, atmospheric stability, and SSTs (Lancaster et al., 1984; Cermak, 2012; Andersen and Cer-mak, 2018; Andersen et al., 2019). Coastal upwelling, which has been shown to determine marine sea fog patterns along the Namibian coastline (Dorman et al., 2020), in combina-tion with the presence of a coastal low that drives the on-shore advection of foggy air masses has been found to be a major driver of fog occurrence in southern Namibia dur-ing austral summer (Olivier and Stockton, 1989). One should note though that the relationship between SSTs and fog in the Namib region is complex; Olivier and Stockton (1989) point out that too large an upwelling extent can also lead to less fog in southern Namibia. Based on these insights and also on knowledge from related coastal upwelling systems (Cereceda et al., 2008; Johnstone and Dawson, 2010; Del Río et al., 2018; Dorman et al., 2020), it is clear that the Atlantic
anti-cyclone, the SSTs, and the large-scale subsidence are main drivers of this coastal FLC system. While all of these links play a role in FLCs in the Namib, the influence of synoptic-scale variability has not been explored, and a more in-depth analysis is needed to estimate the importance of the differ-ent mechanisms for the day-to-day variability in FLCs in the Namib region.
3.2 Differences in meteorological conditions on FLC days and clear days
Figure 3 shows large-scale patterns of averaged monthly mean differences in (a) MSLP and 10 m winds, (b) Z500 and winds at the same pressure level, (c) T2m, (d) LTS, (e) SST, and (f) TCWV on FLC versus clear days (as defined in Sect. 2.1) in the central Namib (marked with a star) dur-ing the investigated 14-year period (all months are consid-ered here). The average of monthly mean differences is cho-sen rather than the overall mean differences to account for the distinct seasonal cycle of FLC occurrence in the Namib (Fig. 1c). In each pixel, an independent two-sided t test is computed to identify significant differences between the two classes (contours show p values < 0.01). It is apparent that the dynamical conditions (Fig. 3a and b) on FLC days dif-fer significantly on the synoptic scale. On FLC days, MSLP over continental southern Africa is systematically lower by about 3–5 hPa. This anomaly of lower MSLP extends over the southeastern Atlantic ocean at about 30◦S. In a smaller oceanic region along the coastline north of 23◦S, MSLP is significantly higher, leading to an overall anomalously high land–sea pressure gradient in this region and an onshore flow anomaly of near-surface winds in the central Namib on FLC days. The land–sea contrast in MSLP indicates a heat low over land, where the heat anomaly (Fig. 3c) could be driven by northerly advection ahead of the trough or enhanced sur-face warming. As discussed in Sect. 3.1, MSLP and 10 m winds may not be a good representation of near-surface level characteristics where topography is high; however, ad-ditional analyses of geopotential height at 850 and 925 hPa corroborate observed MSLP patterns. Differences exist in winds north of the central Namib, where at 925 and 850 hPa (not shown), a stronger onshore flow anomaly is observed than at 10 m, possibly indicating a topographical blocking of the onshore flow below the inversion. Z500 on FLC days (Fig. 3b) is significantly lower over the southeastern Atlantic between 30 and 40◦S. This pattern is an indication of upper-level waves disturbing the mean tropospheric circulation of the southeastern Atlantic and southern Africa (Tyson et al., 1996; Fuchs et al., 2017). In combination, MSLP and Z500 show a weakly baroclinic structure with the mid-level trough shifted to the west (see Fig. A1). While a coastal low, which has been described in Olivier and Stockton (1989) as a local feature that can determine onshore flow, may still be present on FLC days, the composite differences between FLC days and clear days do not provide a clear indication of an increase
in its presence on FLC days on average. However, as Reason and Jury (1990) describe, the coastal low is frequently fol-lowed by a frontal passage, which is a synoptic-scale signal observed here (Fig. A1).
There is a coherent pattern of slightly lower SSTs (≈ 0.5 K; Fig. 3e) along the coastline on FLC days; however, the difference between SSTs on FLC and clear days is not signif-icant at the 0.01 level (and also not at the 0.05 level). It is in-teresting to note that SSTs tend to be lower on FLC days, al-though the coast-parallel, near-surface wind that partly gov-erns the upwelling is slightly weaker in these cases (Fig. 3a), potentially hinting at a time-lag response of SSTs. This is to be expected, as Ekman transport produces a steady-state sit-uation only after a few pendulum days (Pond and Pickard, 2013), although an initial upwelling response can be ex-pected earlier (Lentz, 1992). It appears likely that effects of SST patterns on FLC variability are most pronounced on longer timescales (i.e., seasonal to interannual) that feature higher SST variability (Hutchings et al., 2009; Goubanova et al., 2013; Tim et al., 2015), as also observed in the Chilean Atacama Desert (Del Río et al., 2018). Differences in TCWV on FLC and clear days are pronounced (Fig. 3f). A coherent region of a significantly dryer column stretches from the cen-tral Namib over the coastal Atlantic, where the anomaly is strongest. This is likely the dry slot (Browning, 1997) or dry air intrusion of the synoptic-scale disturbance, which leads to increased longwave cooling at cloud top in case of FLC pres-ence and has been shown to be a main determinant of cooling within the marine boundary layer (Koraˇcin et al., 2005). This enhanced cooling can increase FLC cover, which has been observed to be a significant mechanism for stratocumulus clouds over the southeastern Atlantic (Adebiyi et al., 2015; Adebiyi and Zuidema, 2018). A substantial moist anomaly is visible over the southern African continent, likely driven by large-scale free-tropospheric moisture transport from the northwest (Fig. 3b). These moist air masses may contribute to the observed T2m heat anomaly via greenhouse warming (Fig. 3c). This effect of free-tropospheric moisture on surface temperatures has been observed in the Kalahari Desert (Man-atsa and Reason, 2017) and other arid or semi-arid regions before (Evan et al., 2015; Oueslati et al., 2017; Alamirew et al., 2018). Along the coastal strip that is typically over-cast with FLCs (Olivier, 1995; Cermak, 2012; Andersen and Cermak, 2018; Andersen et al., 2019), T2m is significantly lower by about 4 K, which is likely a feedback of FLCs re-flecting solar radiation and slowing down the surface heating in the early morning (Iacobellis and Cayan, 2013) or due to air-mass differences. The observed difference patterns in LTS (Fig. 3d) between FLC and clear days match those of T2m so that they can be assumed to be mostly driven by its surface component (Pearson correlation coefficient is −0.90 for land pixels).
The observed anomaly patterns indicate that different mechanisms are triggered by the observed synoptic-scale
dis-3422 H. Andersen et al.: Synoptic-scale controls of fog and low clouds in the Namib
Figure 3. Averaged monthly mean differences (FLC days−clear days) in (a) MSLP and 10 m winds, (b) Z500 and 500 hPa winds (in geopotential meters, gpm), (c) T2m, (d) LTS, (e) SST, and (f) TCWV at 06:00 UTC. In each pixel, an independent two-sided t test is computed to identify significant differences between FLC and clear days for each month. Contours mark regions where the distributions differ significantly at the 0.01 level (median of the monthly p values < 0.01). U and v vectors of wind are interpolated as in Fig. 2.
turbances and may contribute to FLC occurrence in the cen-tral Namib in two main ways:
1. increased FLC cover due to increased longwave cooling under the dry anomaly close to the coast;
2. onshore flow anomaly of marine boundary-layer air masses due to (a) a modulation of coastal winds and (b) a formation of a southern African heat low due to
greenhouse warming by moist air masses and northerly warm air advection.
As both synoptic and FLC characteristics differ substantially between the SON and AMJ, the following section focuses on specific characteristics and differences in these mechanisms during these seasons.
Figure 4. Mean of monthly average differences (FLC days−clear days) during (a, c, e) SON and (b, d, f) AMJ of (a, b) MSLP, (c, d) Z500, and (e, f) SST for the time period 2004–2017. Contours mark significant differences as in Fig. 3. Wind anomalies at (a, b) 10 m and (c, d) 500 hPa are superimposed as vectors.
3.3 Seasonal differences in synoptic-scale mechanisms
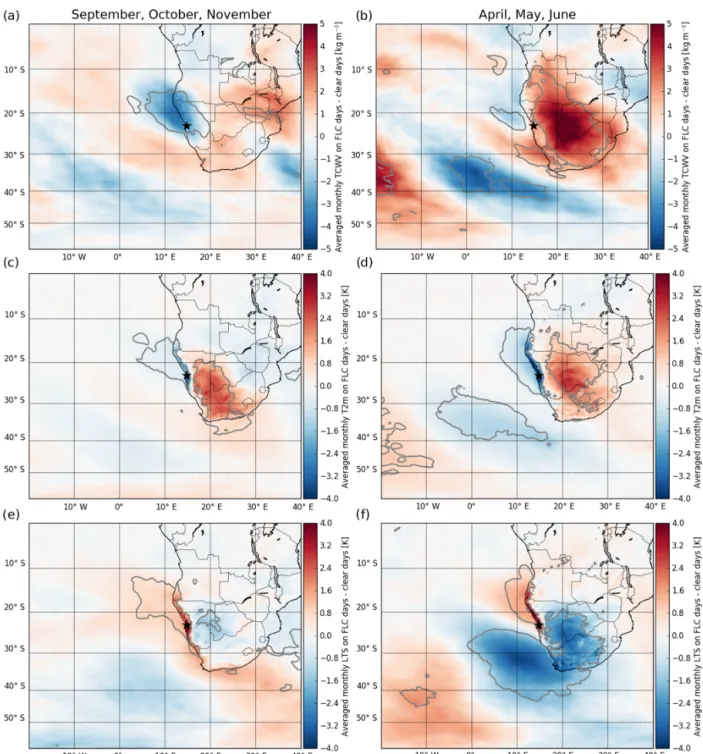
Figures 4 and 5 show seasonally averaged differences be-tween FLC and clear days of all analyzed parameters dur-ing the two seasons SON and AMJ. Durdur-ing both seasons, MSLP (Fig. 4a and b) and Z500 (Fig. 4c and d) indicate
synoptic-scale disturbances on FLC days. However, seasonal differences exist, as the disturbance is more pronounced dur-ing AMJ. The negative continental MSLP anomalies on FLC days are larger during AMJ, likely amplified by the more pro-nounced T2m anomalies and subsequent effects on a con-tinental heat low during this time (see Fig. 5c and d). As
3424 H. Andersen et al.: Synoptic-scale controls of fog and low clouds in the Namib
Figure 5. Mean of monthly average differences (FLC days−clear days) during (a, c, e) SON and (b, d, f) AMJ of (a, b) TCWV, (c, d) T2m, and (e, f) LTS for the time period 2004–2017. Contours mark significant differences as in Fig. 3.
noted above, the continental heat anomaly can be caused by northerly warm air advection or enhanced warming due to changes in the radiative balance. The observed seasonal MSLP and 10 m wind anomalies (Fig. 4a and b) that re-sult in a transport of warm air from the northeast into the anomaly region (see Fig. A2), as well as the TCWV anoma-lies (Fig. 5a and b), suggest that during SON, the heat anomaly on FLC days is mostly due to northerly advection of warm air, whereas during AMJ, TCWV is significantly
in-creased over the southern African continent. Here, the T2m anomalies closely follow those of TCWV (Pearson correla-tion coefficient of 0.75 in continental regions, with signifi-cantly higher T2m on FLC days than clear days), suggest-ing that the increased moisture causes an additional surface heating due to greenhouse warming as discussed in Sect. 3.2. It is likely that the TCWV anomaly is caused by a large-scale free-tropospheric moisture transport from the tropics, which is supported by the marked wind anomalies at 500 hPa
(Fig. 4d) that show a northwesterly anomaly and the abso-lute wind and moisture fields at 700 hPa during this time (Fig. A1). It should be noted that a Lagrangian transport of moisture at this scale takes time and as such is likely to occur when the disturbance is relatively stationary or if two consec-utive systems pass within a short timeframe (Knippertz and Martin, 2005).
While the yearly averaged composites show that over land, LTS is driven to a large extent by T2m (Fig. 3c and d), this is not quite as pronounced during SON (correlation coef-ficient = −0.57; Fig. 5c and e). Over continental southern Africa, the differences in T2m (Fig. 5c) are frequently com-pensated for by similar differences in potential temperature at 700 hPa (not shown). The most pronounced LTS feature during both seasons, however, is the coastal anomaly of in-creased LTS (over land and weaker over the adjacent ocean), which is driven by T2m. As this anomaly is also apparent during nighttime (01:00 and 03:00 UTC, not shown), it is likely that this pattern is mainly due to the relatively warm subsiding continental outflow that is apparent on clear days, rather than a radiative effect of FLCs as found in California (Iacobellis and Cayan, 2013). During AMJ, LTS is signifi-cantly lower over a large marine region south of 25◦S, which is likely caused by the synoptic-scale disturbance.
During both seasons, SSTs in the coastal upwelling region are slightly lower on FLC days than on clear days, although these differences are not significant at the 0.01 level for the most part (very localized regions at ≈ 28◦S are significantly lower during AMJ). In isolated patches further south, upwind of the study area, SSTs tend to be significantly higher on FLC days. This could lead to increased surface latent heat fluxes, increasing the moisture content of the marine boundary layer, particularly during AMJ when stronger near-surface winds are also apparent. A few 100 km to the west and south of the Namibian coastline, SSTs could similarly add to the in-creased moisture within the marine boundary layer. It is not clear yet, however, what exactly drives the observed anomaly patterns of SSTs. As upwelling reacts to the time-integrated wind field forcing over longer timescales than analyzed here (Pond and Pickard, 2013), the SST response to the instanta-neous winds that are considered here is expected to be rel-atively weak. However, in the case of a relrel-atively station-ary disturbance as discussed above, the upwelling patterns could indeed reflect an SST response to a synoptic forc-ing. While the seasonally varying TCWV and SST anoma-lies (Figs. 4e, f and 5a, b, respectively) illustrate the seasonal variability in the mechanisms that can contribute to FLC oc-currence in the central Namib, during all months, the outlined systematic patterns of significant negative MSLP anomalies over continental southern Africa and the localized coastal high-pressure anomaly are apparent. It can be concluded that a low-pressure anomaly in continental southern Africa and the associated onshore advection of marine boundary-layer air masses facilitate FLC occurrence in the central Namib during the entire year.
To better understand the characteristics of the observed moisture transport and its relevance for FLC occurrence in the central Namib, information on the vertical patterns of moisture and wind anomalies is needed. Figure 6 shows av-erage seasonal differences in Q and winds on FLC versus clear days at different pressure levels during (a) SON and (b) AMJ (averaged between 20 and 25◦S). During both sea-sons, a complex vertical structure of Q anomalies is ap-parent, which is assumed to be disturbance-induced. Dur-ing both seasons, the marine boundary layer features an on-shore flow anomaly and is more humid on FLC than on clear days, especially during AMJ, when this is a synoptic-scale feature, likely related to the cold front of the disturbance. These differences are caused by the subsiding dry continental easterly air masses that dominate on clear days, whereas on FLC days, a slight onshore flow of the more humid marine boundary-layer air is observed in the central Namib. Over land, these marine air masses flow against the dominant con-tinental easterly winds (Lindesay and Tyson, 1990), produc-ing a northerly wind flow at ≈ 15◦N (not shown) that has been found to be associated with fog occurrence in the cen-tral Namib (Seely and Henschel, 1998; Spirig et al., 2019). Above the moist marine boundary layer, the free troposphere is relatively dry on FLC days during both seasons, a feature which is not as clearly visible in the columnar TCWV com-posites during AMJ, as it is masked by the moist anomaly in the marine boundary layer (Fig. 5a). It is interesting to note that the marine dry anomaly peaks between Decem-ber and February (not shown), the season with maximum FLC cover in the central Namib, with TCWV anomalies exceeding 10 kg m−2. The seasonal difference in the free-tropospheric Q anomalies over the continent is clear, and the vertical distribution of Q anomalies during AMJ cor-roborates the assumption that the observed positive TCWV anomalies are due to free-tropospheric moisture transport (Fig. 5b). Expressed in relative terms, Q is approximately halved within the dry anomaly region on FLC days during both seasons, suggesting that radiative cooling is an impor-tant factor for FLC cover, especially over marine regions where the dry anomaly is most pronounced. During AMJ, the free-tropospheric relative moisture difference between FLC days and clear days is observed to be as high as 220 %. This substantial increase in free-tropospheric moisture in this oth-erwise dry central plateau region induces a substantial sur-face heating, contributing to the formation of the observed heat low, which modulates regional wind systems and leads to the onshore flow anomaly.
It should be noted that in a comparable upwelling system (coastal California), Clemesha et al. (2017) also find a pos-itive relationship between T2m over land and coastal low-level cloudiness, with the T2m anomaly shifted poleward by about 5◦latitude from the cloud field. They propose that the T2m–cloud relationship is due to spatially offset associations between coastal low-level cloudiness and stability (poten-tial temperature at 700 hPa), which is strongly correlated to
3426 H. Andersen et al.: Synoptic-scale controls of fog and low clouds in the Namib
Figure 6. Seasonal average difference (FLC days−clear days) in specific humidity and u and w wind components at different pressure levels during (a) SON and (b) AMJ for the time period 2004–2017. Specific humidity and wind vectors are averaged between 20 and 25◦S and shown at pressure levels between 1000 hPa and 500 hPa. For illustration purposes, the w vector is enhanced by a factor of 20. The masked grey area approximates the average surface elevation between 20 and 25◦S.
T2m over land, thereby resulting in the T2m anomaly, rather than T2m driving the onshore advection. While in the central Namib the anomaly patterns between potential temperature at 700 hPa and T2m are similar in that they are also positively correlated during SON (and therefore compensate each other in terms of LTS; Fig. 5c and e), they are uncorrelated dur-ing AMJ (and also in the annual averages), when T2m over land is strongly correlated to TCWV. Also, during all times of year, the T2m and MSLP anomalies are directly inland from the cloud field, suggesting an influence on onshore ad-vection.
3.4 The role of air-mass history and dynamical regimes Air-mass back trajectories, initiated in the central Namib, close to Gobabeb at 23◦S, 15◦E (indicated by the star in Fig. 7), 06:00 UTC, and 25 hPa above ground level (approx-imates 200 m above ground level), are computed for the 14-year observational period. Figure 7 shows the back trajec-tories for FLC days (a, b) and clear days (c, d) for the two seasons SON (a, c) and AMJ (b, d). During both seasons, air masses on FLC days nearly exclusively stem from the marine boundary layer and have traversed over the cool up-welling ocean water along the coastline for the time span of 24 h. This is in agreement with findings from Koraˇcin et al. (2005), which noted that a marine origin of air masses is crit-ical, and potential mixing with continental air masses along the trajectory that would lead to a warming and drying. While the number of FLC days during SON is higher than during AMJ, following the general seasonality of FLCs in the re-gion (see Fig. 1c), no clear seasonal differences in air-mass dynamics can be observed in such situations. This suggests that during both seasons, similar local dynamic conditions drive FLCs or air masses that develop into FLCs inland into
the Namib Desert but that due to seasonal differences in large-scale dynamics, these situations occur with varying fre-quency during different seasons.
On clear days, air-mass histories are more diverse and show distinct seasonal differences but are frequently char-acterized by subsiding continental air masses. While on clear days during SON a considerable fraction of the air masses is still transported from the marine boundary layer, during AMJ, subsiding northeasterly continental air masses domi-nate. This seasonal shift in air-mass dynamics is likely driven by the seasonality of the two dominating high-pressure sys-tems of the region that is shown in Fig. 2. During AMJ, the continental high-pressure system is enhanced and leads to the stronger easterly flow. These observations support the hy-pothesis by Lancaster et al. (1984) that the seasonality of fog in the central Namib is to some extent controlled by the southern African high-pressure system, as the associ-ated easterly winds are likely to inhibit large-scale onshore advection of cloudy marine boundary-layer air masses. The results also suggest that aerosols from the biomass burning season in continental southern Africa (Swap et al., 2003) are unlikely to play a large role for fog formation by acting as cloud condensation nuclei, as biomass burning aerosols within the boundary layer are mostly associated with conti-nental air masses in this region (Formenti et al., 2018). How-ever, biomass burning aerosols may influence FLCs in the Namib region by absorbing solar radiation and modifying the thermodynamic conditions, which has been modeled and ob-served to influence the Namibian stratocumulus deck (Zhou and Penner, 2017; Deaconu et al., 2019).
While systematic differences in air masses exist between FLC days and clear days, clear days may still feature air masses that are advected from the marine boundary layer (see Fig.7c). To understand the differences between the FLC
Figure 7. The 24 h LAGRANTO air-mass back trajectories for (a, b) FLC days and (c, d) clear days in (a, c) September, October, and November and (b, d) April, May, and June for 2004–2017. The star marks 23◦S and 15◦E, where the back trajectories were initialized at 25 hPa (approximates 200 m) above ground level. The number of samples are (a) 399, (b) 133, (c) 146, and (d) 452.
days and clear days in such situations, these are isolated and analyzed in the following. Figure 8 shows the average Q, rel-ative humidity (RH), air temperature (T ), potential tempera-ture (pot. T ), and pressure (P ) along all of the back trajecto-ries that are advected from the marine boundary layer (here, P >900 hPa over ocean). It is apparent that these air masses contain significantly more moisture and feature significantly lower pot. T on FLC days than on clear days, which explains most of the difference in RH. The back trajectories of FLC days feature a stronger cooling during the last 10 h of advec-tion (hours 0–10), resulting in an addiadvec-tional increase in RH. The deviation in T between FLC and clear days seems to be driven by the vertical movement of the air masses, rather than differences in radiative cooling, as no changes in pot. T are apparent. At 10 h before initialization, air masses on clear days are located ≈ 20 hPa higher than on FLC days, not cool-ing off as they are advected due to their simultaneous subsi-dence. Other potential factors that may drive the observed deviation in T , such as the free-tropospheric moisture con-tent and the surface temperature along the back trajectories, were not found to be systematically different on FLC and clear days (not shown). These findings highlight that FLCs Namib in the region are dependent on dynamics and also
that marine boundary-layer moisture content and tempera-ture changes during advection are important controls as well. It is likely that the computed air-mass back trajectories do not fully capture thermally and topographically induced local air-flow patterns (see Lindesay and Tyson, 1990, for a review) that contribute to local FLC occurrence patterns and possibly formation. However, the larger-scale patterns of air-mass history of marine boundary-layer air masses ver-sus the subsiding continental air masses from the free tropo-sphere are clearly evident from the analysis presented and of-fer a consistent physical explanation of the large-scale FLC occurrence patterns. The observations suggest that FLCs in the Namib region are either advected after forming over the cool adjacent ocean or condensation takes place during ad-vection of the marine boundary-layer air masses over land due to higher humidity levels, lower temperatures or radia-tive cooling, though a mix of these processes is likely.
The analysis of air-mass back trajectories shows that the discrimination between FLC and clear days is not possible using dynamics alone and that seasonal differences exist in the link between the probability of FLC days and advec-tion patterns. To further investigate the role of different dy-namical regimes for FLC occurrence, a PCA is conducted
3428 H. Andersen et al.: Synoptic-scale controls of fog and low clouds in the Namib
Figure 8. Hourly averaged (a) specific humidity, (b) relative humid-ity (RH), (c) air temperature (T ), (d) potential temperature (pot. T ), and (e) pressure (P ), along the 24 h air-mass back trajectories that are advected from the marine boundary layer on FLC days (solid line) and clear days (dashed line) during SON 2004–2017. The number of samples are 369 FLC days and 80 clear days. Grey shad-ing highlights nonsignificant differences.
on spatial patterns of synoptic-scale near-surface winds (see Sect. 2.4 for details on the method). Figure 9a shows corre-lations between daily FLC cover in the central Namib and the PCs associated with the first six modes of variability in near-surface winds during all months of the year. All PCs are significantly correlated to FLC cover during some months of the year. Clear correlation patterns are evident; PCs 1, 2, 4, and 5 show negative correlations with FLC cover, while PCs 3 and 6 feature positive correlations. These PCs that facili-tate FLC occurrence (3 and 6) show westerly or northwest-erly wind anomalies in the central Namib, while PCs that are negatively associated with FLC cover in the Namib region feature anomalously strong continental easterly winds, con-sistent with results presented in Sect. 3.2 and 3.3. Figure 9c and d show the spatial patterns of near-surface wind anoma-lies of PCs 3 (explained variance: 11 %) and 4 (explained variance: 6 %) as examples for PCs that promote and impede FLC occurrence, respectively. A seasonal dependence of the correlations on PCs and FLC cover is apparent and seems to be related to the seasonality of FLC cover (Fig. 9b); PCs associated with onshore circulation in the central Namib fea-ture the strongest positive correlations during winter when FLC cover is generally lowest over the Namib, especially evident for PC 3. This appears plausible, as during winter, the typical dynamical setting is less conducive to FLCs (see Fig. 2 for fall/early winter conditions during AMJ), and con-sequently, FLC occurrence is dependent on a stronger dy-namical disruption during this time. During summer, when FLCs frequently occur in the central Namib, dynamical con-ditions associated with PCs 4 and 5 (dominance of
continen-tal easterlies) seem to impede the occurrence of FLCs. The results underscore that the advection of marine air masses is crucial for the occurrence of FLCs in the central Namib. 3.5 Statistical fog and low-cloud prediction with
pressure fields
Based on the evidence presented above, showing that FLC occurrence is tightly connected to synoptic-scale patterns, it can be assumed that FLC occurrence can be predicted to some extent with a statistical learning technique that uti-lizes spatial patterns of dynamical information. Here, a ridge regression is applied to classify FLC days and clear days based on MSLP fields in a region spanning 45◦×45◦ that is centered on the central Namib (see Sect. 2.4). MSLP fields are used, as their anomaly patterns on FLC days are simi-lar during the different analyzed seasons and thus summarize the controlling mechanisms of onshore advection of marine boundary-layer air masses. Figure 10a shows the resulting coefficients, i.e., regression slopes, of the statistical model. The sign and spatial patterns of the coefficients are similar to the observed MSLP anomalies shown in Fig. 4, where coef-ficients (and anomalies) are negative in the inland region of Namibia and positive along the northern part of the Namib-ian coastline. It should be noted that the statistical model seems to mostly rely on regional MSLP fields, resulting in low coefficients at the synoptic scale, e.g., the Atlantic high-pressure system. It can be concluded that the synoptic-scale pressure patterns set the stage for more localized pressure and wind modulations that determine FLC occurrence and that regional MSLP fields contain information on both.
Figure 10b gives a summary of statistical measures of the skill of the model to classify between FLC and clear days in the central Namib. Using MSLP fields at 06:00 UTC on the day of the FLC cover information, the ridge regression model has a probability to correctly detect FLC days of 94 %, with 17 % of the reported FLC days being false alarms, leading to an overall correctness of the model of 86 % and a pos-itive bias of 14 %. The critical success index (CSI: 0.79) and the Heidke skill score (HSS: 0.72) combine these scores and show that the model is skillful in distinguishing between the defined fog and clear days. As MSLP fields in southern Africa may not be representative due to the high topogra-phy, the model was additionally run based on Z850 and Z925 fields. The model performances were nearly the same (over-all PC of 84 % in both cases), suggesting that it is adequate to use MSLP in this context. The colored dots in Fig. 10b illustrate the progression of the model skill when the train-ing is carried out based on MSLP fields of 1, 2, 3, or 4 d prior to the FLC observation. While, as expected, the model skill deteriorates with an increasing temporal gap between the MSLP predictors and the time of FLC occurrence, the model is capable of predicting fog occurrence fairly well 1 d in advance, as the time series of day-to-day FLC occurrence features a significant autocorrelation of some days. To some
Figure 9. (a) Correlations (Pearson r) between the PCs (associated with the empirical orthogonal functions of the spatial wind patterns) and FLC cover in the central Namib. Stars mark correlations that are significant at the 0.01 level. Panels (b) and (c) show wind anomaly fields for PCs 3 and 4, respectively. For visual clarity, spatial wind anomalies are shown for regional cutouts of the spatial domain that is considered in the PCA and averaged to a 1◦×1◦resolution (see Sect. 2.4 for details on the analysis).
Figure 10. (a) The coefficients of the ridge regression used for classification of FLC days versus clear days. (b) Statistical measures of the performance of the ridge regression to classify FLC days versus clear days. The bars and related numbers describe the model skill using 06:00 UTC MSLP fields of the day of FLC observation and relate to (a). The colored dots show the model skill when the model is trained on MSLP fields of 1 to 4 d earlier. The abbreviations of the statistical measures stand for probability of detection (POD), false alarm rate (FAR), percent correct (PC), bias score (BS), critical success index (CSI), and the Heidke skill score (HSS). The equations of the statistical measures are given in Appendix B.
extent, this may be connected to the strong persistence of synoptic-scale dynamics in the subtropics. Even though the model only uses MSLP fields, ignoring, e.g., effects of radia-tive cooling due to moisture anomalies, surface temperatures, and seasonal characteristics, which have been shown to mod-ify FLC occurrence, the results still illustrate the potential of a dynamics-based statistical fog forecast in this region. It should be noted that changes in circulation additionally influ-ence upwelling intensity, (e.g., Hutchings et al., 2009) such
that some of the explained variability may also be attributed to factors influencing FLC formation rather than advection. However, due to the longer time scale of SST responses, and due to the marked contrasting differences in air mass history on FLC and clear days, the latter is thought to be the first-order mechanism leading to the high model skill.
It should be noted that the distinction between FLC and clear days is based on spatially and temporally averaged FLC occurrence (see Sect. 2.1) and that days are omitted that
fea-3430 H. Andersen et al.: Synoptic-scale controls of fog and low clouds in the Namib
ture an FLC cover between 3 % and 50 %. Also, the exact lo-cation and time of FLC occurrence is likely to be dependent on local temperature gradients and topography that lead to local modulation of winds (Lindesay and Tyson, 1990). Still, the model produces promising results that may be built upon in future studies by testing a similar model setup to predict the timing and duration of FLCs at specific locations.
4 Summary and conclusions
In this study, the occurrence of FLCs in the Namib Desert, derived from 14 years of satellite observations, is systemati-cally analyzed within the context of the regional climate and related to large-scale patterns of MSLP, Z500, T2m, LTS, SST, and TCWV, as well as Q and winds at different pres-sure levels from ERA5 reanalyses. The satellite data set of FLC occurrence is separated into FLC days and clear days, which are further investigated in terms of their meteorologi-cal conditions, air-mass histories, and statistimeteorologi-cal predictabil-ity during two seasons (AMJ and SON).
It is found that MSLP and Z500 patterns on FLC days are systematically and significantly different from clear days on synoptic scales. On FLC days, a systematic pattern of sig-nificantly lower MSLP over continental southern Africa is observed, which, in combination with higher pressure over a marine coastal region at about 20◦S, leads to an onshore flow anomaly of marine boundary-layer air. Together with significantly lower Z500 in the southeastern Atlantic re-gion on FLC days, these dynamic patterns are an indica-tion of synoptical-scale disturbances. These modify circu-lation systems, which in turn alter moisture transport, re-sulting in characteristic moisture patterns on FLC and clear days. Over the coastal boundary layer, the free troposphere is observed to be significantly drier on FLC days during both seasons, increasing radiative cooling, which likely in-creases FLC coverage, especially over the ocean where the dry anomaly is observed to be most pronounced. During AMJ, free-tropospheric moisture over the southern African continent is substantially increased, leading to greenhouse warming at the surface. While northerly warm air advection also contributes to the observed positive T2m anomalies on FLC days (during both seasons), the additional increase in T2m on FLC days during AMJ clearly corresponds to regions of increased free-tropospheric moisture content (correlation = 0.75). The increase in T2m leads to the development of a heat low that amplifies the upper-level, disturbance-induced low-MSLP anomaly, thereby contributing to the onshore flow anomaly of marine boundary-layer air masses. In the local-ized coastal region where FLCs typically occur, T2m is found to be significantly lower on FLC days, likely a combination of a local feedback of FLCs that slow down surface heating in the morning hours and air mass differences. A significant pattern of SST anomalies is found only in AMJ, with anoma-lously high SSTs off the coast possibly acting together with
increased near-surface winds to enhance surface latent heat fluxes, which may contribute to the observed higher levels of specific humidity in the marine boundary layer.
The analysis of back trajectories initialized in the central Namib at typical cloud level shows systematic differences in air-mass dynamics on FLC days and clear days. Air masses on FLC days are nearly exclusively transported within the marine boundary layer over the cool upwelling waters along the coastline, whereas clear days are frequently associated with subsiding northeasterly air masses, especially during AMJ. During SON, when advection of marine boundary-layer air masses can also occur on clear days, air masses on clear days feature significantly less moisture and tend to be advected from higher altitudes than on FLC days. The find-ings clearly demonstrate the strong dependence of FLC oc-currence in the central Namib on the advection of moist ma-rine boundary-layer air masses, contrasting the notion of pre-dominant radiation fog (Kaseke et al., 2017), but in agree-ment with many other studies (e.g., Olivier and Stockton, 1989; Seely and Henschel, 1998; Formenti et al., 2018; An-dersen et al., 2019; Spirig et al., 2019). These results are supported by a principal component analysis of near-surface winds that show a clear connection of FLC cover to synoptic-scale dynamics. Principal components of spatial wind pat-terns that feature positive onshore flow anomalies are pos-itively related to FLC cover. This relationship is especially strong during winter, when FLC occurrence is at its mini-mum, as then the dominant continental easterly flow typi-cally inhibits inland advection of FLCs or lotypi-cally developing FLCs. This suggests that during this time, a stronger dynam-ical forcing is needed to overcome this characteristic flow that is unfavorable for inland advection of cloudy marine boundary-layer air masses.
As the results show that spatial pressure patterns are con-nected to FLC occurrence, a ridge regression model is used to classify FLC days versus clear days based on regional MSLP fields. The resulting spatial pattern of model coefficients is similar to the observed MSLP anomaly patterns within the region of Namibia and the adjacent ocean areas. The spatial domain of relevant model coefficients seems to be smaller than the spatial extent of the pressure anomalies, probably because the regional fields contain information on synoptic-scale disturbance as well as local modulation. On this ba-sis, the model is capable of skillfully delineating FLC days from clear days. The model is trained with MSLP fields with different temporal offsets and found to be capable of skill-fully predicting FLC occurrence 1 d in advance, highlighting the potential of a statistical forecast of FLCs in this region. Future work should focus, however, on the development of a statistical model that links information on, e.g., MSLP, free-tropospheric moisture, SSTs, Z500, and aerosol loading with FLC occurrence in order to quantify the effects of the differ-ent processes and mechanisms outlined in this study.
Figure 11. Schematic overview over the synoptical-scale mechanisms that modify day-to-day variability in FLC occurrence in the central Namib during different seasons.
The findings of this study suggest that FLCs in the central Namib are facilitated by synoptic-scale disturbances in two main ways:
1. increased longwave cooling due to an anomalously dry free troposphere, especially over the ocean that in-creases low-cloud cover;
2. onshore flow anomaly of these cloudy marine boundary-layer air masses due to
a. disturbance-induced modulation of local winds, and
b. a heat low over continental southern Africa. The magnitude and characteristics of the disturbance and the related mechanisms depend on season, with a more pro-nounced disturbance during AMJ, when the typical dynamic setting is less conducive to FLC occurrence. Figure 11 is a schematic illustration that summarizes these seasonally varying mechanisms.
While a 14-year sample is not optimal to capture clima-tological variability, the mechanisms documented here for the first time are unlikely to be fundamentally different in other climatological periods. While it seems settled that, at least at the scales considered in this study, FLC occurrence is mostly driven by advective processes, the quantitative con-tributions of humidity and temperature changes and radia-tive cooling for low-cloud formation in the Namib during the advection of marine boundary-layer air masses are still un-clear. A heat budget analysis as in, e.g., Adler et al. (2019) or Babi´c et al. (2019), based on ground-based measurements conducted during the field campaign of the Namib Fog Life Cycle Analysis (NaFoLiCA) project (Spirig et al., 2019), is necessary to better understand the origin, development, and life cycle of FLCs within the advected marine
boundary-layer air masses. Future work should also focus on under-standing the local and possibly synoptic-scale drivers of the vertical structure of FLCs in the Namib region on diurnal to seasonal scales and the day-to-day variability in (marine) boundary-layer humidity. As FLCs in the Namib are clearly connected to marine stratus/stratocumulus clouds, findings of recent and ongoing field campaigns over the southeastern Atlantic (Zuidema et al., 2016; Formenti et al., 2019) and related insights concerning the aerosol–cloud–meteorology system of the Namibian stratocumulus cloud field (e.g., Ade-biyi and Zuidema, 2018; Andersen and Cermak, 2015; Dia-mond et al., 2018; Formenti et al., 2019; Fuchs et al., 2017, 2018; Gordon et al., 2018) are relevant to fully understand FLCs in the Namib Desert.
3432 H. Andersen et al.: Synoptic-scale controls of fog and low clouds in the Namib
Appendix A: Free-tropospheric moisture transport and temperature anomalies
Figure A1. Seasonal averages of Q and winds at 700 hPa on (a, d) FLC days, (b, e) clear days, and (c, f) their difference during (a–c) AMJ and (d–f) SON.
Figure A2. Seasonal average ERA5 T2m and 10 m winds in SON (left-hand panels) and AMJ (right-hand panels) for FLC (top) and clear (bottom) days. Winds are averaged to a 1◦×1◦resolution.
3434 H. Andersen et al.: Synoptic-scale controls of fog and low clouds in the Namib
Appendix B: Equations of statistical validation measures POD = a a + c PC = a + d a + b + c + d FAR = b a + b CSI = a a + b + c BS = a + b a + c HSS = 2(ad − bc) (a + c)(c + d) + (a + b)(b + d),
with a as the number of hits, b as the number of false alarms, c as the number of misses, and d as the number of cor-rect negatives.